


Using the BCG matrix is a common practice for businesses to evaluate the performance of their products and services in the market, and to devise strategies to increase the revenue that they can get from these products and services. A highly efficient portfolio management tool, the BCG matrix was developed in the early 1970s by Boston Consulting Group founder Bruce Henderson. Today, we will analyze the BCG matrix of Toyota and have a sneak peek into how these products are really doing in the market.
Background of Toyota
Toyota has been one of the world’s leading car manufacturers for over eight decades now. The company was founded in Japan by Toyoda Kiichiro in 1933, initially as a division of the loom works company owned by his father Toyoda Sakichi. The company quickly enjoyed local success but it wasn’t until the late 1950s that they gained international recognition, following the release of the Land Cruiser. Today, the company has a net worth of $223.53 billion and has an extensive product portfolio that includes trucks and minivans, on top of the passenger cars.
Toyota BCG Matrix Analysis
From the passenger cars that they started with, Toyota has since expanded to luxury vehicles, hybrid cars, SUVs, and a range of vehicle components that are being sold internationally. They even offer financing services to dealers and affiliates. In this BCG matrix for Toyota, we will see how these products and services are performing so far.
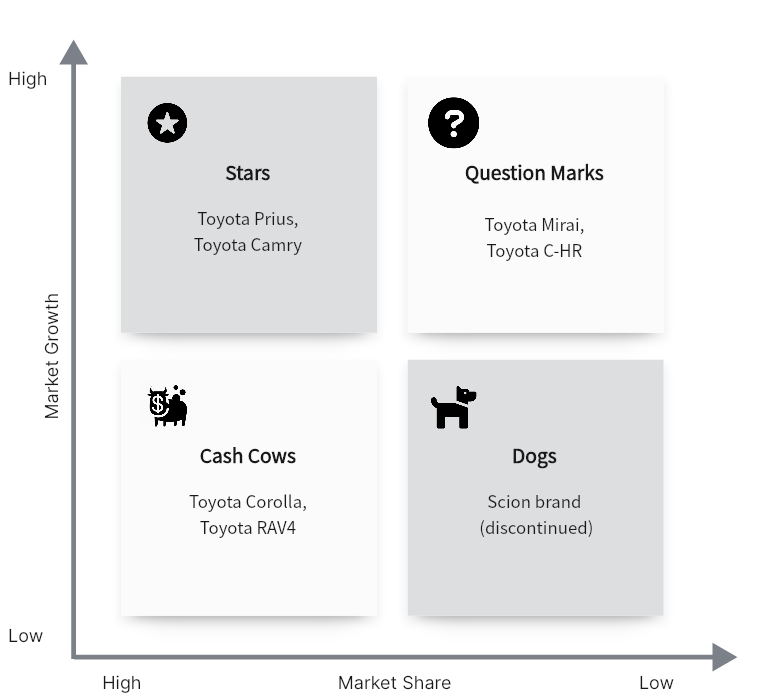
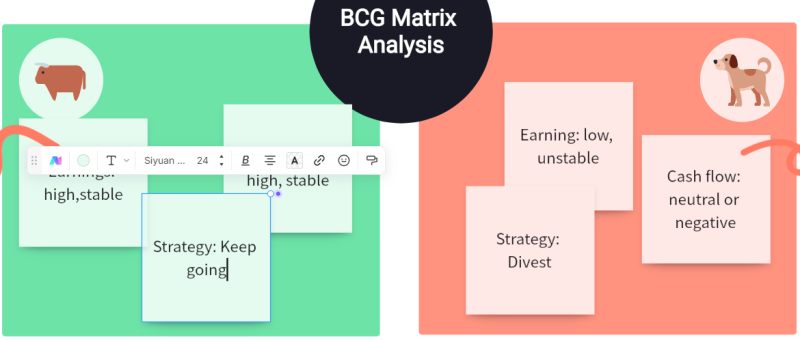
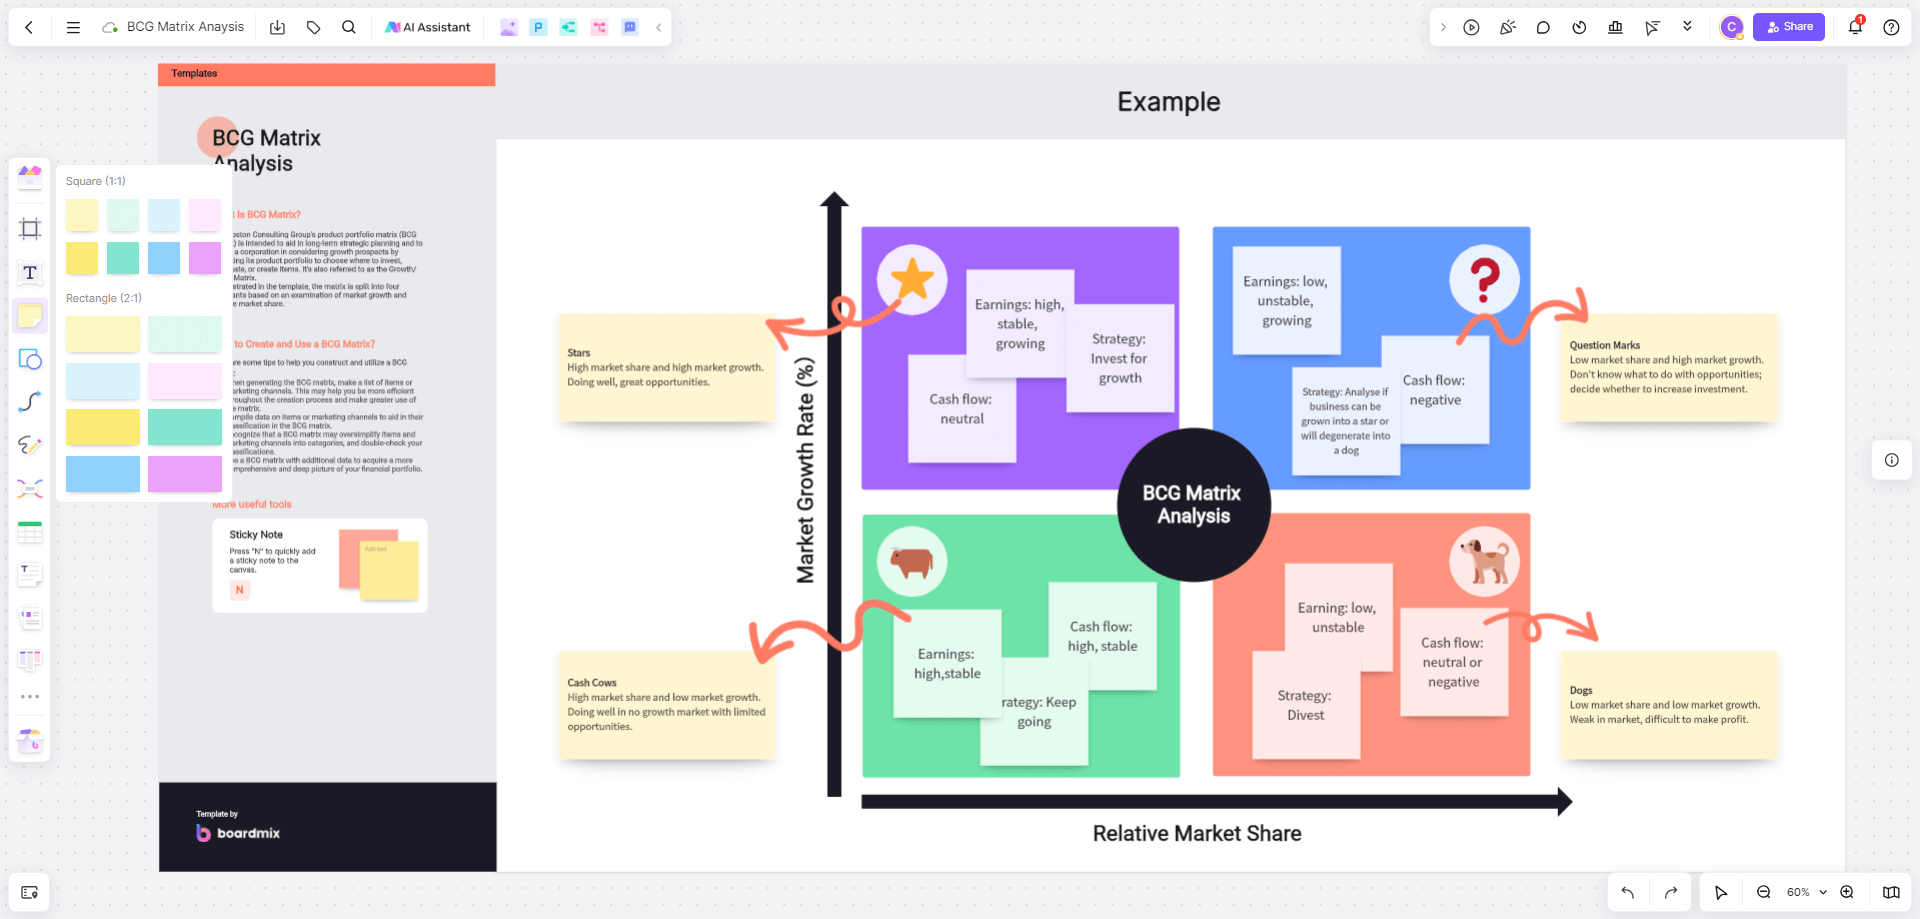
Toyota BCG Matrix Analysis Created in Boardmix
The vehicle industry is a rapidly changing one, so we can expect a lot of changes in the BCG matrix of Toyota in different periods. Let’s take a look at the dominant products in each category as of today.
Stars
Stars are the products that are making a lot of money in a market that is still also growing quickly. In the BCG matrix for Toyota, there are three products that are clearly stars – the Lexus, the Prius, and the Land Cruiser. These vehicles appeal to different consumers, and each one is showing great results in their respective markets.
Question Mark
Question marks are relatively new products that do not have a definitive status yet. The hybrid versions of the Camry and the Corolla are right in this category. Joining them is the new electric car, Mirai. The C-HR, although already discontinued in the US and Canada, is still a question mark in other parts of the world.
Cash Cows
Toyota’s sedans remain to be the most stable revenue generators for the company. This is why the Camry and the Corolla are snugly in this category, as their high sales are not really affected by other changes in the industry. The RAV4 can also be considered a cash cow as it has brought in consistently impressive revenue to this day.
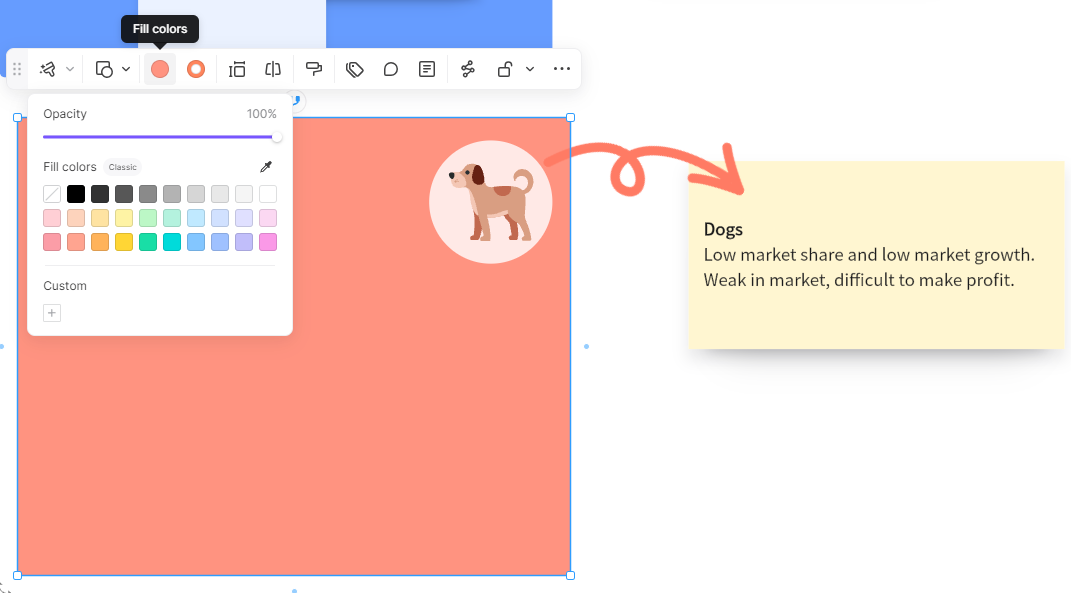
Dogs
The dogs in the BCG matrix for Toyota are the vehicles that are no longer generating the expected revenue. Most car models would eventually fall into this category when demand shifts to newer models. Today, some of Toyota’s dogs are the Scion, the Celica, the Crown, and the Tundra.
Mastering BCG Matrix Creation on Boardmix
The Boston Consulting Group (BCG) Matrix is a vital tool for strategic management, allowing you to visualize a company's product portfolio and identify growth opportunities. Here's how you can create a BCG Matrix on Boardmix:
1. Login and Create a New Board
First, log into your Boardmix account. Once logged in, click on ‘New Board'. This gives you a fresh canvas to work on.

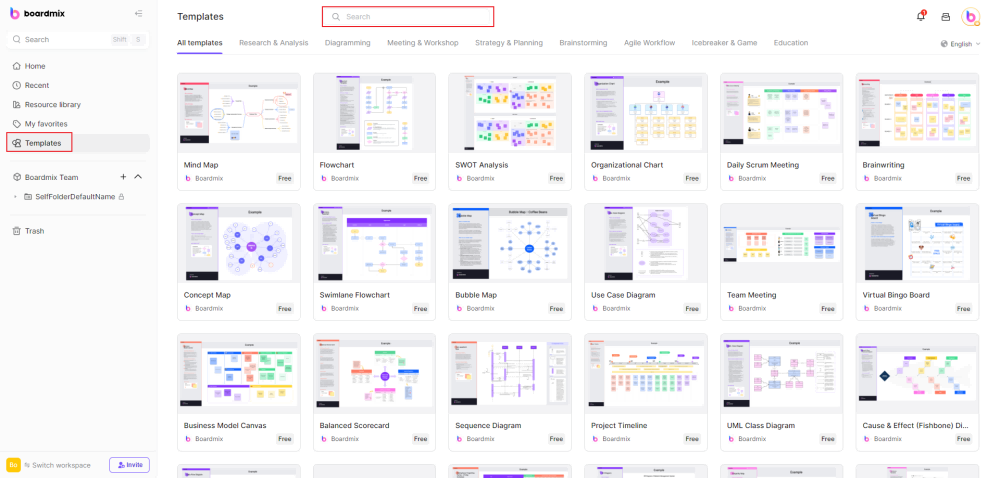
2. Draw the BCG Matrix Grid or Use a Template
The BCG Matrix consists of a 2x2 grid. Use the ‘shape' tool in the toolbar to create this grid. You will need two perpendicular lines intersecting in the middle to form four quadrants. You can also search for the BCG Matrix template in the template library and use it for free.
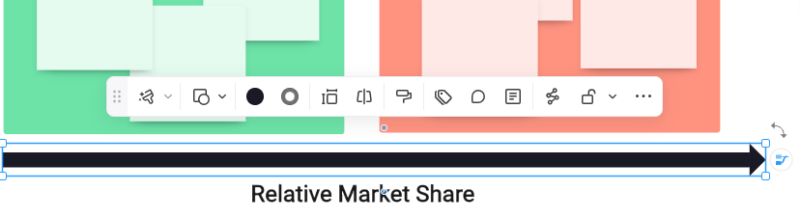
3. Label the Axes
Next, label your axes. The y-axis usually represents the market growth rate, while the x-axis represents the relative market share. You can add these labels using the 'text' tool from the toolbar.
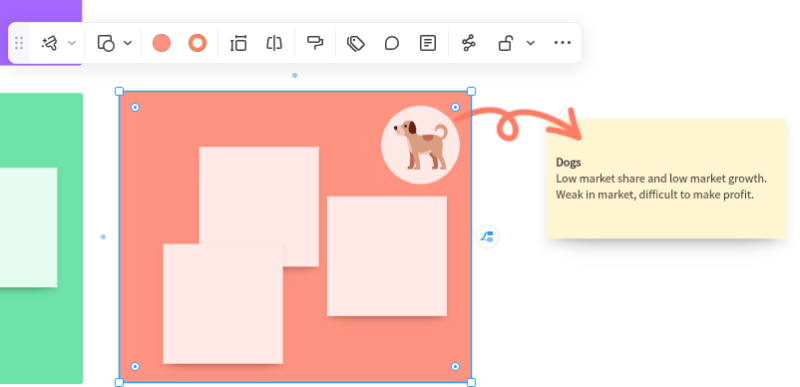
4. Add Quadrant Labels
Each quadrant in the BCG Matrix represents a different product category: Cash Cows (high market share, low market growth), Dogs (low for both), Stars (high for both), and Question Marks (low market share, high market growth). Use the text tool again to add these labels.
5. Plot Products
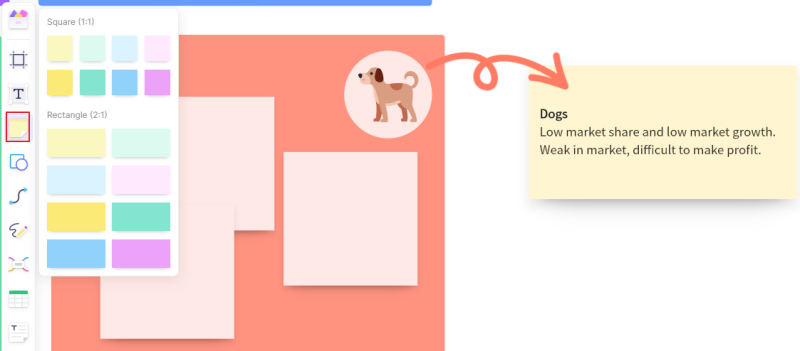
Start plotting your products or business units in the appropriate quadrants based on their market share and growth rate. You can use different shapes or colors for each product to make them distinguishable.
6. Customize Your Diagram
Boardmix offers various customization options. Feel free to change colors, add patterns, or adjust sizes as needed to create a visually engaging BCG Matrix
 .
.
7. Add Notes or Annotations
If needed, add any notes or annotations for clarification using the text tool. This can be especially helpful when sharing your BCG Matrix with others who might not be familiar with all the products or units plotted.
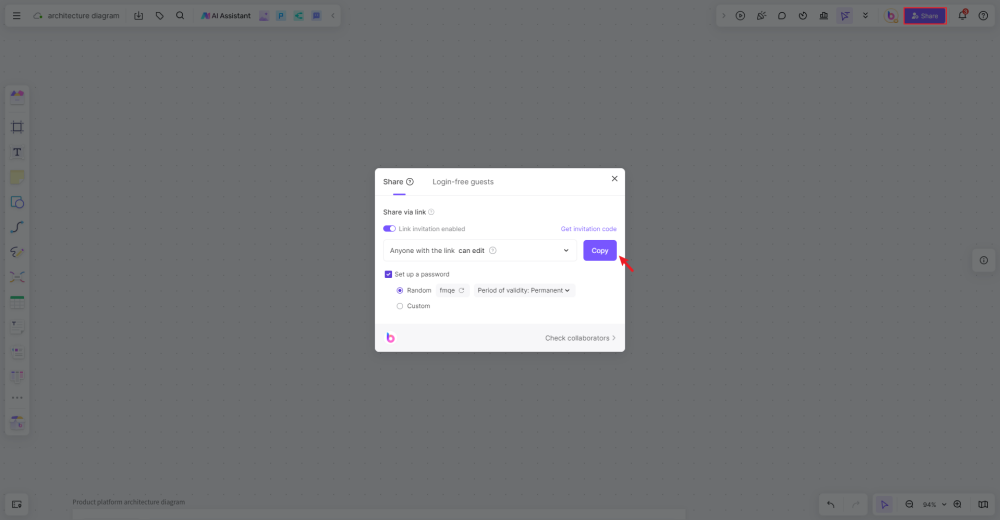
8. Save and Share Your BCG Matrix
Once you're happy with your BCG Matrix, save it on Boardmix's secure cloud storage for future reference. You can also share your diagram with colleagues or stakeholders via email or direct link.
Creating a BCG Matrix on Boardmix can significantly enhance your strategic planning process by providing a clear visualization of your product portfolio's current state and highlighting potential areas of growth or investment.
Key Takeaways
As can be expected for a company that is primarily focused on vehicles, products will constantly shift from being a question mark to eventually turning into a dog. New models are always coming out and presently, hybrids and other sustainable options are replacing petrol vehicles, which are gradually being phased out. These movements can be clearly seen in the BCG matrix of Toyota, where classic sedans Camry and Corolla have been cash cows for years, while relative newcomers are still question marks.
With the quickly changing market, creating a BCG matrix for Toyota can be challenging but you can make it easier by using a flexible and easy to use BCG matrix template, like the one available at Boardmix. Check out their available tools and find a large selection of practical business templates you can use.
References
https://embapro.com/frontpage/bcgcoanalysis/17761-toyota-motor
https://scholar.harvard.edu/files/tnkomo/files/analysis_of_toyota.pdf
https://prezi.com/j-ti5mei93ge/bcg-of-toyota/
https://britannica.com/topic/Toyota-Motor-Corporation


