Regardless of industry, companies use various marketing strategies to ensure their services and products reach their market and drive sales. This includes the BCG matrix. The framework has been helpful to companies since 1968 so they can better understand the best products they have and guide them in business model analysis.
With the many products Coca-Cola has, you can expect they also have their BCG Matrix to assess how they stand in the market. You may have heard of Coke, but it's just one of the drinks you'll see in the matrix. Continue reading to know more.
Background of Coca-Cola
Originating as a medicinal tonic in the late 19th century, the Coca-Cola Company's creation can be attributed to John Smith Pemberton. However, it was Asa Griggs Candler's efforts in the 20th century that transformed Coca-Cola into a prominent player in the soft drink market. This historical trajectory underscores the evolution of a product that transitioned from a medicinal concoction to a widely recognized beverage.
While almost everyone knows how Coca-Cola products taste, its recipe remains a trade secret. The company generally creates concentrates, which are then sold to licensed distributors of Coca-Cola worldwide. The bottles with exclusive contracts with the company will use the concentrates combined with sweeteners and filtered water to produce the drinks in bottles and cans.
These bottlers then distribute and market Coca-Cola to restaurants, retail stores, and vending machines. They can also sell concentrates to food service retailers and major soda restaurants. Instead of producing drinks cans and bottles from its main manufacturing plant, Coca-Cola strategically distributes its drinks to licensed manufacturers worldwide.
Coca-Cola BCG Matrix Analysis
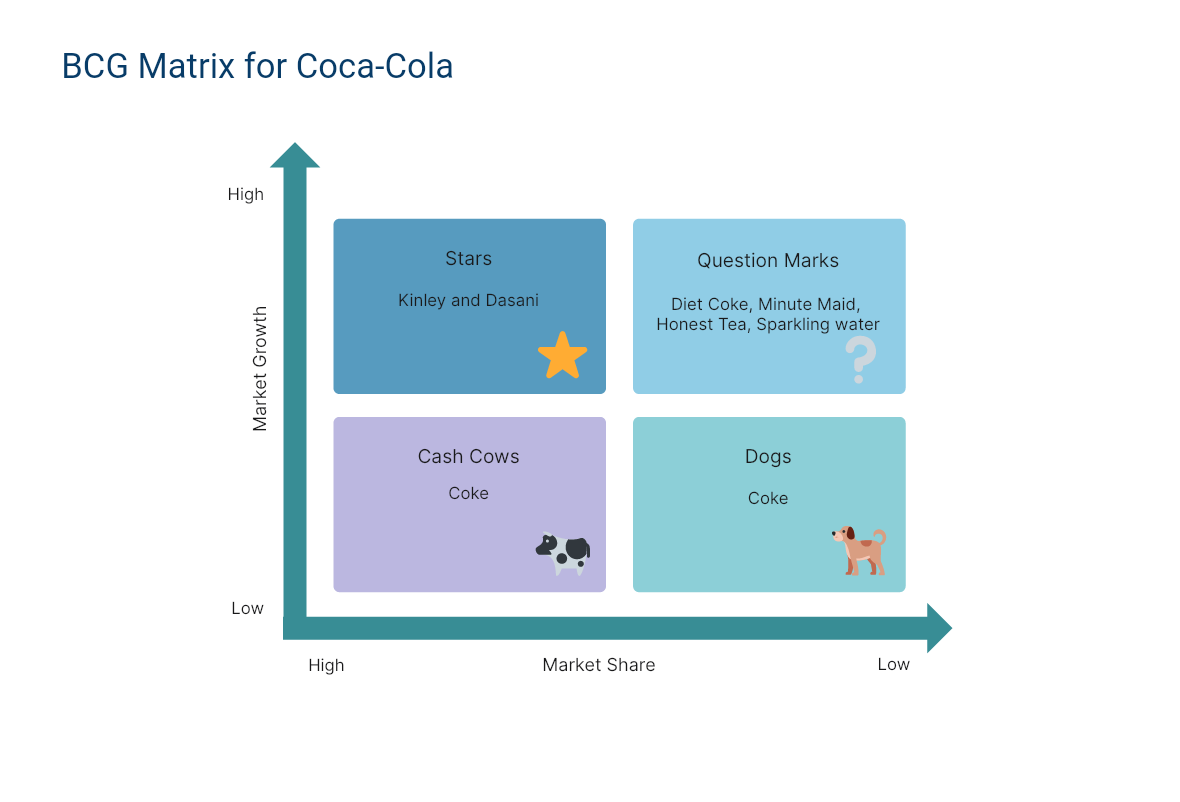
The BCG Matrix for Coca-Cola includes four quadrants. Each section is significant in assessing the product's performance in the market. Whether you're a startup and want to know how Coca-Cola organizes its matrix or a student who is looking to learn more about this matrix, the illustration and explanations below are for you.
Stars
The products under this section have high market share and growth. While people would think soft drinks are the most successful product from Coca-Cola, a bottled water brand is the company's star. Kinley and Dasani fall under the Stars quadrant of the Coca-Cola BCG matrix. These two are the leading bottled waters from Coca-Cola, which operates in two different geographic locations.
Kinley caters to European markets, whereas Dasani holds a preference in the United States. With rising demand for healthier beverages, the Star segment in the BCG matrix anticipates Coca-Cola reaching a wider market, offering opportunities for additional investments. This underpins the company's ongoing commitment to invest in sparkling and flavored water products.
Question Mark
The question mark segment of a BCG matrix refers to products and services still at the development stage. This means they have yet to create significant market reach, sales, and profit impacts. They're promising products that can pave the way for a broader market if companies can handle their development effectively.
As you can see, the Coca-Cola BCG matrix Diet Coke, Minute Maid, Honest Tea, and Sparkling Water as the drinks in the question mark segments. These are drinks newly launched by Coca-Cola to cater to the growing market of non-carbonated drink consumers. With most people's consciousness about having a healthy lifestyle, they will also tend to find healthier drink options.
Cash Cows
Coke stands as the Cash Cow within Coca-Cola's BCG matrix, serving as the market leader and a substantial revenue generator for the company. Coke is everywhere: on bending machines, fast food, restaurants, supermarkets, and in households. This means it has a high market share. Cash cows have lower market growth, but it does not mean the company is not reaping considerable revenues from them. The product under this segment has solidified its position in the market, so the company must invest more to sustain profitability.
However, companies must also be careful with cash cows as they might be insignificant if the demand and market environment change.
Dogs
Indeed, Coca-Cola owes much of its market acclaim to its flagship product, Coke. Curiously, within the Coca-Cola BCG matrix, Coke is categorized as a dog. These represent offerings with limited growth prospects, possessing a modest market and growth share. This classification emphasizes the company's diversified portfolio, where strategic considerations are made to optimize the overall product mix.
With healthier options trending everywhere, there is an expected decline in carbonated soft drinks, to which Coke belongs. If the trend continues, Coke, which is currently under the cash cow segment of this matrix, will now be permanently placed under the dog quadrant. While there might still be Coke consumers in the future, it will not be as many as decades ago.
Mastering BCG Matrix Creation on Boardmix
The Boston Consulting Group (BCG) Matrix is a vital tool for strategic management, allowing you to visualize a company's product portfolio and identify growth opportunities. Here's how you can create a BCG Matrix on Boardmix.
1. Login and Create a New Board
First, log into your Boardmix account. Once logged in, click on ‘New Board'. This gives you a fresh canvas to work on.

2. Draw the BCG Matrix Grid or Use a Template
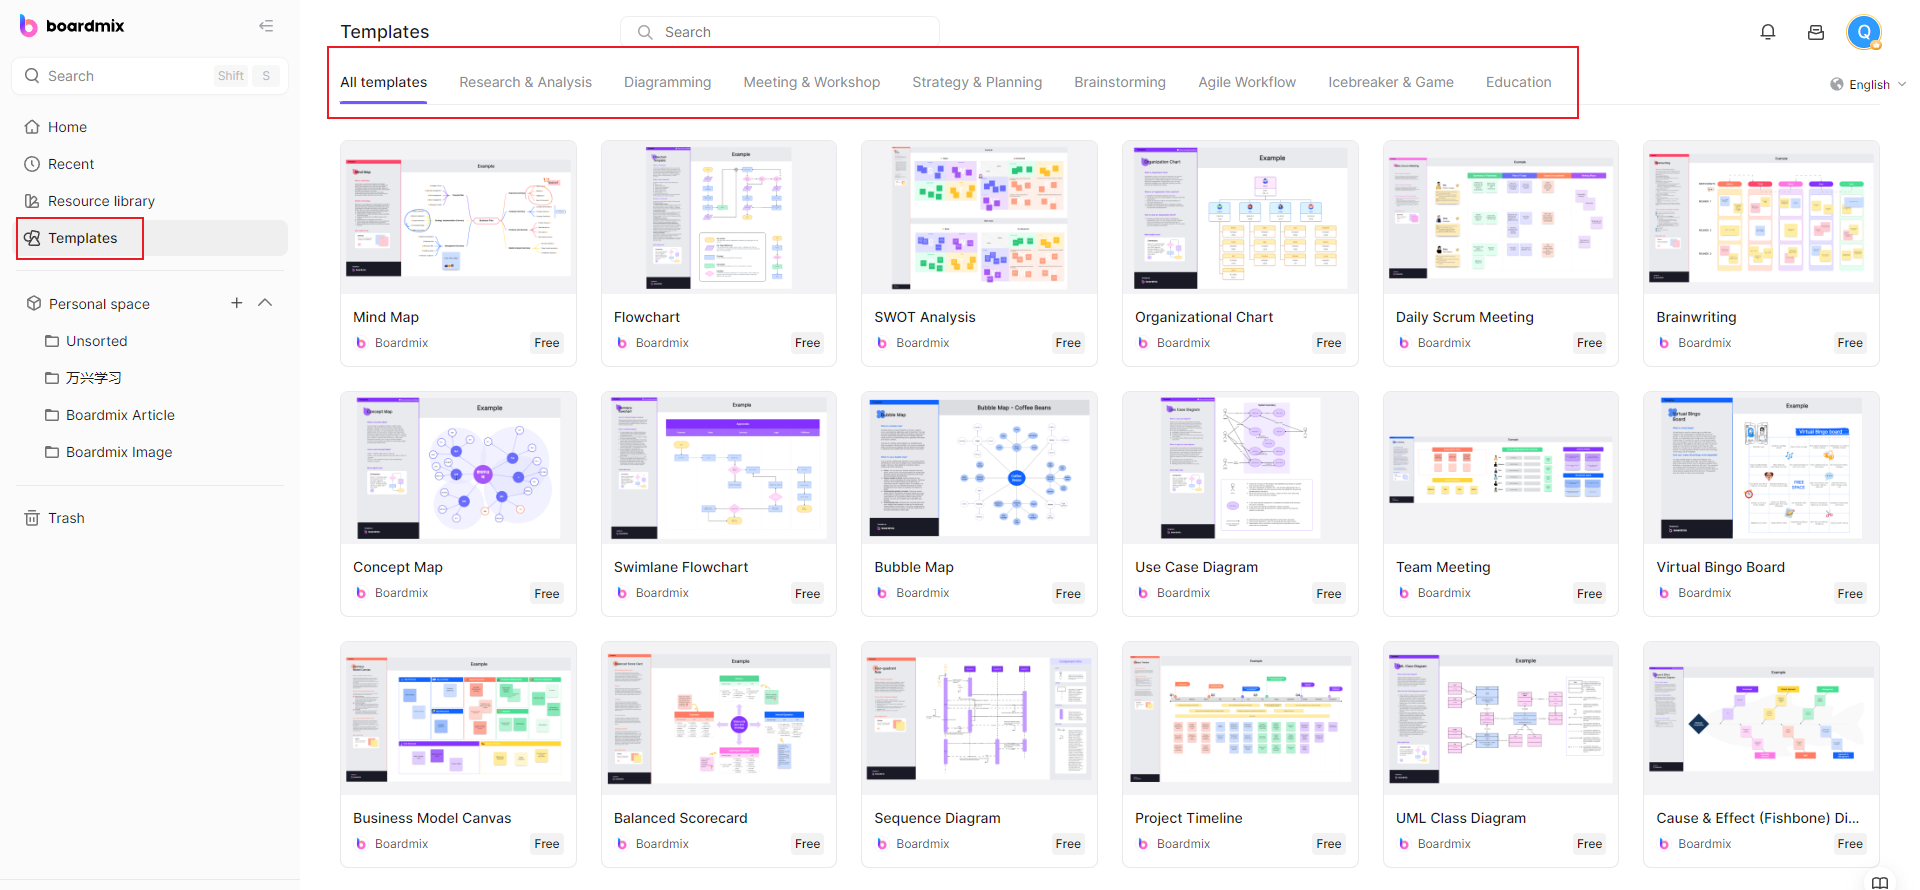
The BCG Matrix consists of a 2x2 grid. Use the ‘shape' tool in the toolbar to create this grid. You will need two perpendicular lines intersecting in the middle to form four quadrants. You can also search for the BCG Matrix template in the template library and use it for free.
3. Label the Axes
Next, label your axes. The y-axis usually represents the market growth rate, while the x-axis represents the relative market share. You can add these labels using the 'text' tool from the toolbar.

4. Add Quadrant Labels
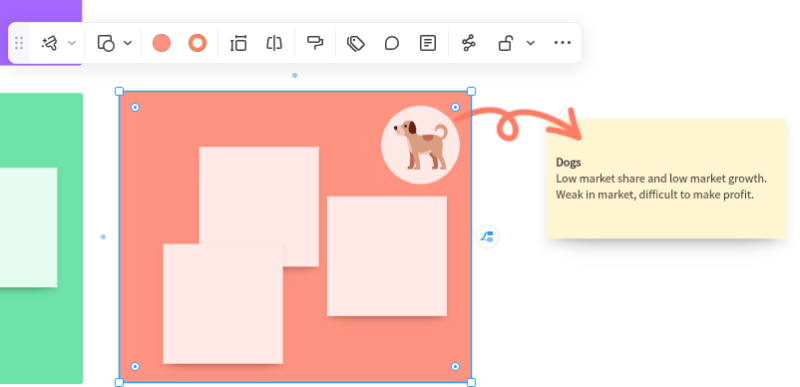
Each quadrant in the BCG Matrix represents a different product category: Cash Cows (high market share, low market growth), Dogs (low for both), Stars (high for both), and Question Marks (low market share, high market growth). Use the text tool again to add these labels.
5. Plot Products
Start plotting your products or business units in the appropriate quadrants based on their market share and growth rate. You can use different shapes or colors for each product to make them distinguishable.

6. Customize Your Diagram
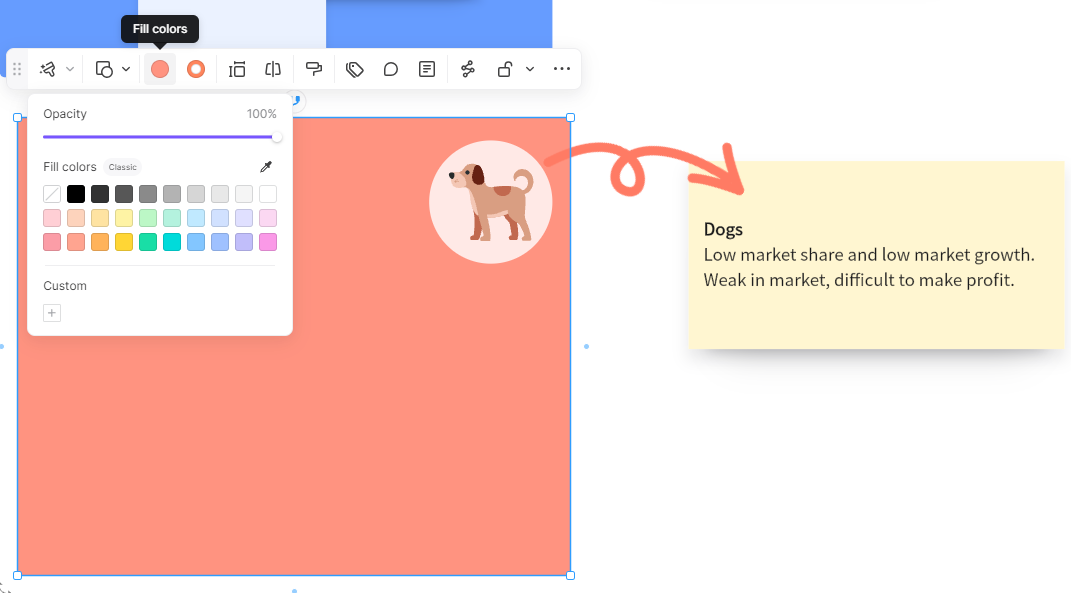
Boardmix offers various customization options. Feel free to change colors, add patterns, or adjust sizes as needed to create a visually engaging BCG Matrix
 .
.
7. Add Notes or Annotations
If needed, add any notes or annotations for clarification using the text tool. This can be especially helpful when sharing your BCG Matrix with others who might not be familiar with all the products or units plotted.
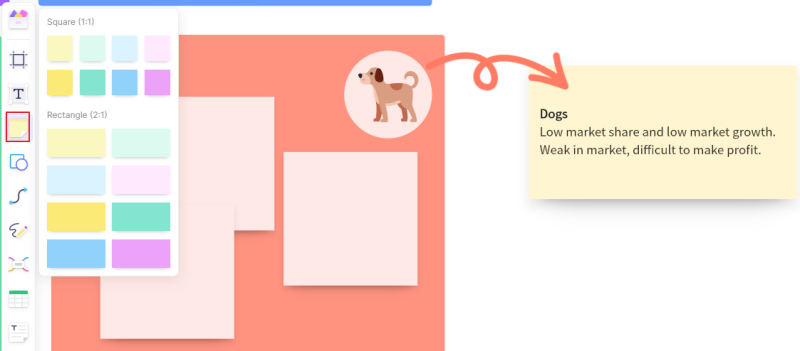
8. Save and Share Your BCG Matrix
Once you're happy with your BCG Matrix, save it on Boardmix's secure cloud storage for future reference. You can also share your diagram with colleagues or stakeholders via email or direct link.
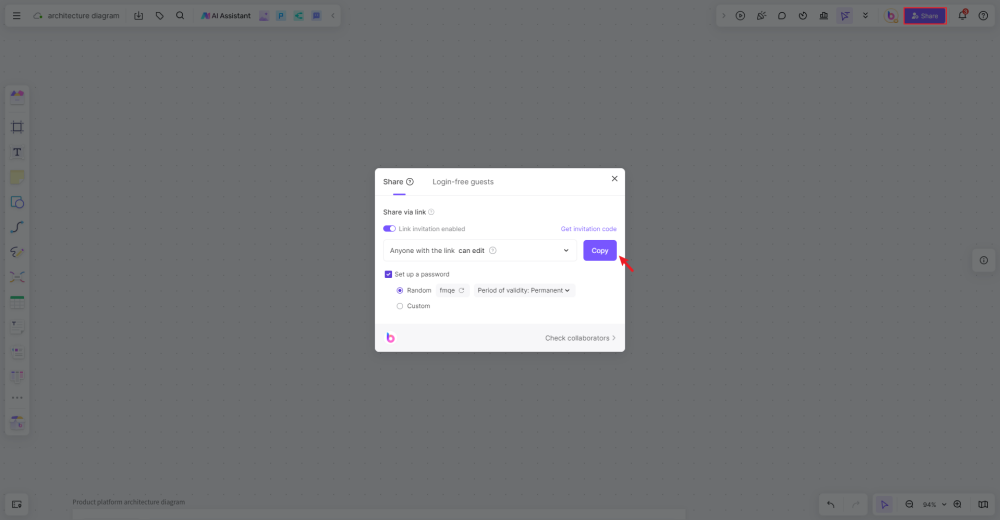
Creating a BCG Matrix on Boardmix can significantly enhance your strategic planning process by providing a clear visualization of your product portfolio's current state and highlighting potential areas of growth or investment.
Key Takeaways
The Coca-Cola BCG Matrix is an excellent business planning reference for companies wanting to introduce drinks and other beverages to their market. The matrix is relatively easy to create as you only need to fill in the four segments. However, one must also understand each segment to supply details on the diagram.
Boardmix offers a ready-made BCG matrix at your disposal. The template allows for personalized adjustments in terms of colors, margins, and shapes. Additionally, you have the flexibility to incorporate unique elements such as stickers and images. Boardmix also allows creators to formulate their own BCG matrix using a blank whiteboard. All templates and diagrams are accessible to others if you provide them with a link to your project. It makes collaboration easy as you can authorize them to access and edit the document from anywhere.
References
The BCG Growth-Share Matrix. (2023, May 24). https://www.investopedia.com/terms/b/bcg.asp
BCG Matrix of Coca-Cola in a Simplified Way. (2021, December 4). https://businessmavericks.org/bcg-matrix-of-coca-cola/


