


The BCG Matrix and the GE 9-Cell Matrix, also known as the GE-McKinsey Matrix, are two popular strategic management tools. While both aim to help corporations analyze their business portfolio and guide investment decisions, they have some fundamental differences.
What is the GE 9-Cell Matrix?
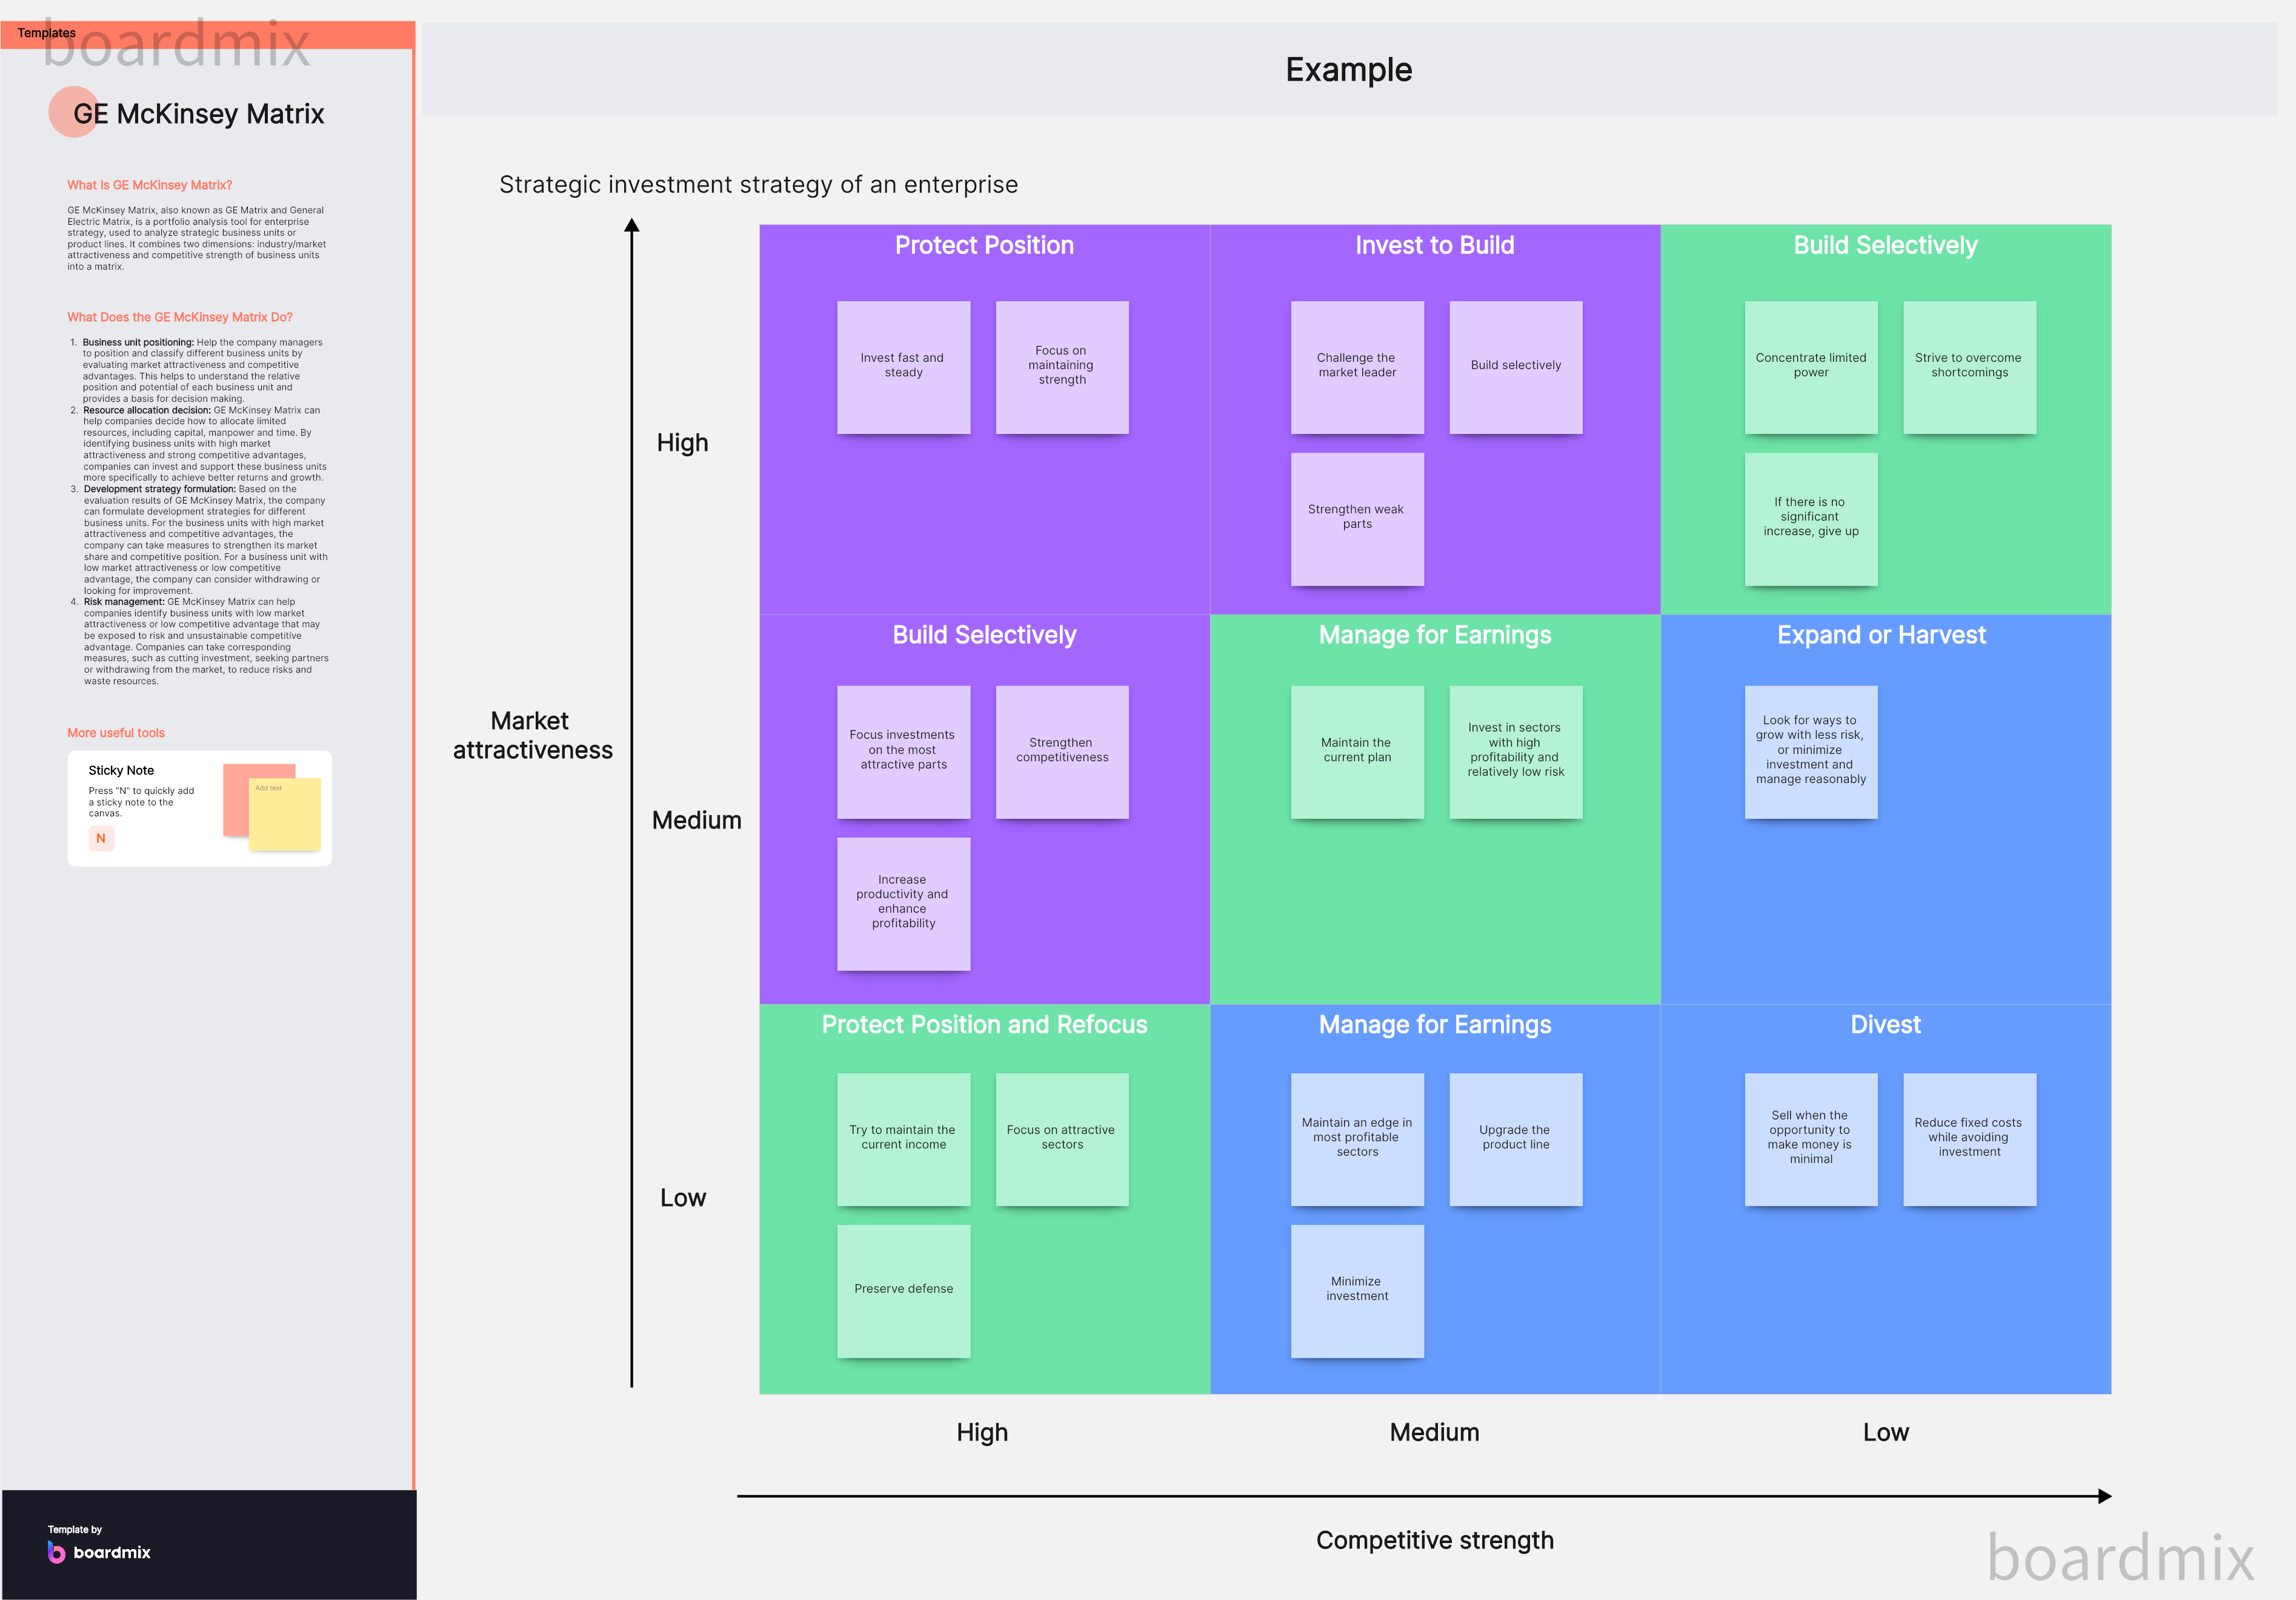
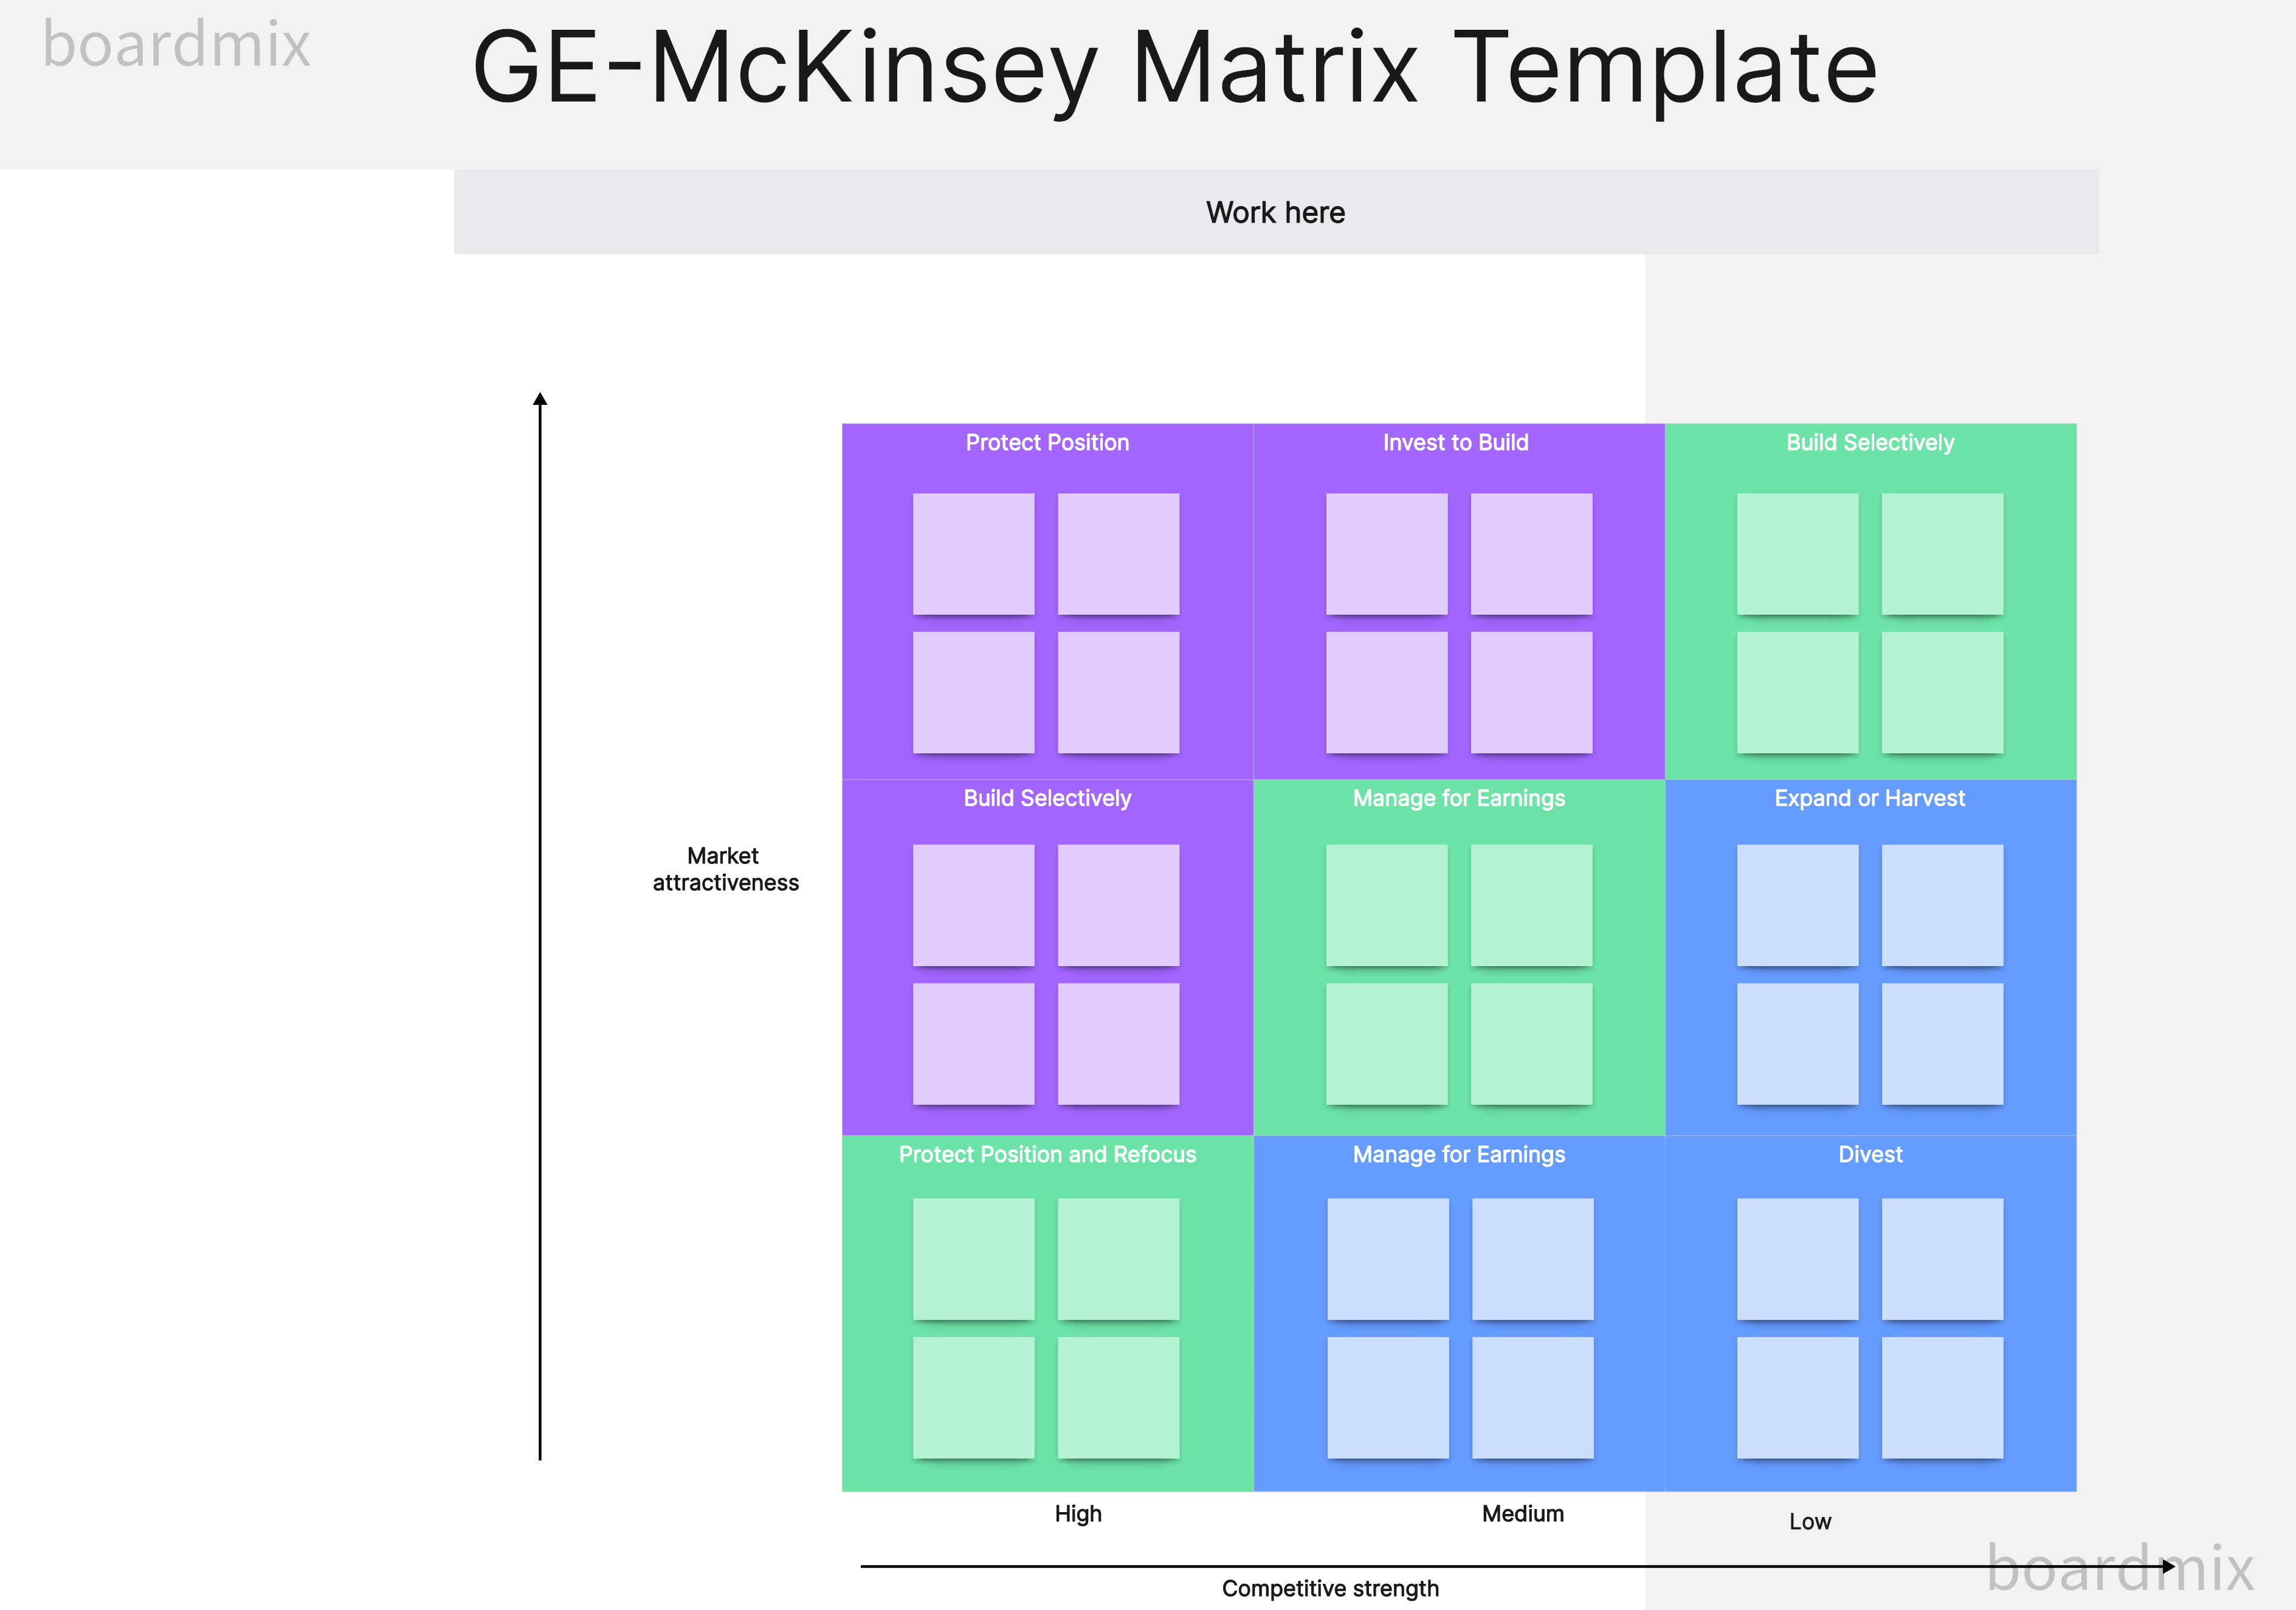
The GE 9-Cell Matrix, often referred to as the GE Matrix, is a strategic business tool used by businesses for managing a diversified product portfolio. The GE 9-Cell Matrix is a nine-cell (3x3) grid that classifies business units based on two critical dimensions: industry attractiveness and business unit strength. It provides a more intricate evaluation of the company's business units as compared to other matrix models, such as the BCG Matrix.
Key Uses of the GE-McKinsey Matrix
Portfolio Management: The GE-McKinsey Matrix helps in analyzing and managing a company's product portfolio. It visualizes a company's business units on a grid, providing insights on where to invest, disinvest, or continue investments.
Investment Decisions: By classifying business units based on market attractiveness and business strength, the matrix helps companies make informed decisions on where to allocate resources and investments.
Strategic Analysis: This matrix allows businesses to assess the strength of their products or business units against the attractiveness of their respective industries. This strategic analysis helps them understand their competitive position in the marketplace.
Risk Management: The diversified analysis provided by the matrix enables companies to manage risks better by ensuring resources and investments are not concentrated in one area but spread across multiple prospects based on their potential returns.
The Nine Cells of GE-McKinsey Matrix
The GE-McKinsey Matrix uses a nine-cell (3x3) grid that classifies business units based on two main factors:
Market Attractiveness: This includes aspects like market size, market growth rate, market profitability, pricing trends, competitive intensity, and technological developments.
Business Unit Strength: This considers elements like company's market share, brand reputation, product quality, distribution access, cost structure, and customer loyalty.
Based on these two dimensions, each cell suggests a different strategic action:
High Attractiveness/High Strength: These units should receive heavy investment for growth and market leadership.
Medium Attractiveness/Medium Strength: These units should be invested in selectively for maintenance or possible growth.
Low Attractiveness/Low Strength: These units should be divested or phased out unless they hold some strategic purpose.
The GE-McKinsey Matrix is an invaluable tool for large, multi-product organizations. It guides decision-making around growth strategies and resource allocation, offering a comprehensive overview of the organization's position in different markets. However, its use requires deep, detailed market analysis and internal evaluation to feed into its multiple-factor assessment.
What is the BCG Matrix?
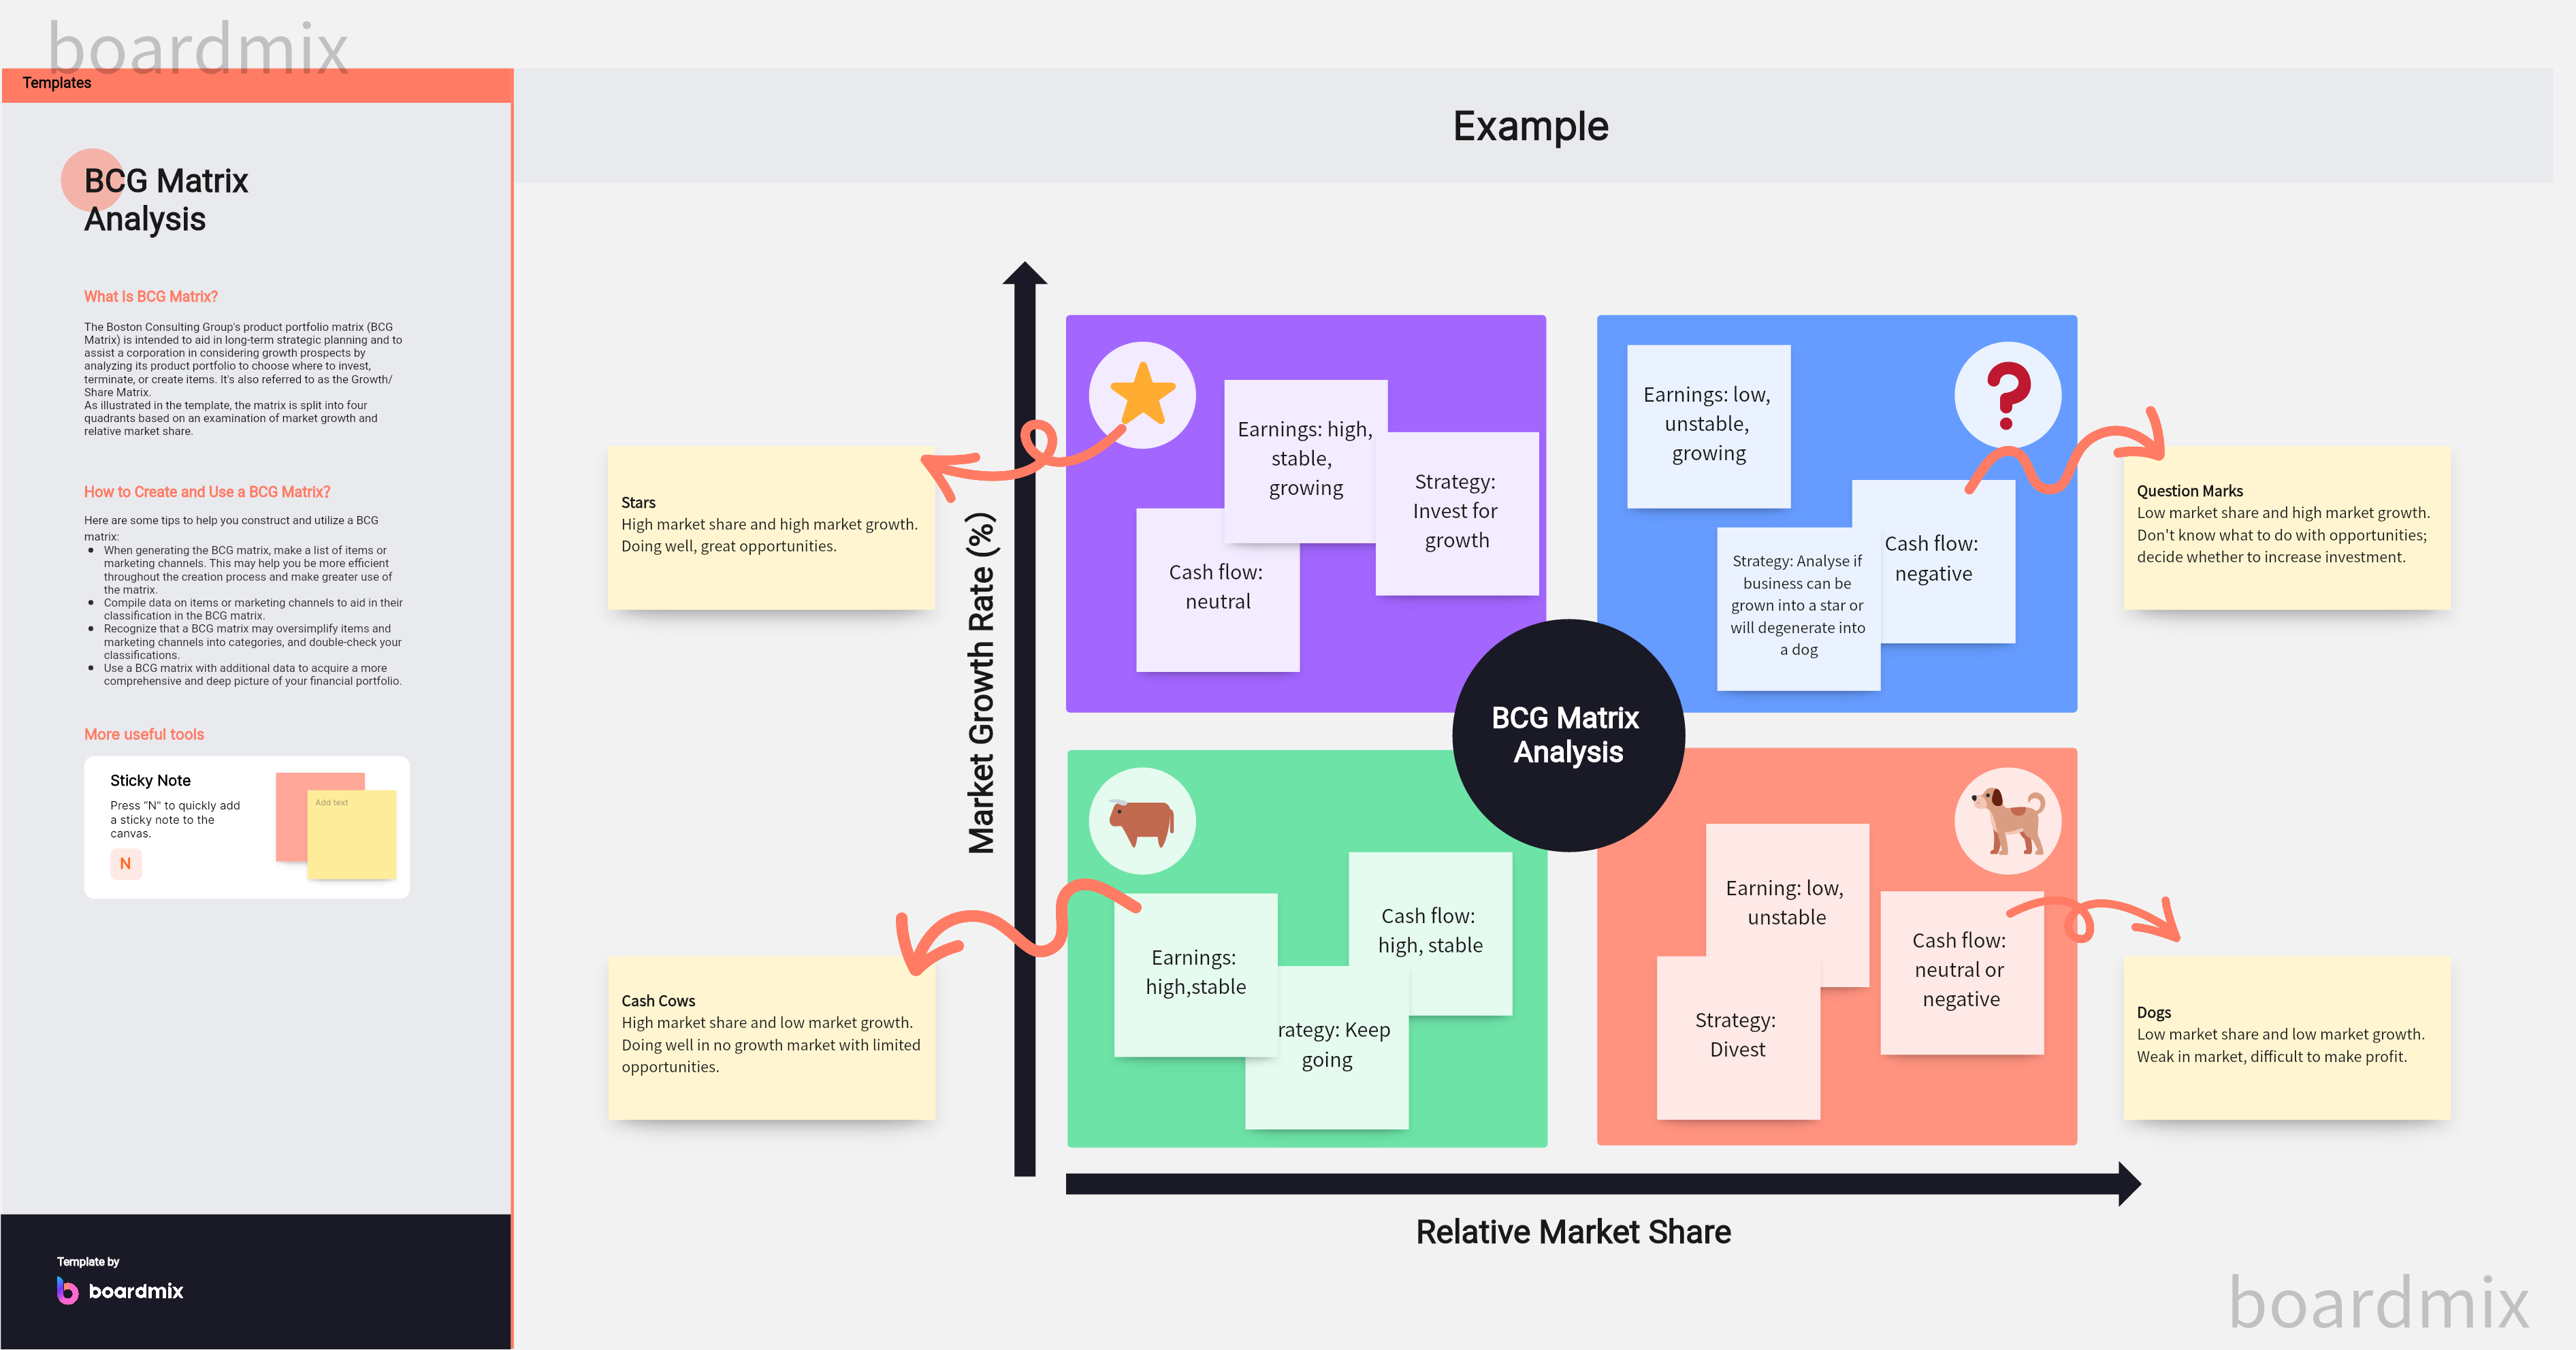
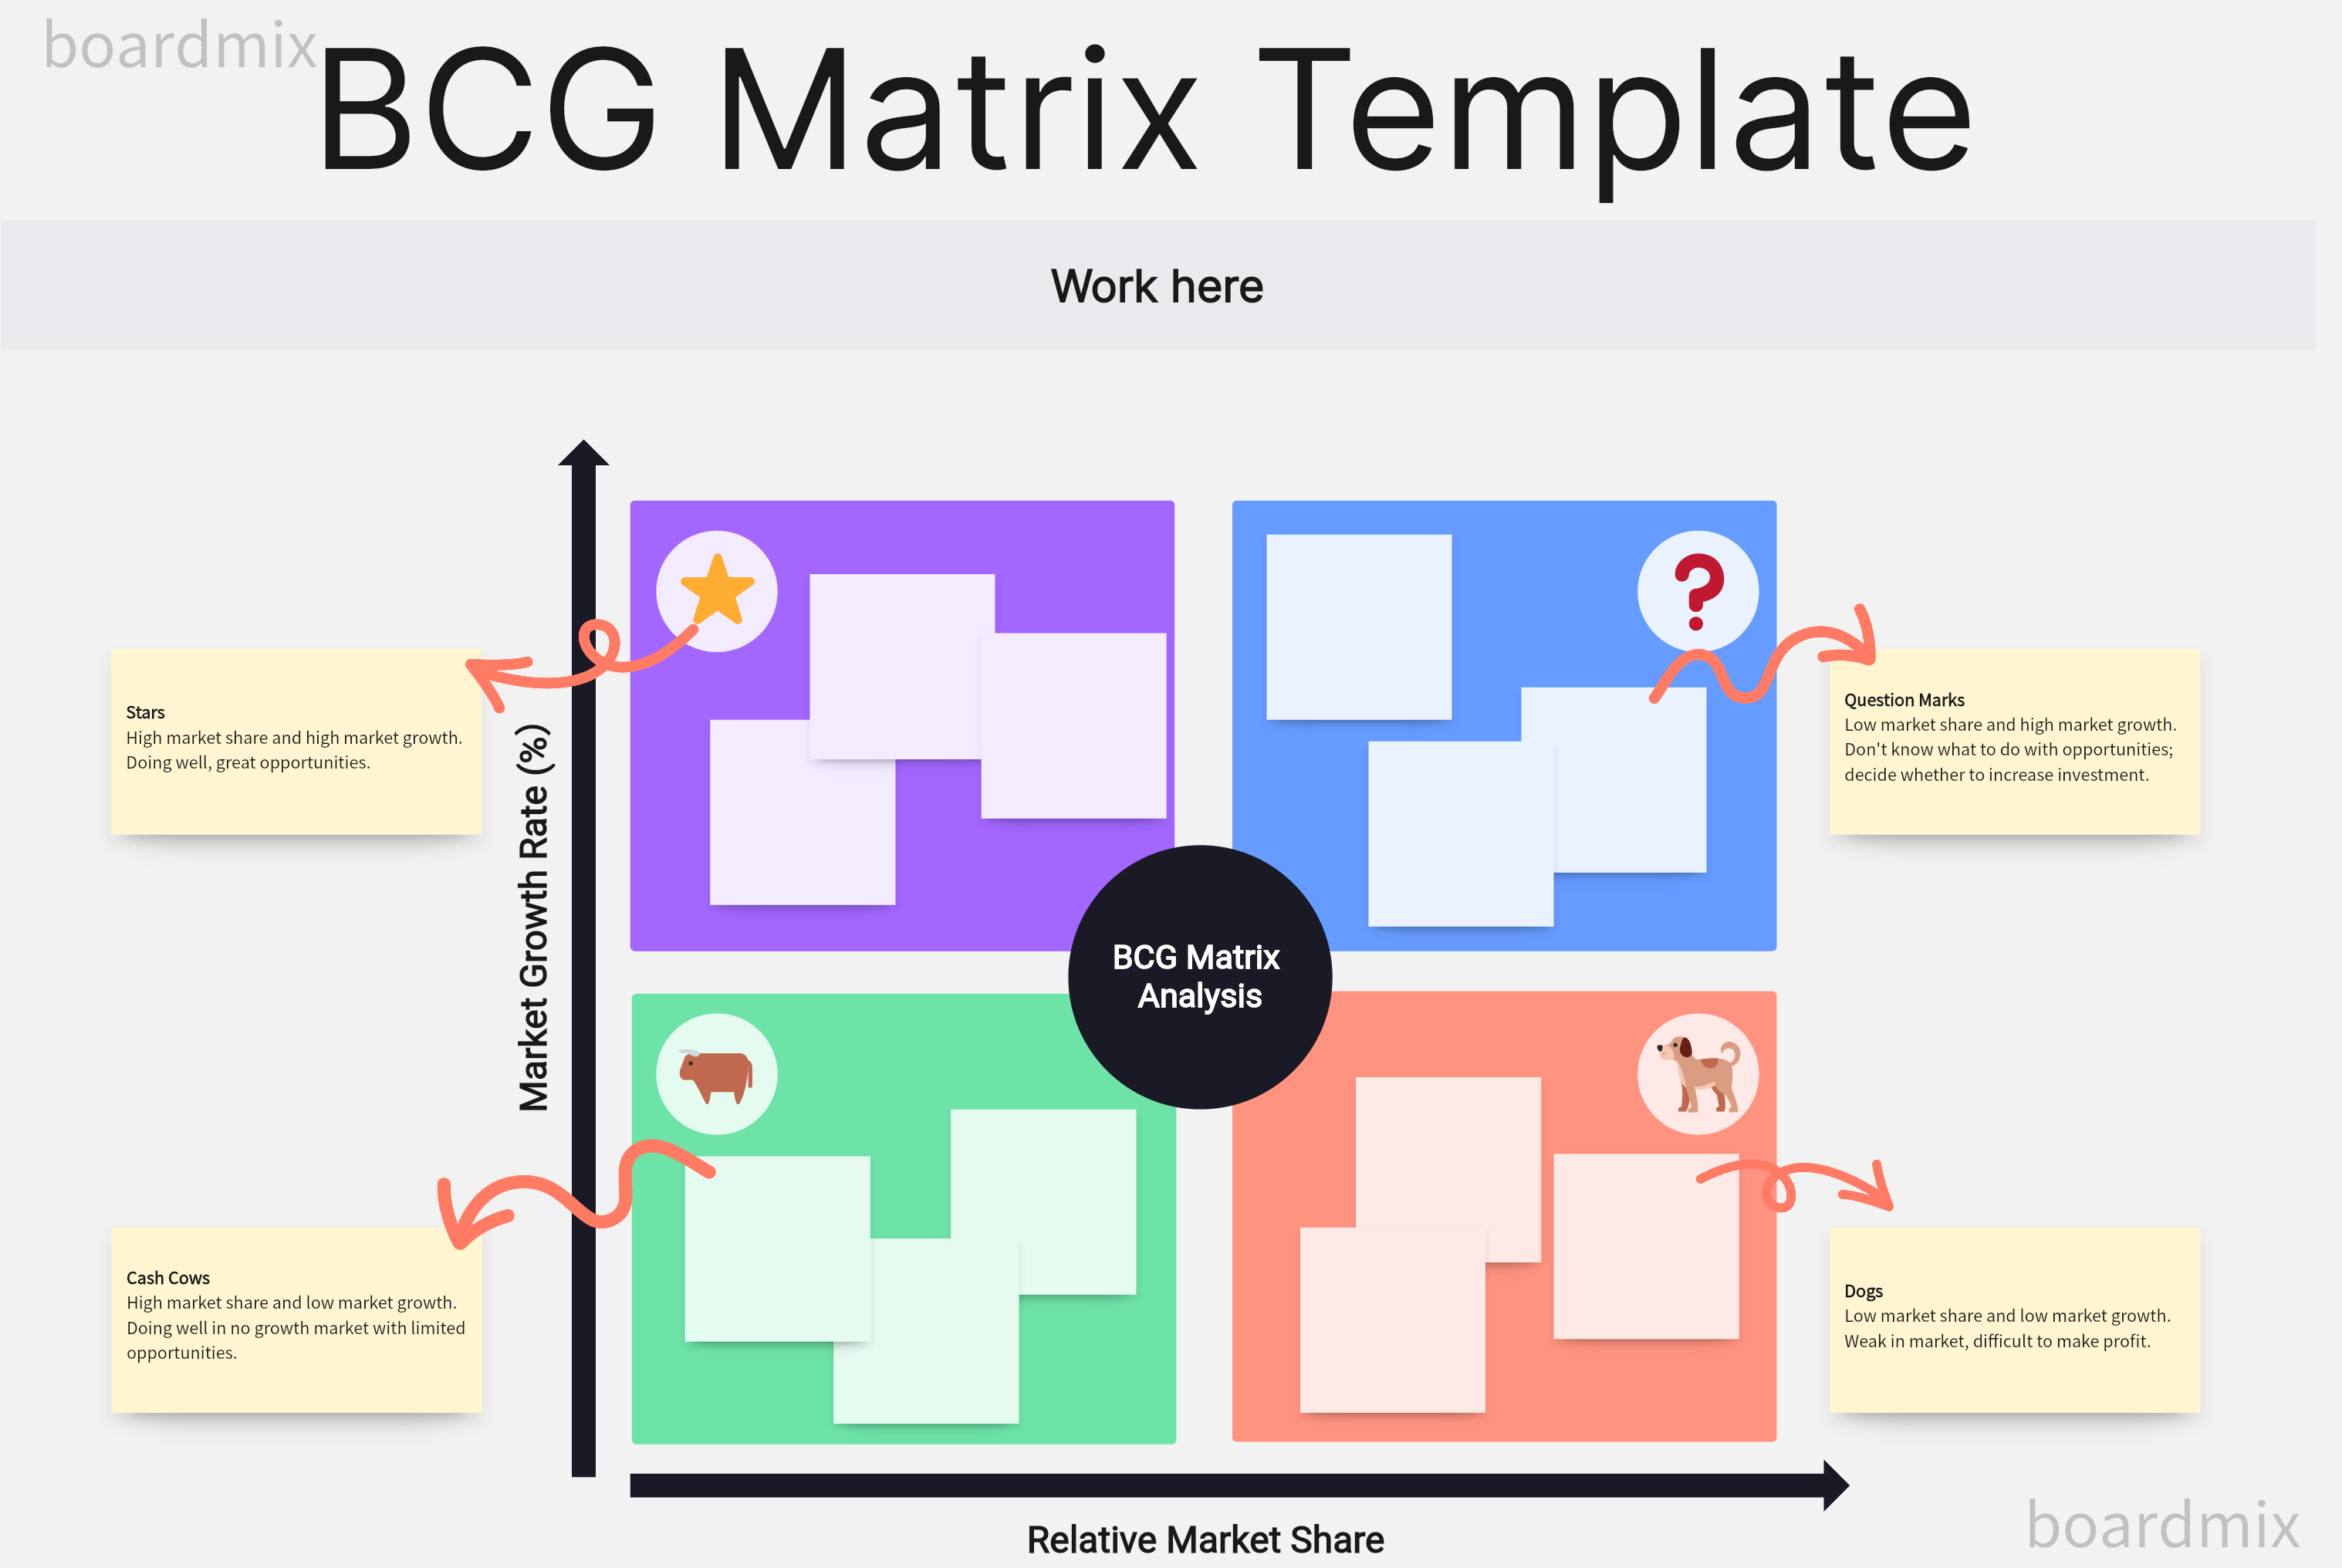
The BCG Matrix, developed by the Boston Consulting Group, is a four-cell (2x2) grid that categorizes business units based on two dimensions: relative market share (which represents competitive advantage) and market growth rate (which indicates market attractiveness). It provides a graphical representation of a company's business units or product lines to help identify their growth opportunities and prioritize investments.
Try for Free
Key Uses of the BCG Matrix?
Portfolio Analysis: The BCG Matrix is primarily used for portfolio analysis, allowing companies to evaluate different units or products in their business based on their growth rates and market share.
Resource Allocation: By categorizing business units into four quadrants—Stars, Question Marks, Cash Cows, and Dogs—the BCG Matrix assists businesses in deciding where to allocate resources.
Strategic Planning: The BCG Matrix provides a foundation for strategic planning. By identifying high-growth prospects (Stars and Question Marks) and steady revenue generators (Cash Cows), businesses can plan their growth trajectory and investment strategy.
Competitive Positioning: The BCG Matrix aids in understanding the competitive position of a company's different business units within the market. This information can help in strategizing market penetration, market development, or product development efforts.
The Four Quadrants of BCG matrix
Each quadrant in the BCG matrix represents a specific strategic business unit (SBU) classification:
Stars: These are high-growth, high-market-share units. They are seen as future leaders of the company and hence require high investments to maintain their growth rate.
Cash Cows: These are low-growth, high-market-share units. With their steady revenue stream, these units should be "milked" to fund other strategic business units.
Question Marks: These are high-growth, low-market-share units. They represent potential future stars, but since they don't generate much cash, they need substantial investment to grow market share.
Dogs: These are low-growth, low-market-share units. Since they neither generate significant cash nor have high growth potential, they are often considered for divestiture.
In conclusion, the BCG Matrix serves as an invaluable tool for companies to analyze their product portfolio, manage investments, and develop growth strategies effectively. It offers a simple yet highly effective way to visualize and manage a diversified portfolio.
What is the difference between BCG matrix and GE 9 cell matrix?
When GE 9-Cell Matrix vs. BCG Matrix, there are some main differences between them.
Dimension Parameters: The BCG Matrix uses market growth rate and relative market share as parameters, while the GE 9-Cell Matrix uses industry attractiveness and business unit strength as its dimensions.
Resolution: The GE 9-Cell Matrix, with nine cells, offers a finer resolution compared to the four-cell BCG Matrix. This feature provides a more nuanced analysis of business units.
Measurement Factors: The GE 9-Cell Matrix involves more factors for assessing industry attractiveness and business unit strength than the BCG Matrix's market growth rate and relative market share measures.
Strategic Implications: While the BCG Matrix suggests investment strategies based on cash generation and usage, the GE 9-Cell Matrix focuses more on future potential by considering industry attractiveness.
In conclusion, both the BCG Matrix and the GE 9-Cell Matrix serve to guide strategic planning through portfolio analysis. However, their approach differs based on dimension parameters, resolution, measurement factors, and strategic implications. Therefore, the choice between these matrices depends on a company's specific needs, strategic goals, and business context.
What is a major advantage of the GE matrix over the BCG matrix?
The GE Matrix and the BCG Matrix are widely used strategic planning tools for portfolio management. However, when compare GE 9-Cell Matrix vs. BCG Matrix , the GE Matrix offers a significant advantage over the BCG Matrix: its greater complexity and sophistication, which allows for a more nuanced, detailed, and strategic analysis of business units.
The Advantage of the GE Matrix: Detailed Evaluation
One major advantage of the GE Matrix, or GE-McKinsey Nine Box Matrix, over the BCG Matrix is the level of detail it provides in its analysis. The GE Matrix evaluates a business's potential and performance on two key factors.
Business Unit Strength: This is assessed by considering multiple internal factors such as the strength of the management team, product quality, brand equity, cost structure, and market share.
Market/Industry Attractiveness: This is gauged by analyzing several external factors like market growth rate, market size, competitive intensity, market profitability, technological advancements, and overall industry risk.
This multiple-factor assessment on a nine-cell matrix offers a more comprehensive evaluation of each business unit's relative position within the industry. As a result, this allows for more refined strategic decision-making based on an all-rounded assessment.
The Limitation of BCG Matrix: Simplicity
In contrast, the BCG Matrix, developed by the Boston Consulting Group, provides a more simplified view. It classifies business units based on relative market share and market growth rate only. Although these factors are essential, they may not provide a comprehensive picture of a business unit's potential. This limitation can potentially lead to oversimplified strategic decisions.
While both matrices are valuable for portfolio analysis and strategic planning, the complexity and detailed evaluation offered by the GE Matrix give it an edge over the BCG Matrix. By taking into account more internal and external factors in its evaluation, the GE Matrix provides a broader perspective and supports more informed, strategic decision-making. However, the choice between these two tools would depend on the company's strategic needs, the nature of its portfolio, and its resources to carry out the analysis.
Why are BCG matrix and GE nine cell matrix useful for corporate portfolio analysis?
The BCG Matrix and GE 9-Cell Matrix are invaluable strategic management tools that help corporations understand their business portfolio's health and dynamics. These matrices allow companies to evaluate their strategic business units (SBUs) based on distinct factors, providing clear inputs for decision-making about resource allocation, investment, and divestment.
The BCG Matrix: Understanding Market Dynamics and Resource Allocation
Market Share and Growth Rate Insights: The BCG Matrix, with its axes of relative market share and market growth rate, helps companies assess their SBUs' performance in the market context. It provides a snapshot of the current standing and growth prospects of various products or business units.
Resource Allocation Strategy: Each quadrant of the BCG Matrix — Stars, Cash Cows, Question Marks, and Dogs — indicates different investment needs and cash generation abilities. This classification helps strategize resource allocation by identifying where to invest for future growth (Stars and Question Marks) and where to harvest profits for funding growth investments (Cash Cows).
Portfolio Balance: The BCG Matrix helps maintain a balanced portfolio. For sustainable success, a corporation should have a mix of Cash Cows (to generate cash) and Stars (for future growth), along with judicious investments in Question Marks. Dogs, unless they have some strategic relevance, are usually earmarked for divestiture.
The GE 9-Cell Matrix: In-depth Evaluation for Strategic Decisions
Detailed Parameters for Analysis: The GE 9-Cell Matrix evaluates SBUs on two broad parameters—industry attractiveness and business unit strength—each comprised of several sub-factors. This multiple-factor analysis allows a more nuanced understanding of each business unit's position within the industry.
Strategic Investment Decisions: The nine cells of the matrix provide more granular insights into where companies should invest heavily (High Attractiveness/Strong Strength), moderately (Medium Attractiveness/Medium Strength), or divest (Low Attractiveness/Weak Strength).
Risk Management: By mapping out business units across the matrix's diverse cells based on their potential returns and strategic importance, companies can effectively spread their risk and not overly rely on any single business unit or market.
In conclusion, both the BCG Matrix and GE 9-Cell Matrix serve crucial roles in corporate portfolio analysis by providing actionable insights for strategic planning, resource allocation, investment decisions, and risk management. The choice between these two tools depends on the specific context and needs of the corporation.
Boardmix: Get Editable GE 9-Cell Matrix and BCG Matrix for Free
In today's fast-paced business world, strategic tools like the GE 9-Cell Matrix and BCG Matrix play a crucial role in helping companies analyze their business units or product lines. Boardmix understands this need and provides free, editable, and printable versions of these matrices.

Try for Free
1. Accessing the GE 9-Cell and BCG Matrices
Log into your Boardmix account and head over to the "Templates" section. Here, you will find a vast array of templates for various strategic tools, including the GE 9-Cell Matrix and BCG Matrix.

Try for Free
2. Editing the Matrices
Once you've chosen the matrix that suits your needs, Boardmix offers a seamless editing experience. You can add business units, adjust their positions, and customize the design elements like colors or fonts with just a few clicks.
3. Saving Your Matrices
After making the necessary changes, you can save the matrices directly to your Boardmix account. Thanks to Boardmix's cloud-based storage, you can access your saved matrices at any time from anywhere.
4. Exporting Your Matrices
When you're ready to share your strategic matrices with your team or stakeholders, Boardmix provides several exporting options. You can export your matrices in various formats such as PDF, PNG, or JPEG to seamlessly integrate them into presentations or reports.
5. Printing Your Matrices
Boardmix also supports printing directly from the platform. This means you can have a physical copy of your matrices with just a few clicks.
6. Collaborative Design
Boardmix takes collaboration to a whole new level by allowing teams to work on the same matrix simultaneously in real-time. You can share the editable matrix with your team members, facilitating effective brainstorming and strategic planning sessions.
In conclusion, Boardmix provides comprehensive solutions for your strategic planning needs with its free, editable, and printable GE 9-Cell Matrix and BCG Matrix templates. It combines convenience, versatility, and collaboration to ensure a productive strategic planning process.


