


The GE-McKinsey Matrix is a strategic planning tool used to evaluate a company's business portfolio and make resource allocation decisions. In this article, we will explain it with detailed examples to illustrate how to use it in real business and how to draw your Matrix with the GE-McKinsey Matrix template.
What is the GE-McKinsey Matrix?
The GE-McKinsey Matrix, also known as the Nine-box Matrix, is a strategic management tool used for business portfolio planning. The matrix provides a systematic approach for multi-business corporations to prioritize their investments among various business units.
Structure of the GE-McKinsey Matrix
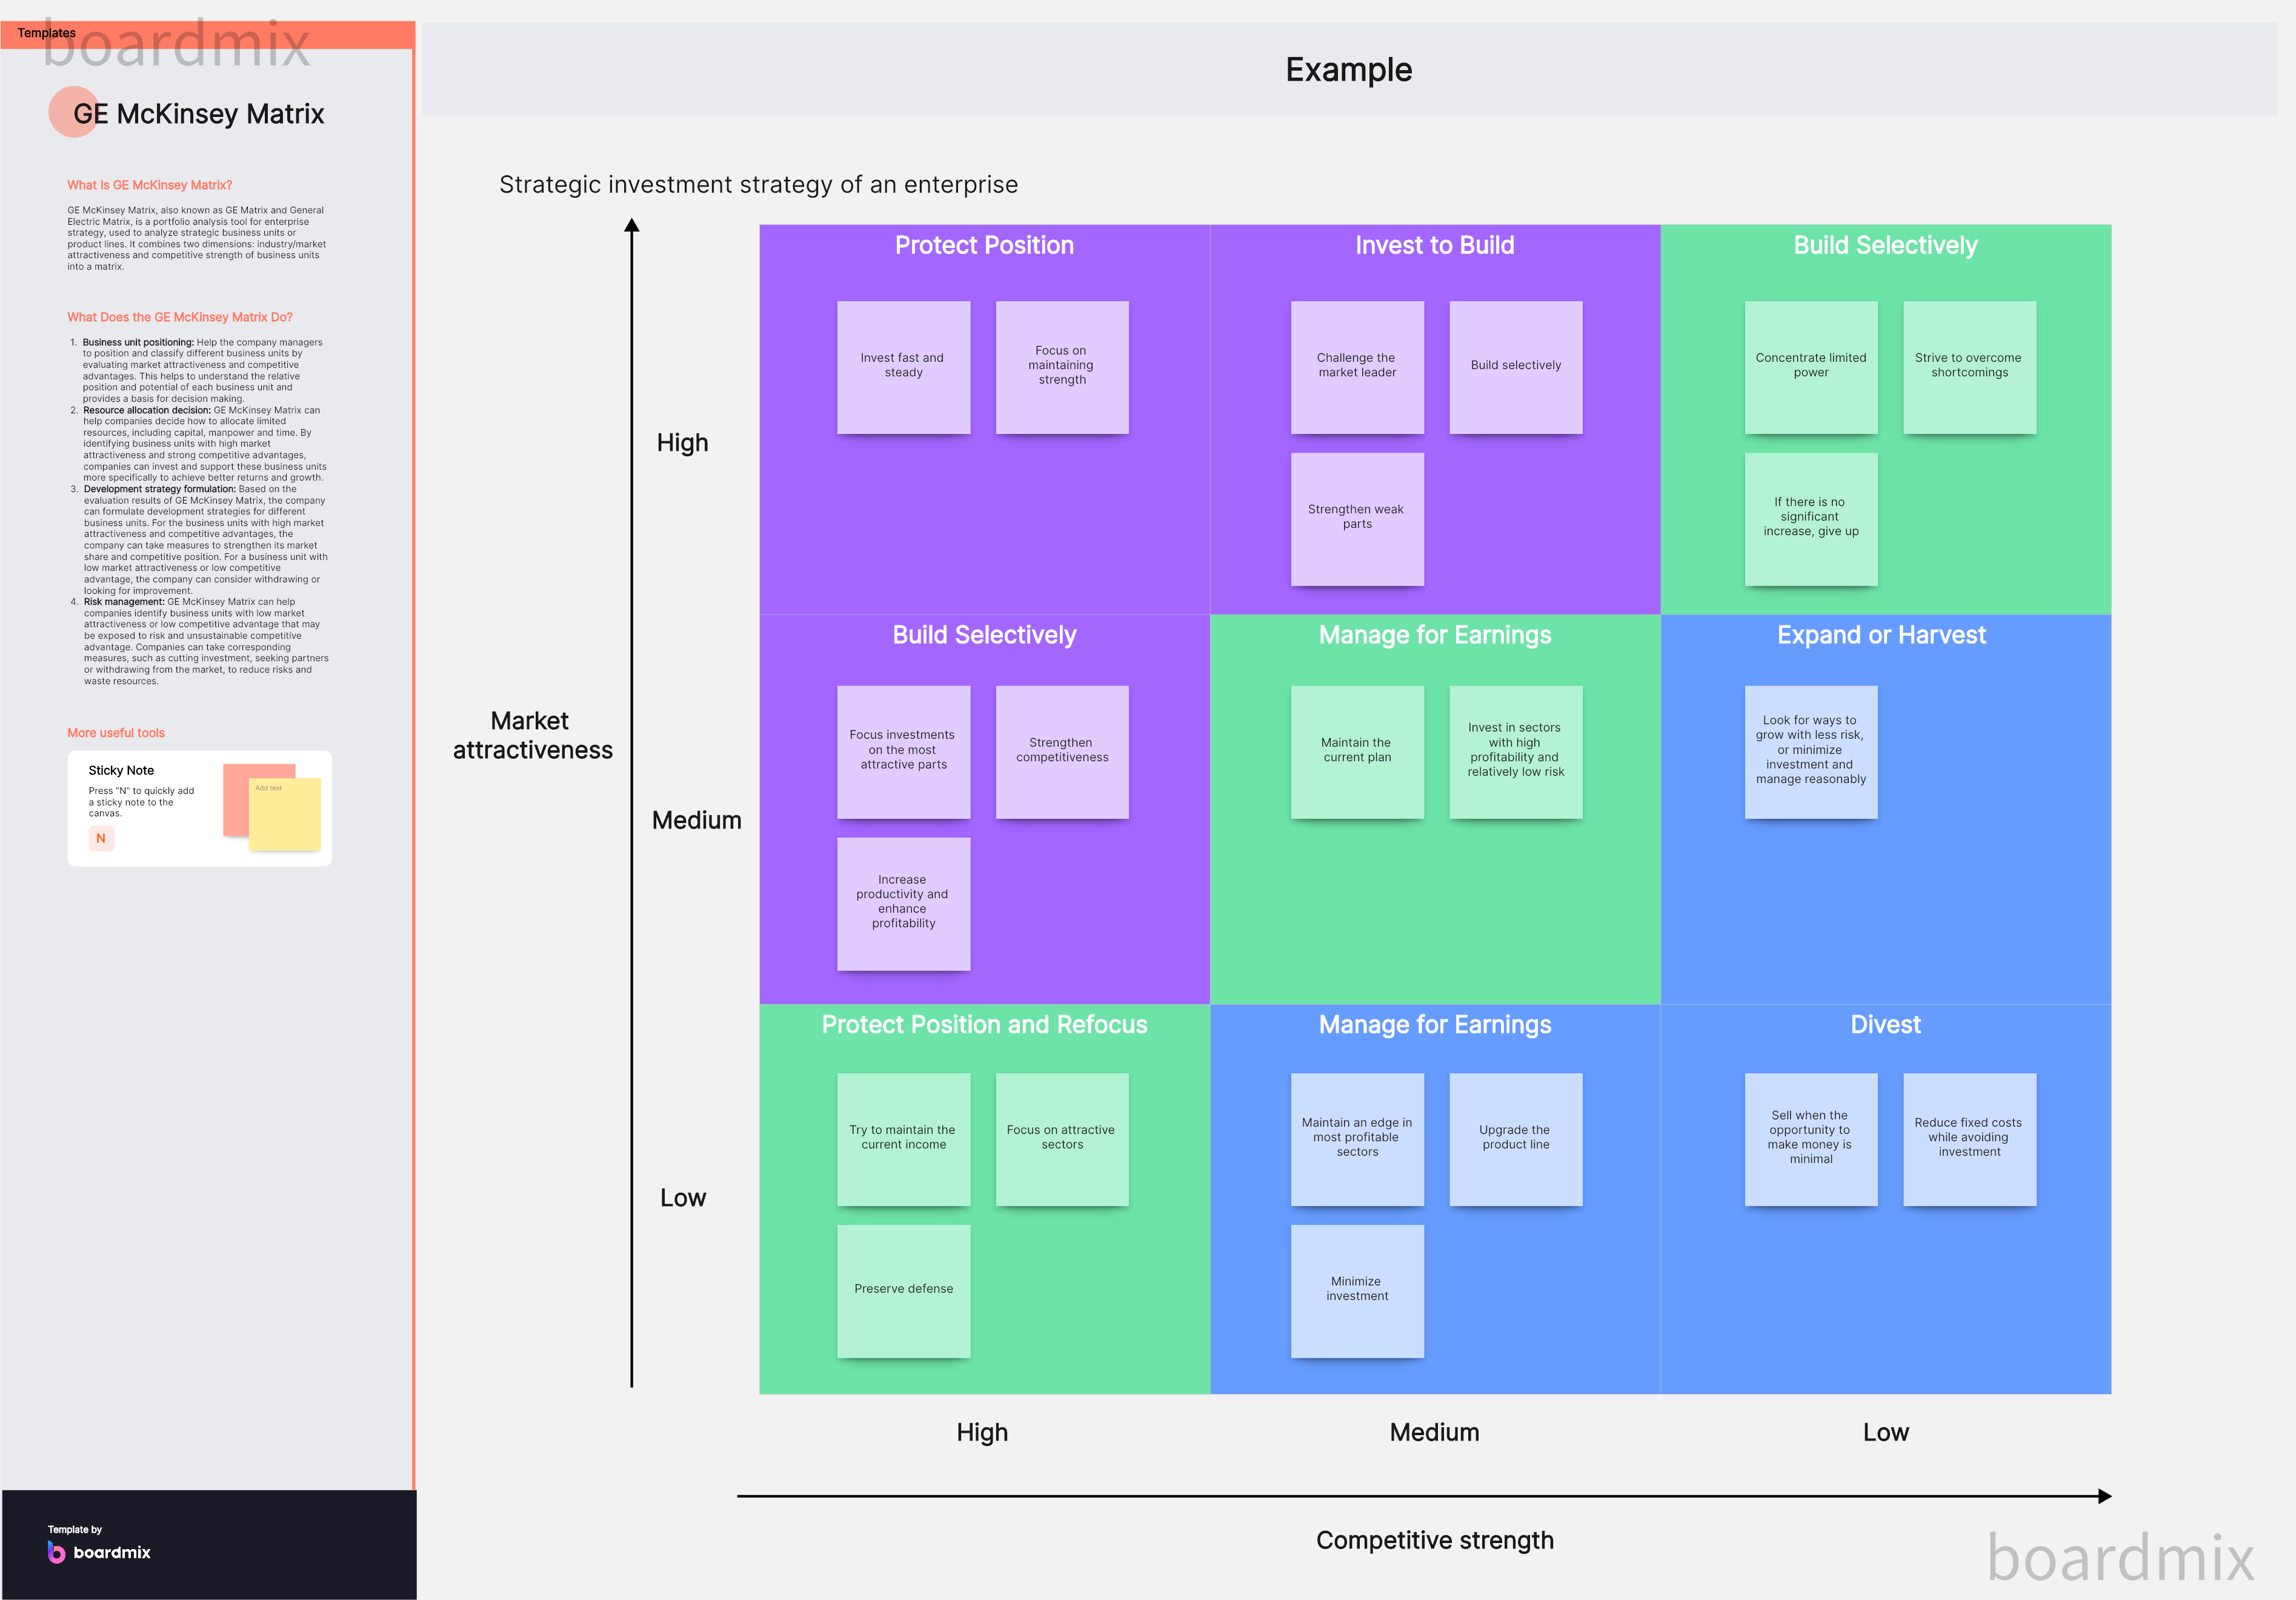
The GE-McKinsey Matrix is comprised of a 3x3 grid, with the following axes:
Vertical Axis: Industry Attractiveness
This axis gauges the desirability of an industry based on factors like market size, growth potential, competitive intensity, profitability prospects, and macro-environmental factors (political, economic, socio-cultural, technological, etc.).
Horizontal Axis: Business Strength
This axis assesses the competitive strength of the business in the industry. Factors considered include market share, brand reputation, product quality, management quality, financial performance, and technological capability.
Applications of the GE-McKinsey Matrix
Organizations use the GE-McKinsey Matrix to inform decisions about resource allocation, investments, and divestitures. By plotting their business units or product lines on the matrix, they can identify growth opportunities, areas of investment, and businesses that may need to be divested or discontinued.
5 GE-McKinsey Matrix Examples Application
The GE-McKinsey Matrix serves as a pivotal tool for multi-business organizations to analyze their product portfolio and identify areas for investment and divestiture. Let's examine its application for five well-known brands:
1. Microsoft Corporation GE-McKinsey Matrix
Microsoft's Office Suite, owing to its vast user base and constant demand, would find its place in the high industry attractiveness and high business strength quadrant. On the contrary, Bing, Microsoft's search engine, may fall into the low industry attractiveness and low business strength quadrant due to the dominance of competitors like Google.
2. Unilever GE-McKinsey Matrix
Unilever's Dove, a brand known for its skin-nourishing properties and global reach, may be placed in the high industry attractiveness and high business strength quadrant. In contrast, a brand like Rexona might fit into the medium industry attractiveness and high business strength quadrant due to its strong sales yet facing stiffer competition.
3. Nestle GE-McKinsey Matrix
Nestle's well-known brands like KitKat and Nescafe can be categorized under high industry attractiveness and high business strength quadrant due to their market penetration and consumer preference. However, newer or lesser-known brands like Nestle Health Science might fall under the medium or low industry attractiveness and strength quadrants as they still are gaining ground.
4. Adidas GE-McKinsey Matrix
Adidas' footwear division can be placed in the high industry attractiveness and high business strength quadrant due to its market reputation and innovative product line. In contrast, the golf equipment division (which was sold) would have fallen into the low attractiveness and strength quadrant due to less impressive sales figures and higher competition.
5. PepsiCo GE-McKinsey Matrix
PepsiCo's soft drinks, such as Pepsi and Mountain Dew, can fit into the high industry attractiveness and high business strength quadrant considering their consumer loyalty and global reach. But brands like Tropicana might be positioned in the medium industry attractiveness and high business strength quadrant due to the intense competition in the juice market.
In conclusion, the GE-McKinsey Matrix serves as an essential tool for these organizations to understand their portfolio better and make strategic decisions related to resource allocation, investments, and potential divestitures.
How to Use GE-McKinsey Matrix: Take Apple as an Example
While Apple Inc. does not publicly disclose its portfolio evaluation using this specific matrix, we can provide a hypothetical example to illustrate how it could be used for Apple.
In the GE-McKinsey Matrix, two key dimensions are assessed: market attractiveness and competitive strength. These dimensions can be further broken down into various sub-factors based on the industry and company-specific context.
Let's consider a simplified example for Apple Inc., where we assume three different business lines as a GE-McKinsey Matrix template.
iPhone: Apple's flagship product, which has a considerable market share, high growth potential, and strong brand recognition. It competes in a highly attractive and evolving smartphone market, driving substantial profits and customer loyalty. Therefore, it may be positioned in the top-right quadrant of the matrix, indicating high market attractiveness and competitive strength.
Mac computers: Apple's Mac line of computers holds a significant market share in the premium computer segment. While the market for computers may be less attractive in terms of growth compared to smartphones, Apple's dominance in the high-end market and customer loyalty could position it in the upper-middle section of the matrix.
Apple TV: Apple's foray into the television streaming market. This segment is highly competitive, with several well-established players. Although the market itself may be attractive due to the growing demand for streaming services, Apple's competitive strength in this area may be relatively weaker compared to its other products. Therefore, it might be positioned in the lower-middle section of the matrix.
Again, please note that this example is hypothetical, and no official GE-McKinsey Matrix for Apple Inc. has been publicly disclosed. The actual strategic planning and portfolio evaluation processes conducted by Apple Inc. may involve different factors, criteria, and analysis methodologies.
How to Create a GE-McKinsey Matrix Template on Boardmix for Your Business
The GE-McKinsey Matrix is a useful tool for evaluating your company's business portfolio and making strategic decisions. If you're planning to create this matrix using a Boardmix template, here's how you can do it.

First, Know Your Business Before Creating
1. Identify Business Units
Start by listing all the business units or product lines within your company that you want to evaluate. These will be the entities you'll plot on the matrix.
2. Define Industry Attractiveness Criteria
Define the criteria that determine the attractiveness of the industry in which each of your business units operates. These might include market growth rate, market size, competitive rivalry, profitability, technological development, and socio-political factors.
3. Define Business Strength Criteria
Similarly, define the criteria for assessing the business strength of each unit. Factors could include market share, brand equity, profitability, customer loyalty, production quality, and innovation capabilities.
4. Score Each Business Unit
Rate each business unit based on the predefined criteria for industry attractiveness and business strength. You could use a numerical scale (for example, 1-10) for this purpose.
5. Plot Each Business Unit on the Matrix
Place each business unit in the appropriate quadrant of the matrix based on its scores. The x-axis represents business strength while the y-axis represents industry attractiveness.
6. Review and Analyze
Analyze the positioning of your business units on the matrix. Those in the high industry attractiveness/high business strength quadrant are your stars and should be prioritized for investment. Units in the low attractiveness/low strength quadrant might be candidates for divestment or restructuring.
7. Make Strategic Decisions
Use the insights from the matrix to make strategic decisions about resource allocation, investments, and potential divestitures.
Now, Edit on the GE-McKinsey Matrix Template in Boardmix
1. Log in and get Template: Access Boardmix and search GE-McKinsey Matrix template on Boardmix.

2. Input Data: Enter your data into the template, following the process outlined above.
3. Automatic Plotting: The template will automatically plot your business units on the matrix based on the scores you've inputted.
4. Analysis and Decision-making: Use the visually represented data to guide your strategic decision-making process.
Remember, the GE-McKinsey Matrix is a strategic tool, and its effectiveness depends on the accuracy of your assessment of industry attractiveness and business strength. Be objective and realistic in this process to ensure reliable outcomes.


