Bubble maps are an excellent way to visually organize and understand complex ideas. These graphic organizers are used in various contexts, from brainstorming sessions to project planning. They allow you to visually connect key concepts and see how everything fits together.
If you’re looking for an efficient way to organize your ideas, explore the many types of bubble maps and how they can help you clearly express complex thoughts.
Let’s dive into how you can use these bubble maps to improve your planning, productivity, and overall understanding of any topic.
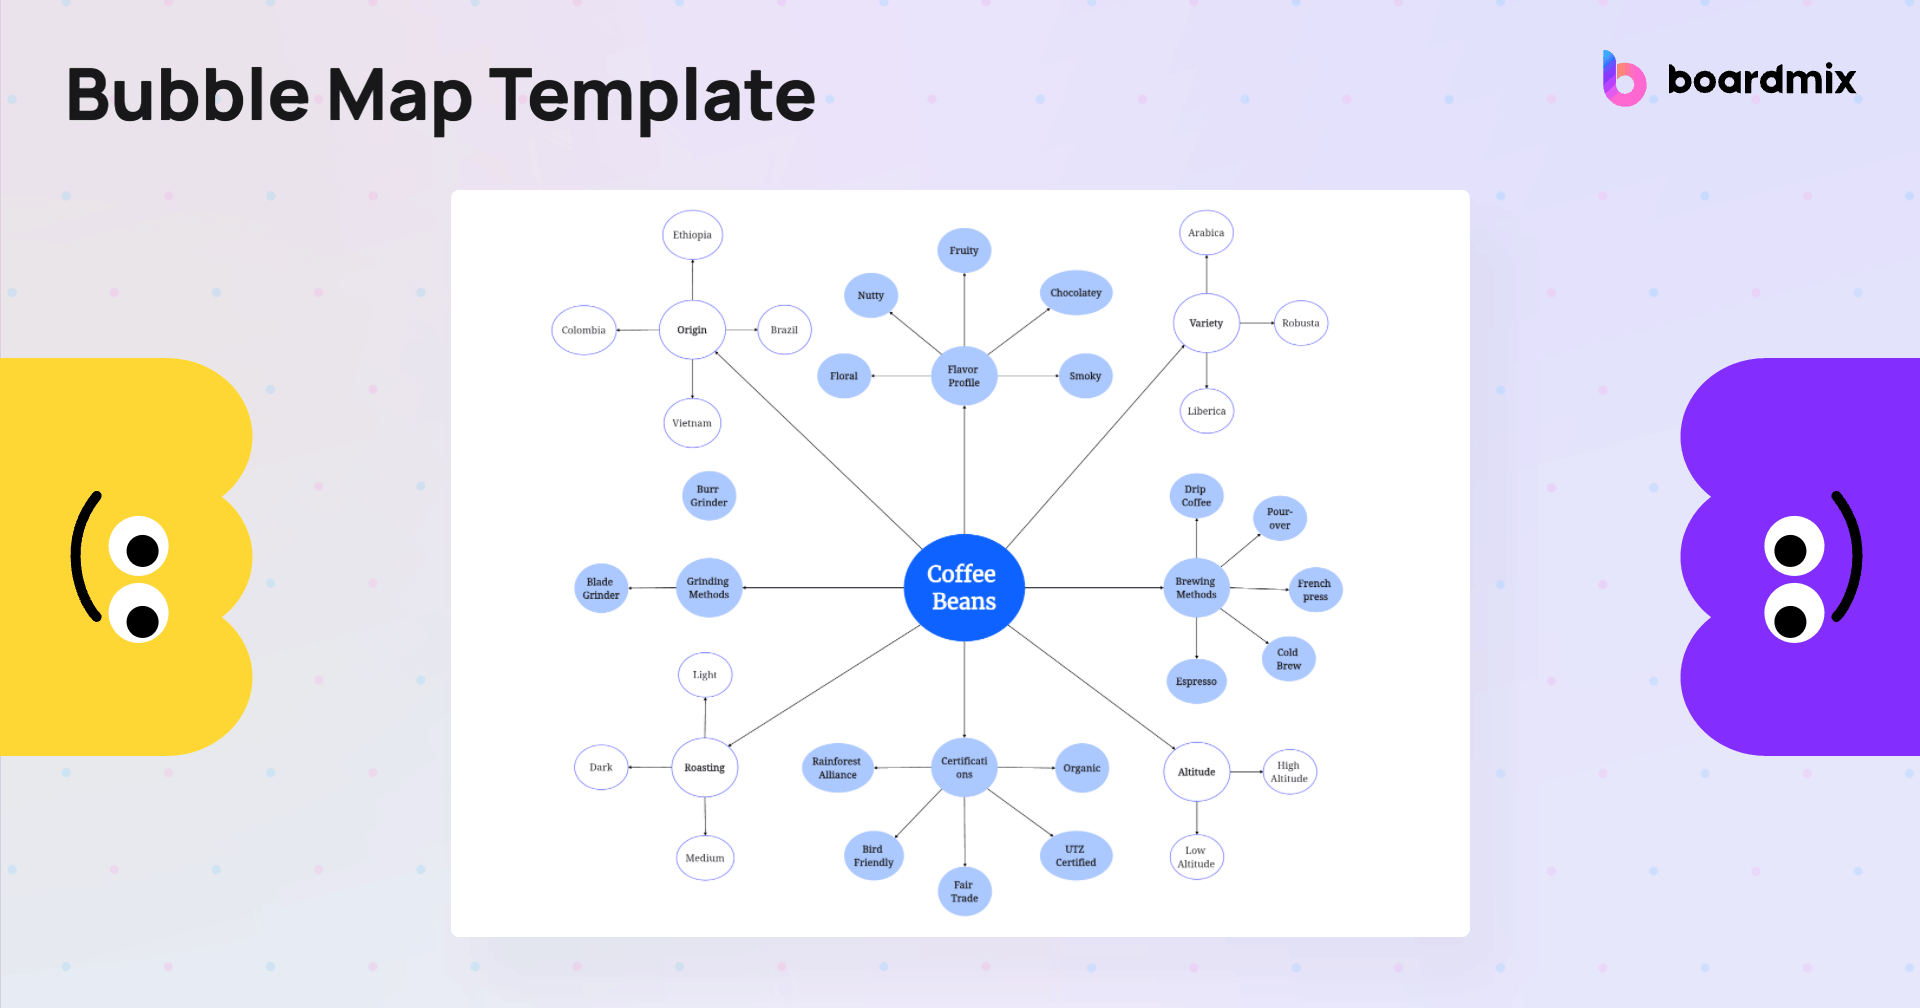
What Is a Bubble Map Graphic Organizer?
A Bubble Map graphic organizer is a visual tool designed to explore and illustrate the characteristics, connections, or relationships surrounding a central theme. With its clear, bubble-like structure, it’s perfect for breaking down complex topics into digestible chunks. Educators, project planners, and creative professionals often rely on Bubble Maps to enhance clarity and encourage critical thinking.
In classrooms, students can describe historical events or analyze literary characters using Bubble Maps. At work, teams might organize ideas for a new project or outline key attributes of a product. Its versatility and ease of use make Bubble Maps a favorite in various fields, from education to business strategy.
Why Are Bubble Maps Effective?
Bubble Maps are more than just visually appealing—they’re practical tools that simplify how we process and present information. But what makes them so effective?
- Visualizing Information Clearly
Bubble Maps help transform dense ideas into easily digestible visuals. By mapping out concepts around a central theme, users can quickly identify patterns and relationships.
- Supporting Flexibility
From brainstorming sessions to detailed research analysis, Bubble Maps adapt to a wide range of purposes. Whether you’re outlining a book chapter or strategizing a marketing campaign, this tool fits the bill.
- Highlighting Key Points
The design of a Bubble Map naturally emphasizes core ideas, helping users stay focused on what matters most. This approach ensures clarity, whether you’re presenting to a team or organizing your own thoughts.
Explore Online Bubble Map Graphic Organizers Templates
Bubble Maps come in various types, each tailored to different needs. Let’s explore the most popular ones.
Basic Bubble Map Template
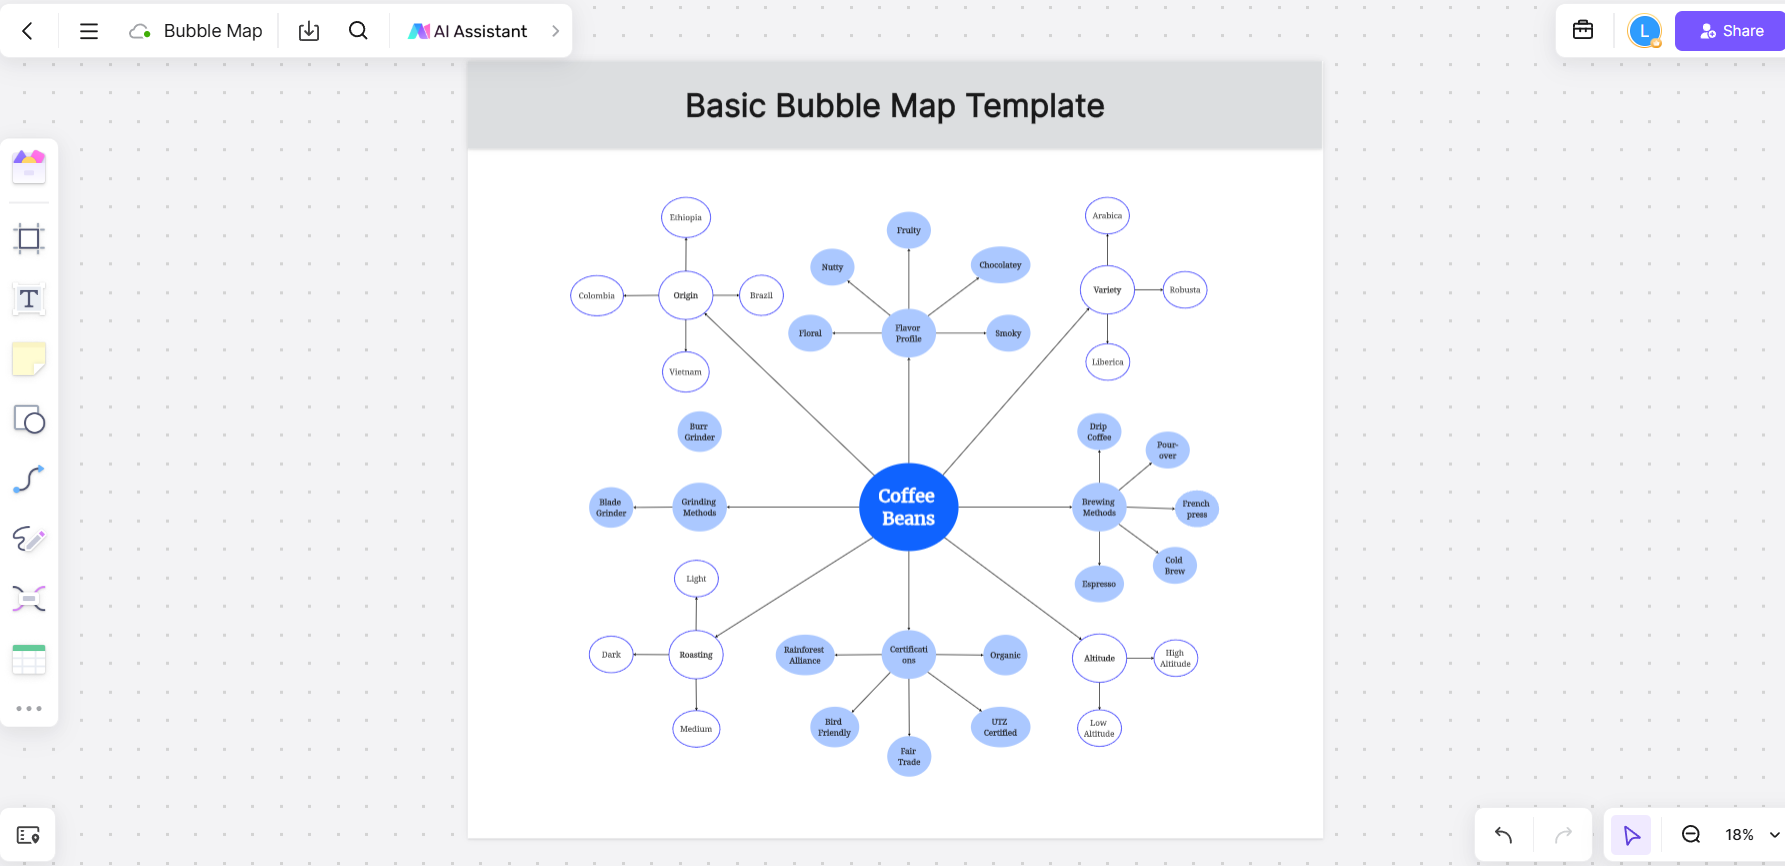
This is the simplest form, connecting a central theme to its primary characteristics or traits.
- Example: Describing a Historical Figure Bubble Map
- Central Theme: Abraham Lincoln
- Bubbles: Honest, Leader, Emancipator, Visionary, Orator
- Scenario: A student uses a Basic Bubble Map in a history project to outline Lincoln's qualities, supporting each trait with examples from his life.
Double Bubble Map Template
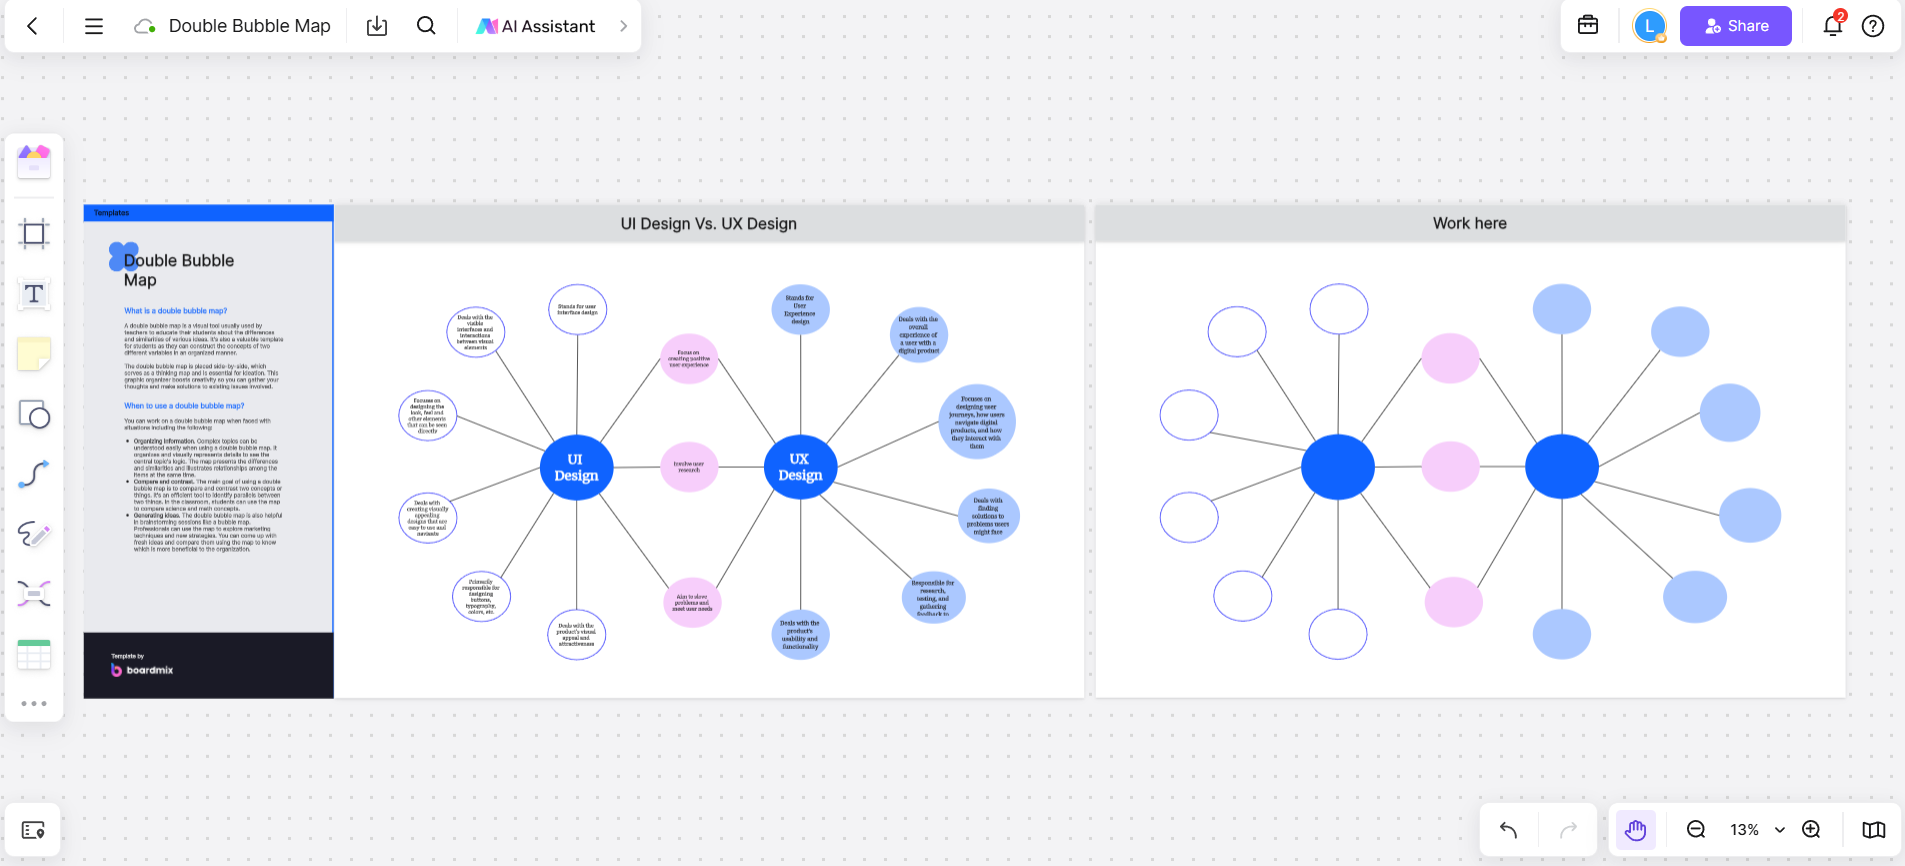
Ideal for comparing and contrasting two themes.
- Example: Renewable vs. Non-Renewable Energy
- Shared Traits: Provide energy, Essential for daily life
- Renewable: Solar, Wind, Infinite supply
- Non-Renewable: Oil, Coal, Finite resources
- Scenario: A teacher uses this map to help students understand the differences and similarities between energy sources.
Cluster Bubble Map Template
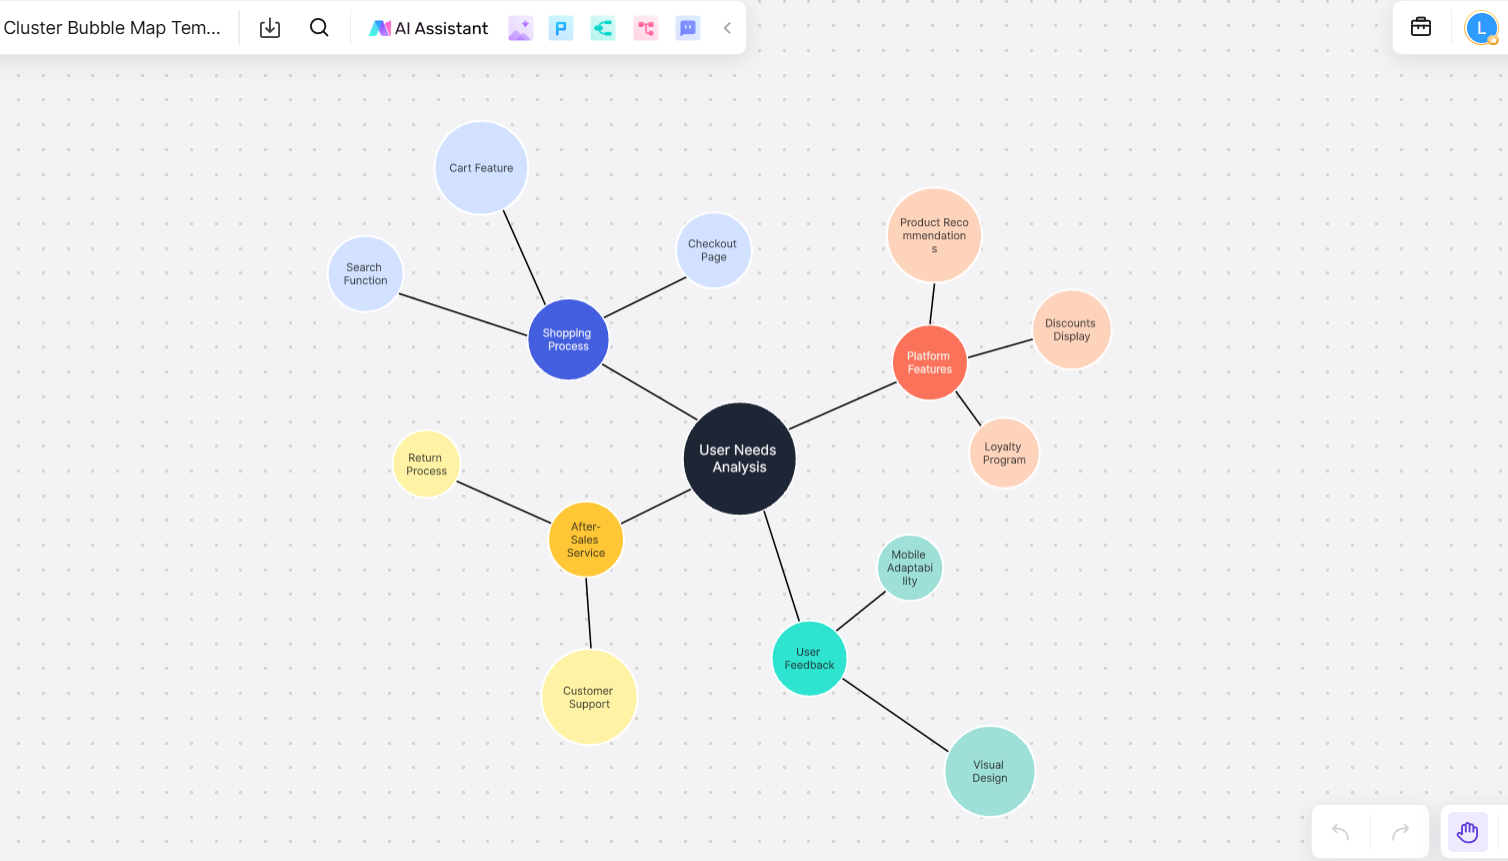
Groups related ideas together, revealing classifications or relationships.
- Example: Marketing Campaign Components
- Central Theme: Marketing Campaign
- Clusters: Digital (SEO, Social Media), Traditional (TV Ads, Billboards), Events (Conferences, Trade Shows)
- Scenario: A marketing team brainstorms strategies for an upcoming product launch.
Tree Bubble Map Template

Mimics a hierarchical structure, perfect for analyzing layered topics.
- Example: Organizational Structure
- Root: Company
- Branches: CEO → Departments → Teams → Employees
- Scenario: A manager outlines the reporting structure in an onboarding session.
Web Bubble Map Template
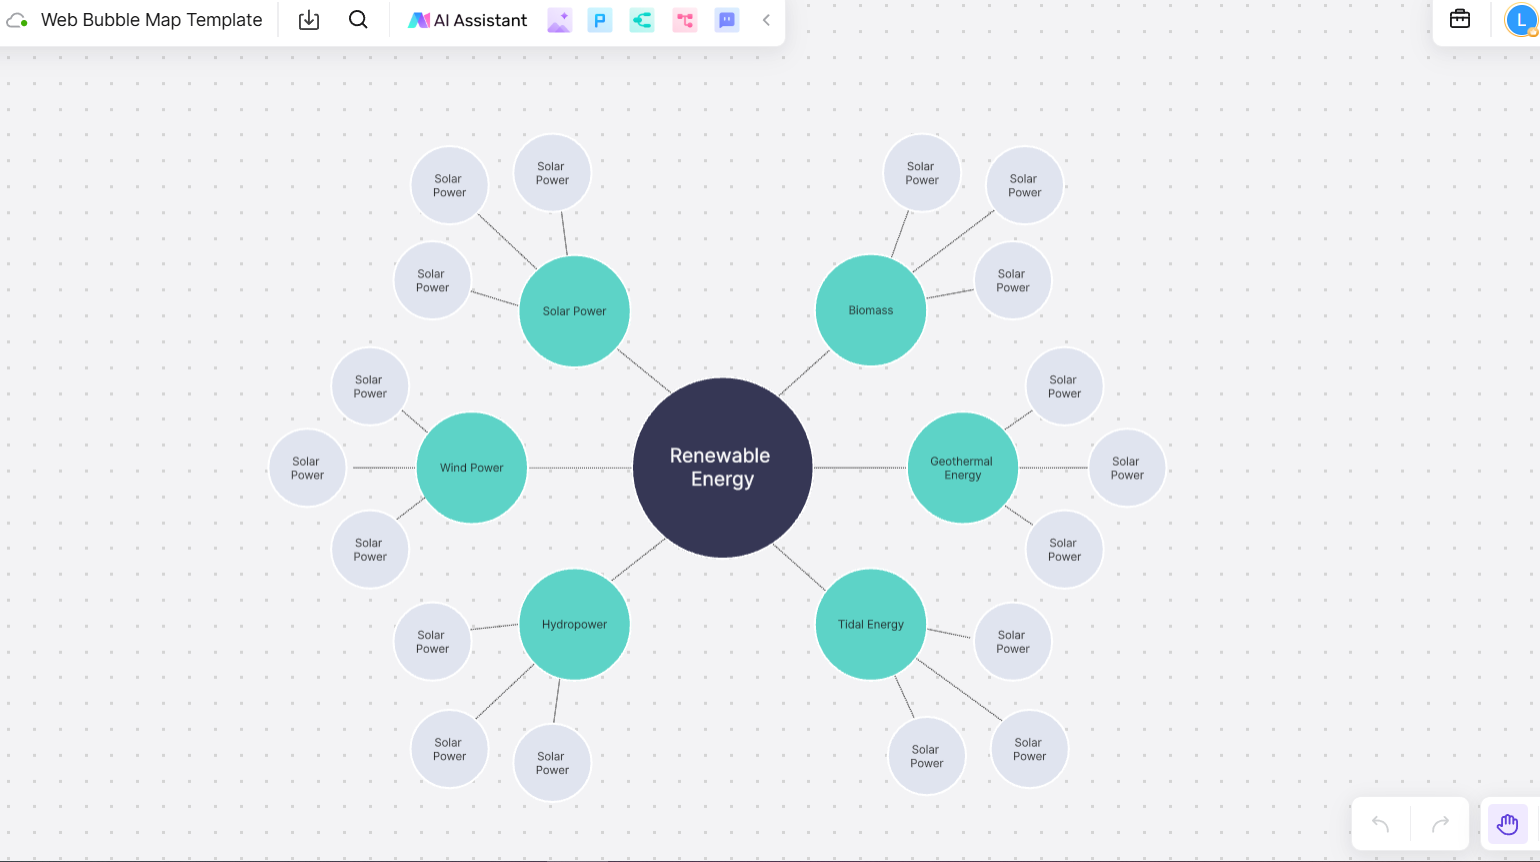
This map emphasizes the complexity of relationships among multiple subtopics.
- Example: Ecosystem Relationships
- Central Theme: Forest Ecosystem
- Subtopics: Trees → Provide oxygen, Shelter animals → Food for herbivores
- Scenario: Students visualize how different components of an ecosystem are interlinked.
Cause and Effect Bubble Map Template
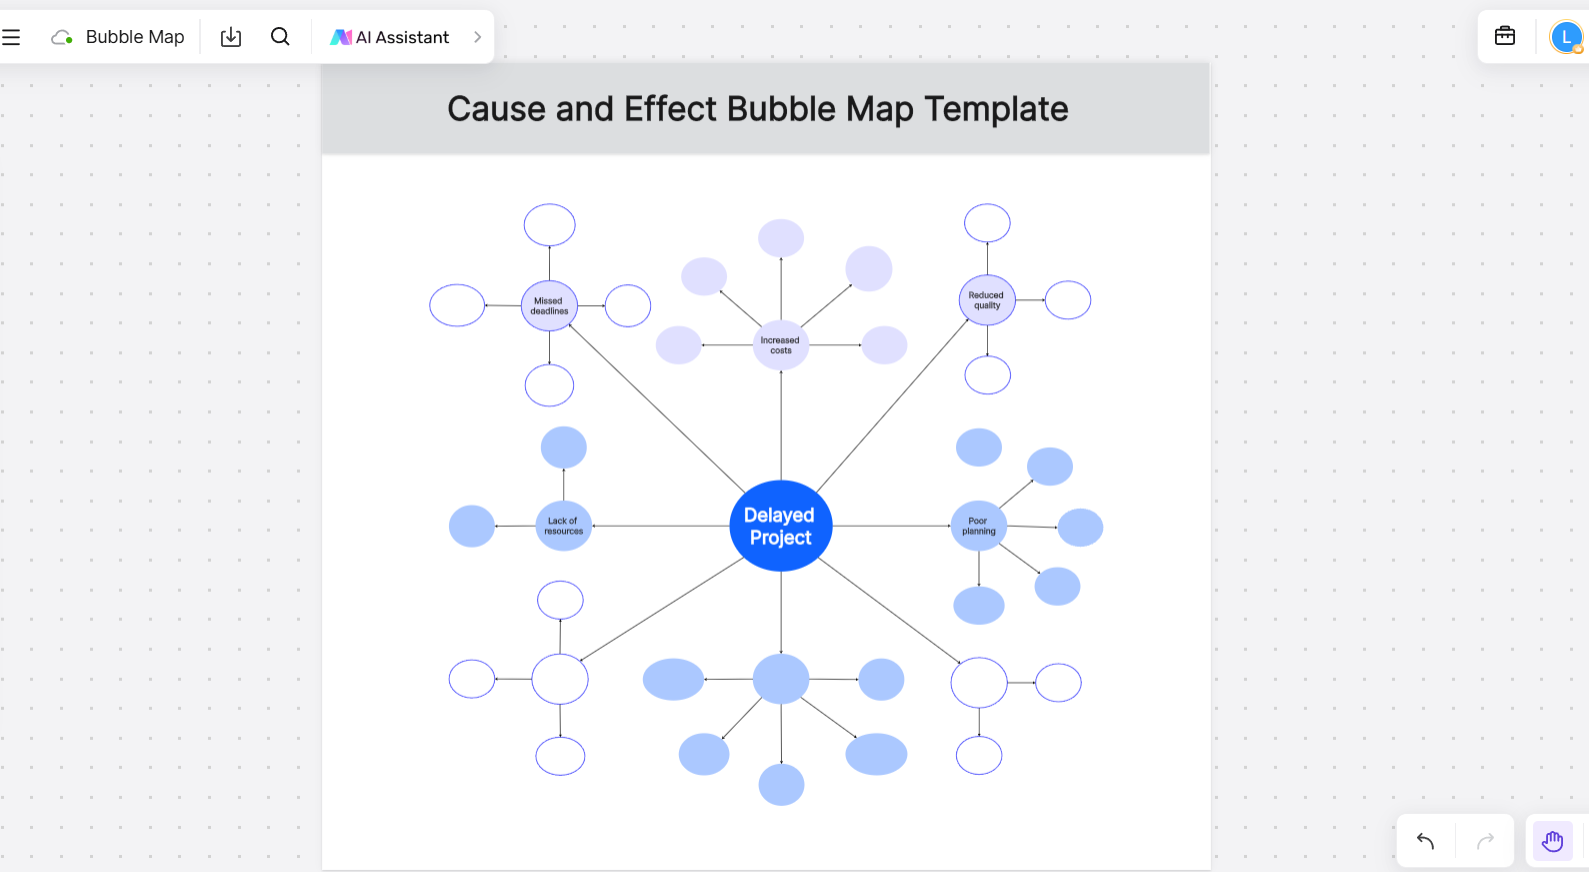
Maps out causes and their outcomes, making it ideal for problem-solving.
- Example: Delayed Project
- Causes: Poor planning, Lack of resources
- Effects: Missed deadlines, Increased costs, Reduced quality
- Scenario: A business team analyzes the root causes of a delayed project to avoid similar issues in the future.
Creative Brainstorm Bubble Map Template
Captures inspiration and fosters creative thinking.
- Example: New Product Ideas
- Central Theme: Kitchen Gadgets
- Ideas: Self-cleaning blender, Smart cutting board, Automatic spice dispenser
- Scenario: A product design team generates ideas for a new product line.
Venn Bubble Map Template
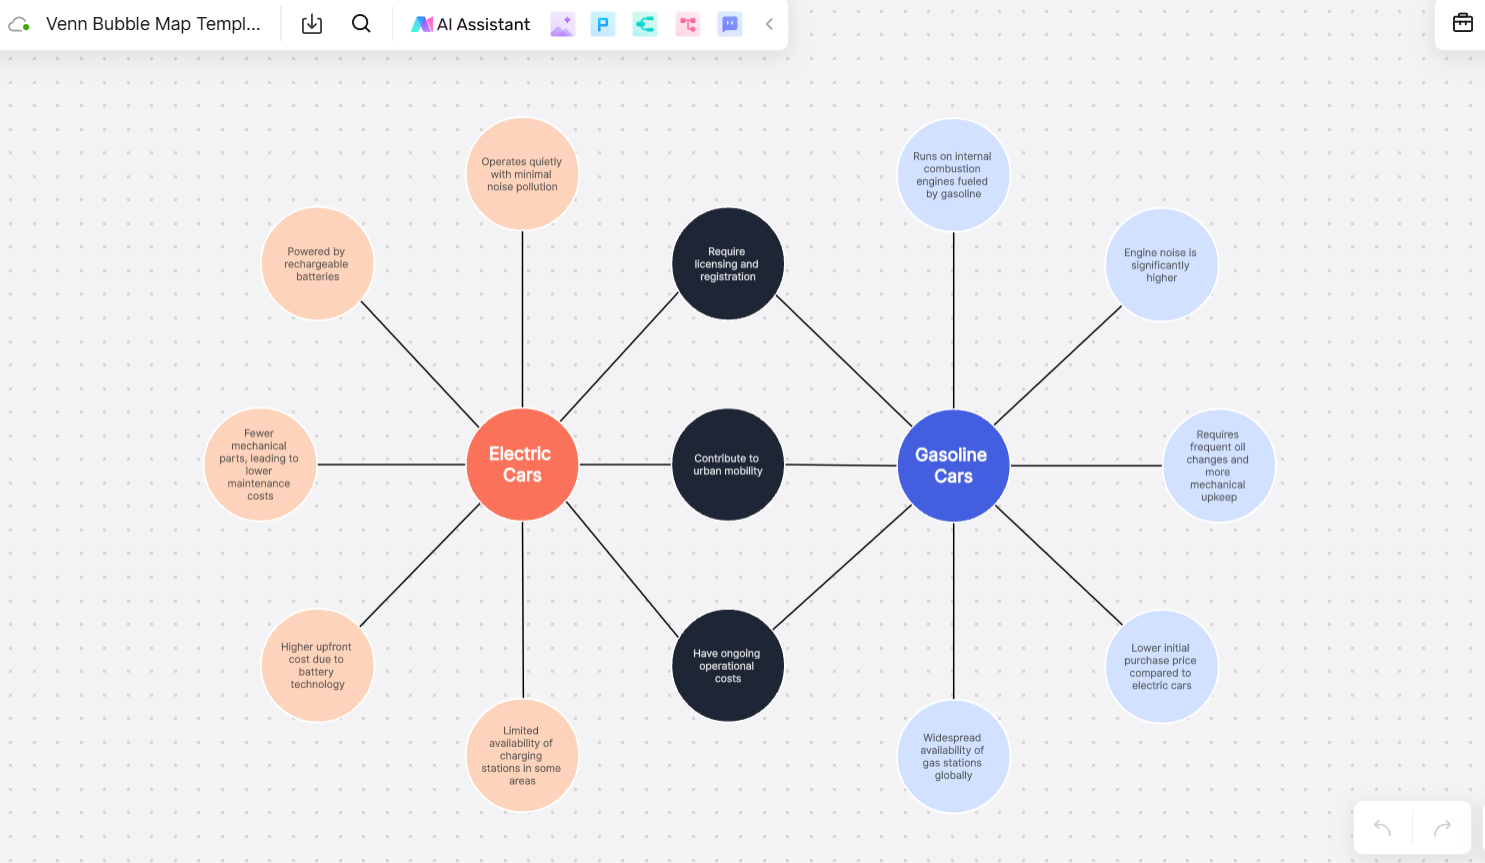
Combines the strengths of Bubble Maps and Venn diagrams, showcasing shared and unique attributes.
- Example: City Comparison
- Shared Traits: Cultural diversity, Tourism hotspots
- City A: Historical landmarks, Subways
- City B: Modern skyscrapers, Cycling culture
- Scenario: A travel blog compares two popular cities to guide visitors.
Online Bubble Maps Graphic Organizer: Boardmix
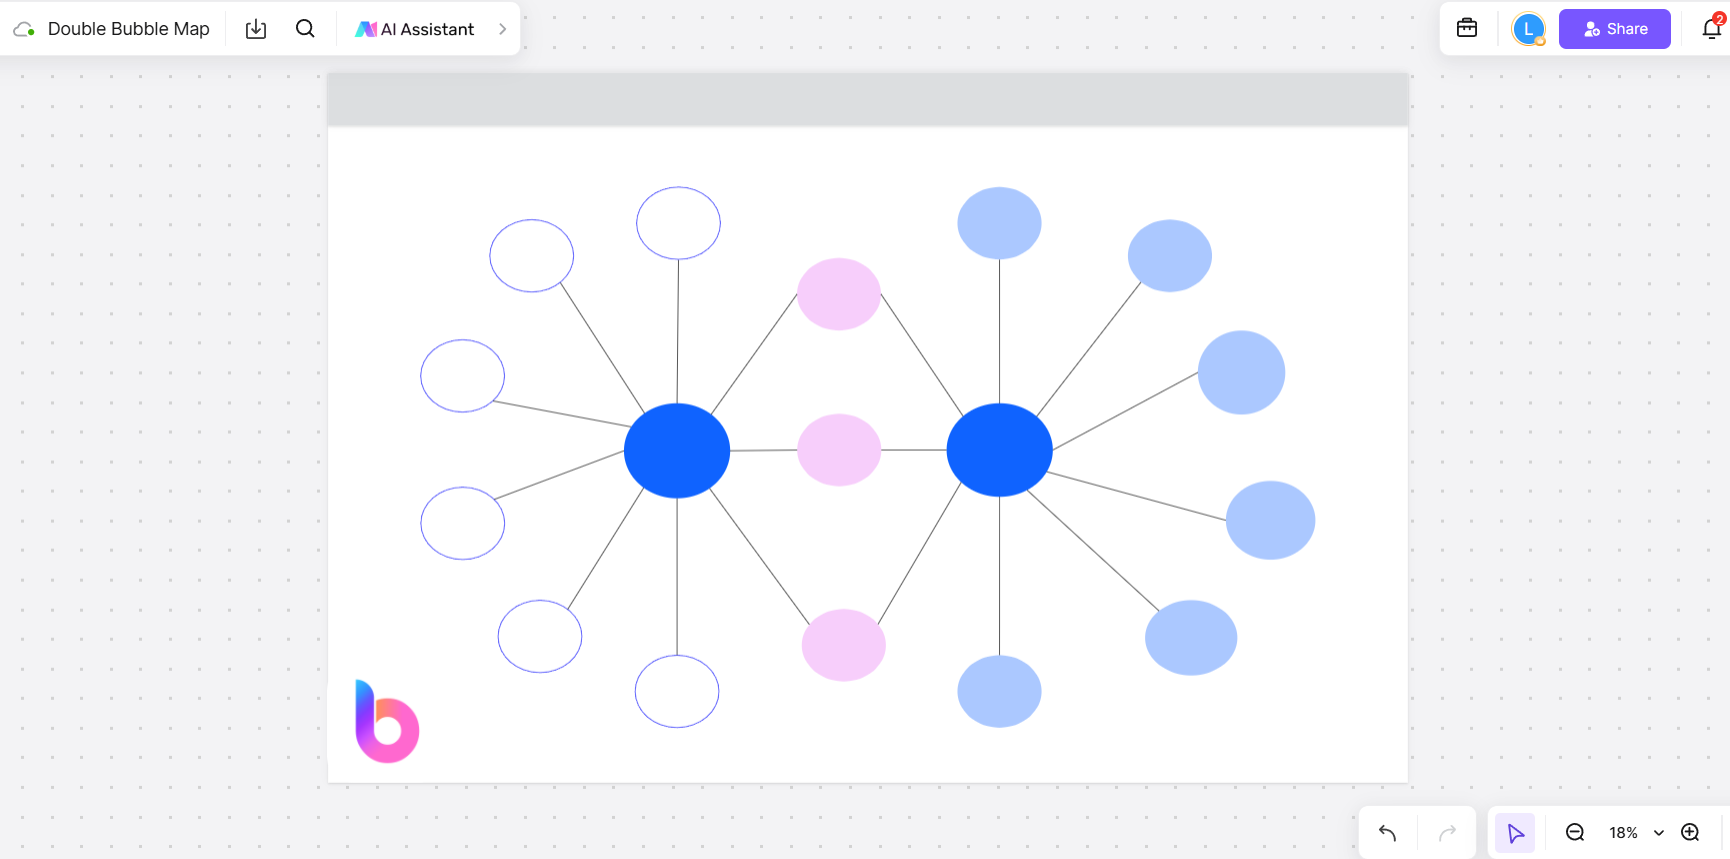
Creating bubble maps is simple with Boardmix, an online whiteboard that offers an intuitive interface and robust features.
Here’s how to create a bubble map with Boardmix:
- Start with Pre-designed Templates
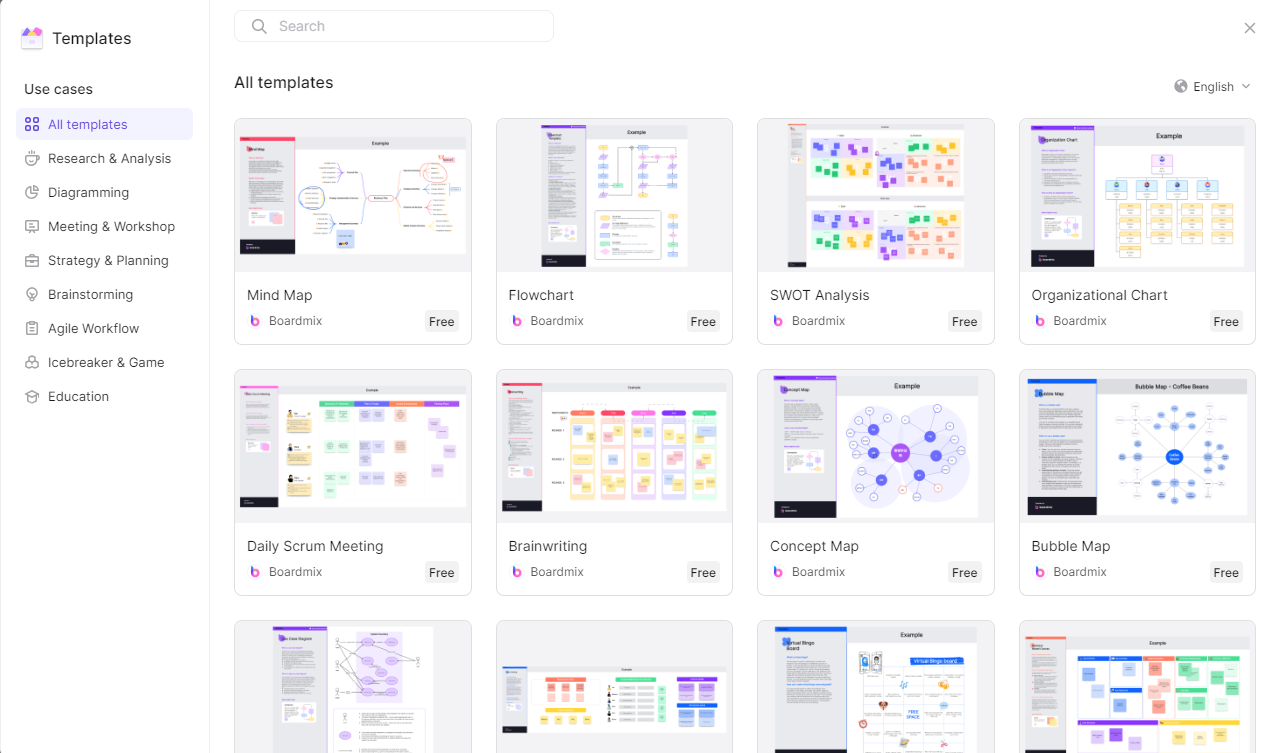
Choose from a range of professionally crafted Bubble Map templates. These templates save time and provide structure for a wide variety of tasks.
- Customize Your Map
Add colors, icons, or images to make your Bubble Map visually engaging.
Use labels and annotations to enhance understanding of key points.
Adjust layouts to align with the purpose of your map.
- Collaborate in Real-Time

Invite team members to join the design process. They can edit, comment, or expand the map simultaneously, ensuring everyone is aligned.
- Download and Share Bubble Maps
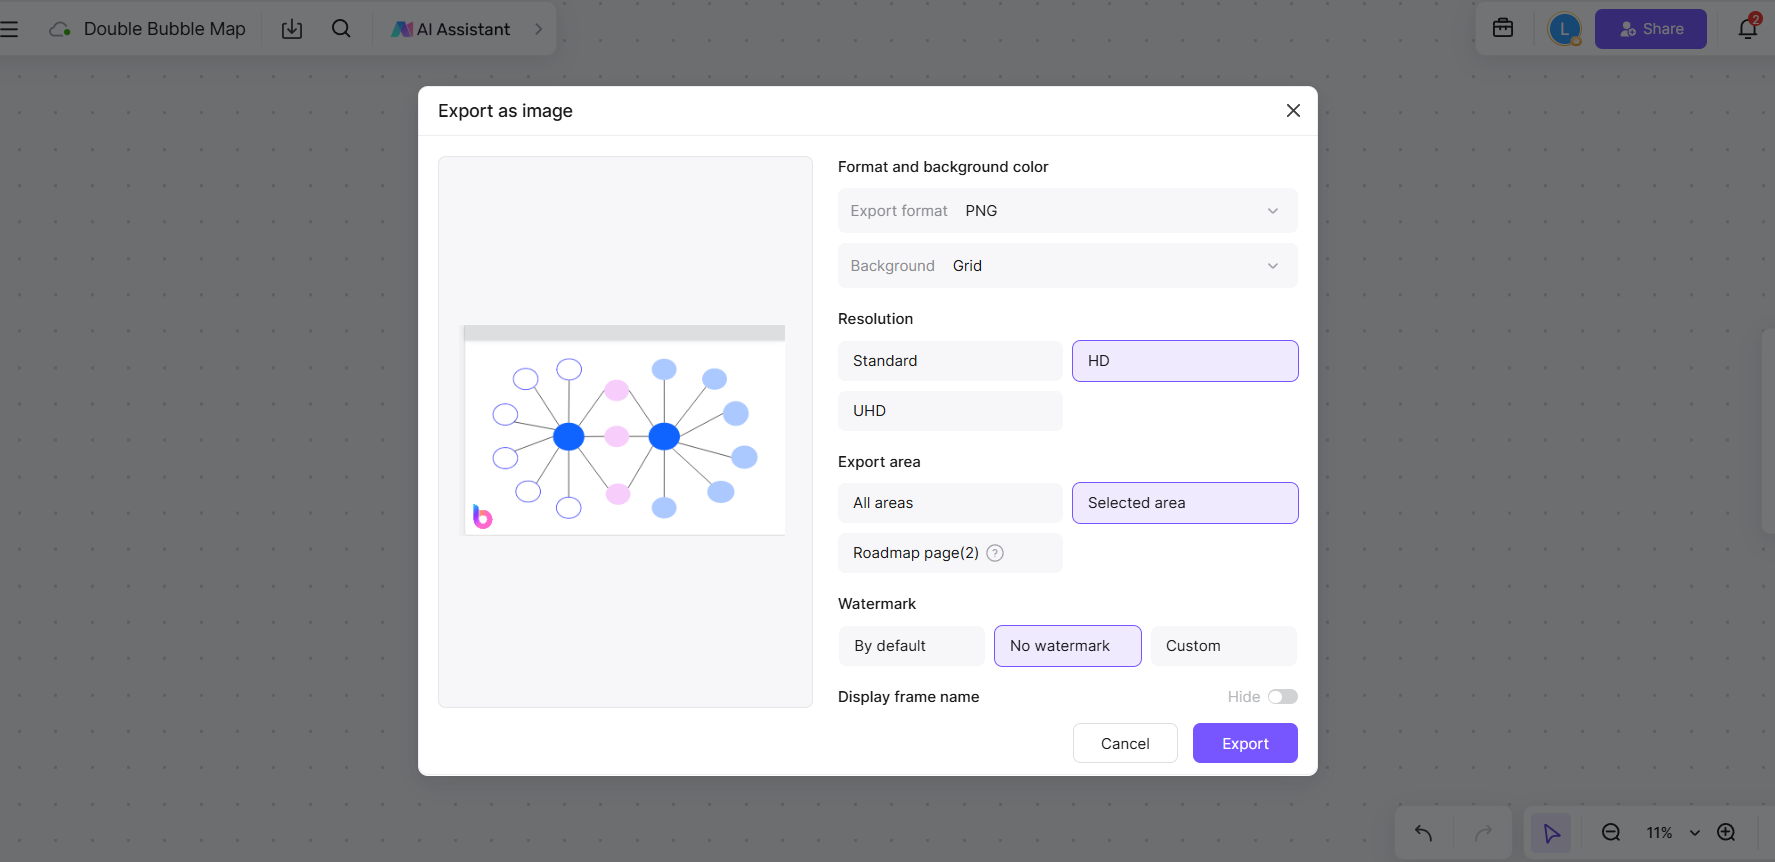
Boardmix makes sharing and saving your Bubble Maps simple:
- Export Options: Download your Bubble Map as a PDF, PNG, or other formats. These formats are perfect for presentations or reports.
- Printable Versions: Create hard copies for classroom or office use.
- Cloud Storage: Save your maps online, ensuring they’re accessible for future edits or collaborations.
- *Pro Tip: Before exporting, check the alignment and resolution for a polished, professional look.
Bubble Maps are a powerful way to break down information, making them indispensable for anyone looking to simplify complexity and communicate ideas effectively.
Conclusion
Bubble map graphic organizer is an incredibly versatile tool that can simplify complex ideas and enhance understanding in any setting.
With platforms like Boardmix, you can create, customize, and collaborate on bubble maps seamlessly, ensuring that you have an efficient and easy-to-use tool for organizing your thoughts and projects. So why not start using bubble maps today to improve your brainstorming sessions and planning processes?


