Dashboards are essential tools for professionals across industries, enabling them to visualize key data, track progress, and make data-driven decisions. With the advancement of technology, dashboard design has become a critical component for increasing productivity, ensuring clear communication, and achieving organizational goals. Let’s dive into the best dashboard design ideas for professionals and discover Boardmix, a powerful tool for creating professional dashboards with free templates that simplify and enhance your design process.
Why Dashboard is Important in Professional Settings
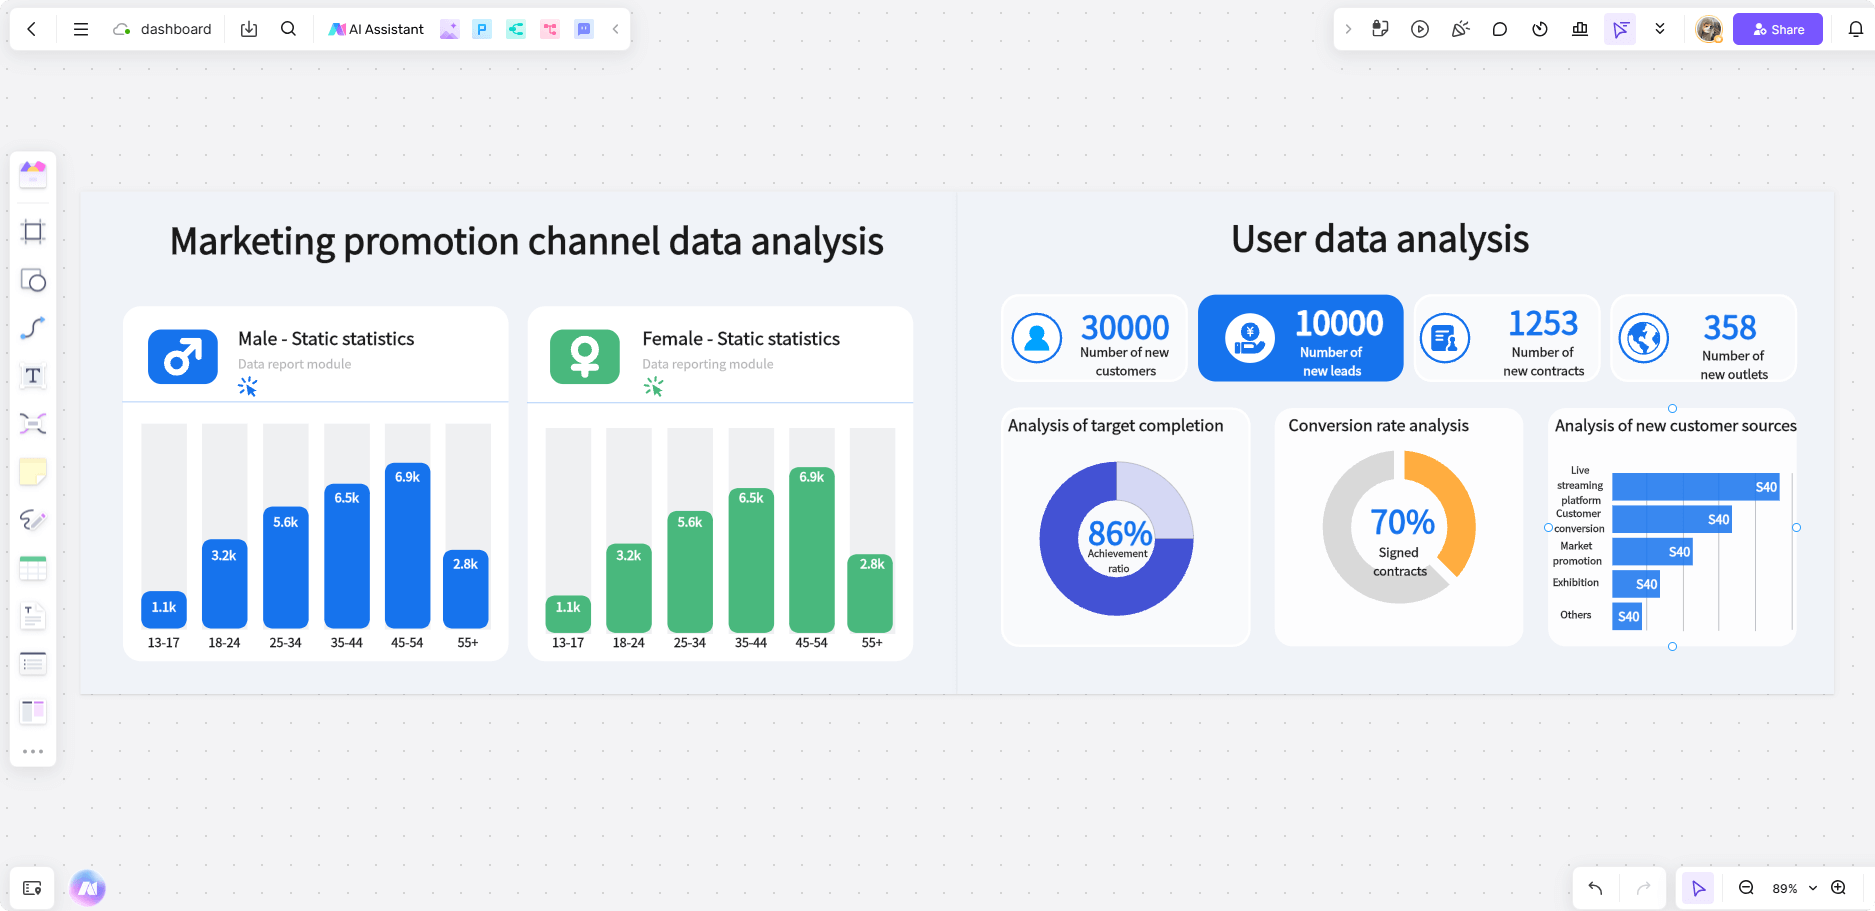
Dashboards are essential tools in professional environments, offering clear and actionable insights. They simplify data, improve decision-making, and help track progress. Here's why dashboards are vital for professionals.
- Simplify Complex Data: Dashboards turn complex data into easily understandable visuals like charts and graphs, enabling users to quickly interpret key trends, making large datasets manageable and actionable.
- Improve Decision-Making: Dashboards provide real-time data and insights, enabling professionals to make quick, informed decisions. Access to visualized data supports faster analysis, leading to timely, effective actions.
- Highlight Key Metrics: Dashboards prioritize vital metrics, ensuring focus on important areas like sales or performance. They streamline data, helping professionals concentrate efforts on high-impact factors critical for success.
- Monitor Progress: Dashboards track KPIs and goals in real-time, offering instant updates. This helps ensure alignment with objectives, facilitates progress tracking, and highlights areas for improvement or intervention.
Key Elements of Effective Dashboard Design
Creating a functional and impactful dashboard requires more than just collecting data. The design must be clear, interactive, and adaptable. Let’s explore the key elements that contribute to an effective dashboard design.
- Clarity
An effective dashboard focuses on the most critical data, avoiding the clutter of unnecessary metrics. When designing a dashboard, it’s essential to maintain clarity by only presenting the most important information. This allows the user to quickly interpret and respond to the data. Clarity in dashboard design ensures that the user can absorb the information at a glance without feeling overwhelmed.
For instance, in a sales dashboard, presenting total revenue, conversion rates, and sales growth over time can be more valuable than adding too many metrics like individual product sales or customer acquisition costs. Simplicity is key to enabling fast decision-making.
- Interactivity
A good dashboard is not static. It should be interactive, allowing users to drill down into the data for a more detailed view. Interactive dashboards provide filters that enable users to customize the displayed data based on their specific needs. For example, a project management dashboard can allow users to select timeframes or project categories to refine the information.
Interactivity empowers users to explore the data further, making it an essential feature for dashboards that cater to diverse professional requirements. This enables professionals to gain insights from different angles, giving them greater control over the information they need to make informed decisions.
- Responsiveness
A responsive dashboard adapts seamlessly across various devices and screen sizes. No matter if accessed on a desktop, tablet, or mobile device, the dashboard should adjust its layout and content to ensure a user-friendly experience. As businesses increasingly rely on remote work and mobile tools, responsive design has become indispensable for professionals who need to monitor their data on the go.
A responsive dashboard ensures that users have access to key metrics, no matter where they are or what device they use, thereby increasing accessibility and convenience.
Dashboard Design Ideas for Various Professional Use Cases
Dashboards can be tailored to serve different professional purposes. From marketing and sales to HR and project management, there are specific dashboard design ideas to fit your needs. Let’s dive into some of the most popular use cases for dashboards.
Marketing: Campaign Performance and ROI Dashboards
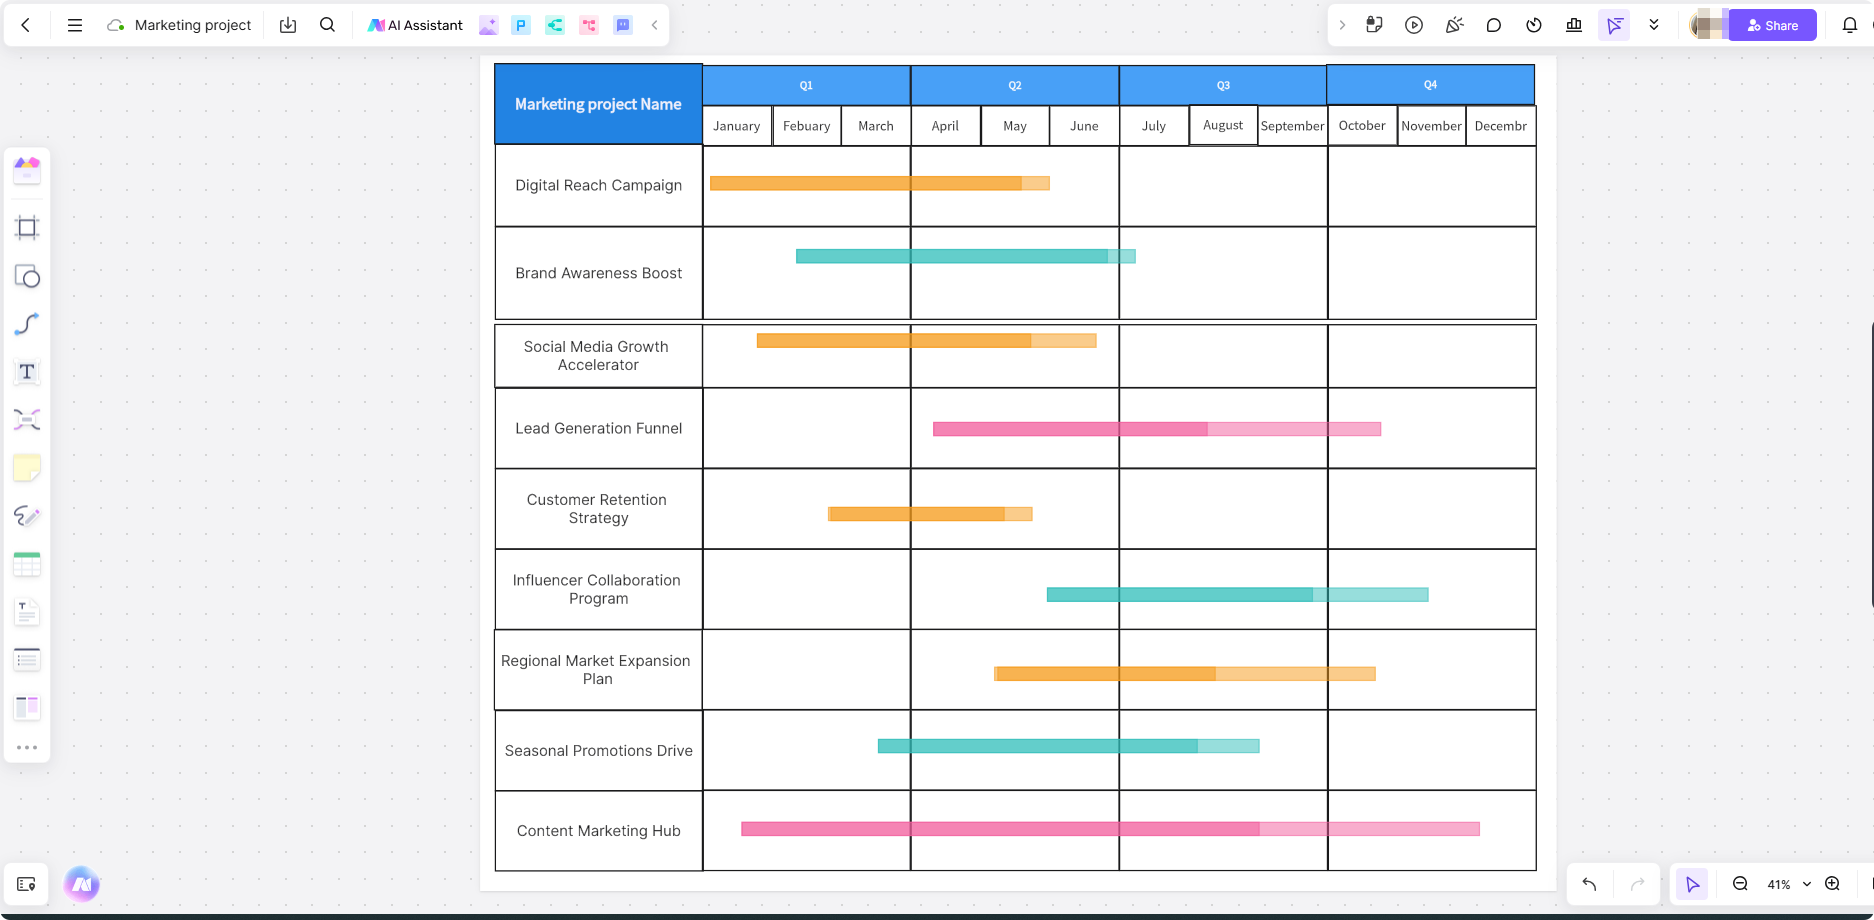
In marketing, dashboards help professionals track the effectiveness of their campaigns, providing insights into metrics such as click-through rates, conversion rates, customer engagement, and return on investment (ROI). A well-designed marketing dashboard consolidates these metrics into one visual representation, allowing marketers to make data-driven decisions about future campaigns.
For example, a marketing dashboard can display the success of various advertising channels, enabling teams to quickly evaluate which channels are performing best. A strong marketing dashboard will also highlight trends, showing if flowchart is gaining or losing traction.
Sales: Funnel and Revenue Tracking
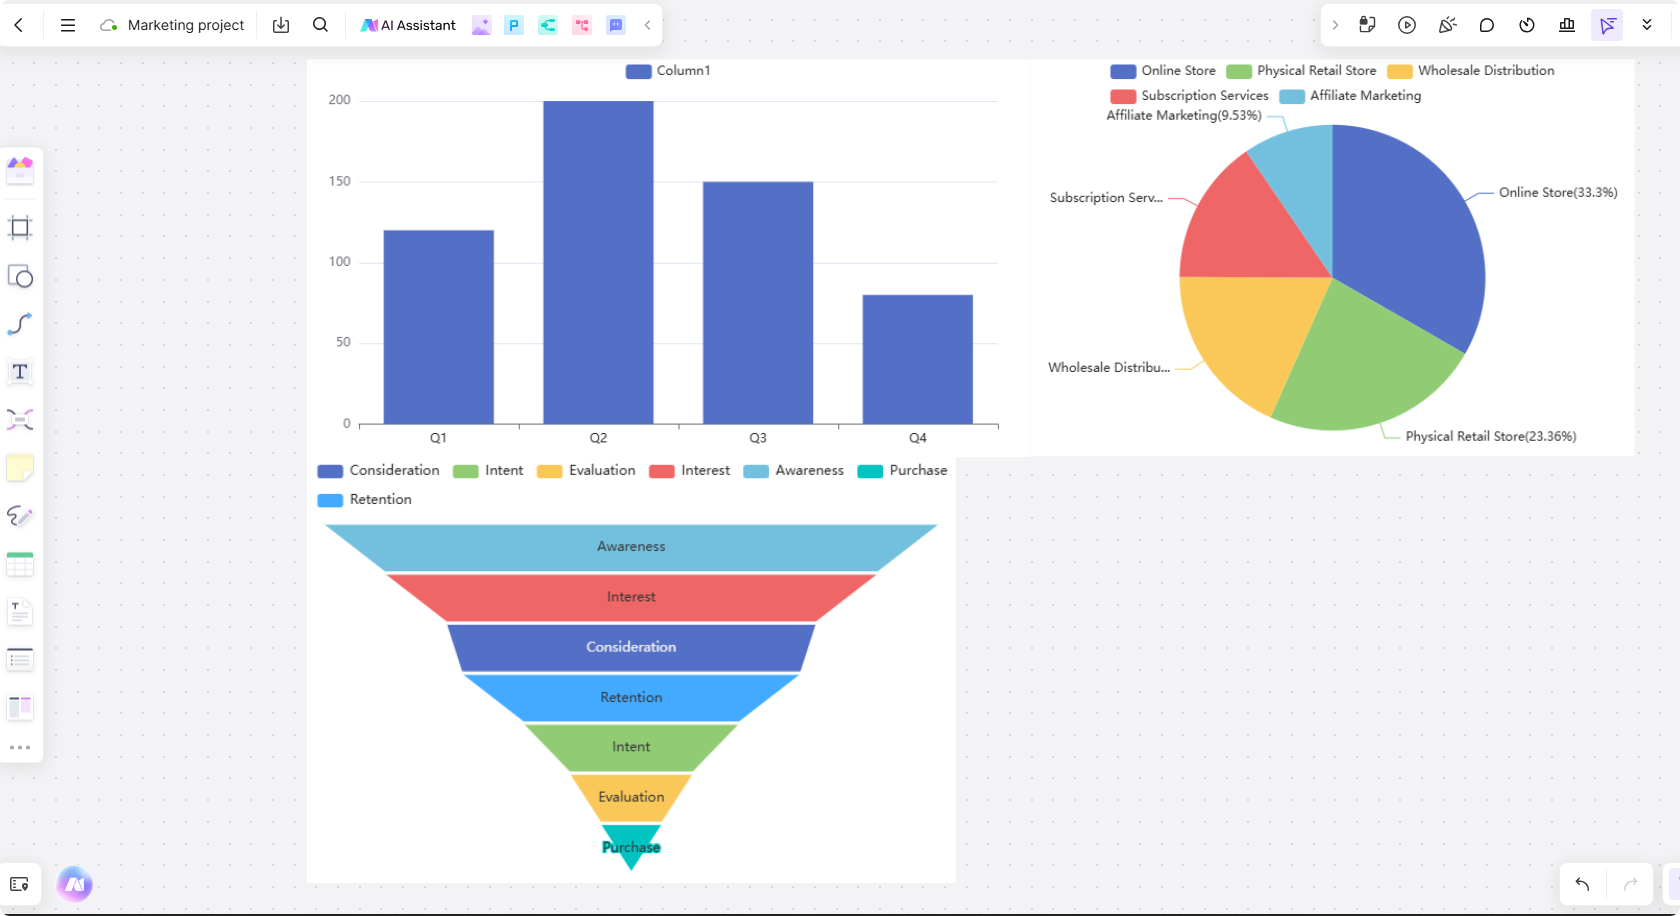
Sales dashboards are crucial for tracking key metrics such as leads, sales pipeline status, and revenue generation. By visualizing data at each stage of the sales funnel, professionals can identify potential bottlenecks and take immediate action. For example, sales managers can monitor the number of leads entering the funnel, conversion rates, and closed deals, providing a comprehensive overview of the sales process.
A revenue tracking dashboard goes beyond sales funnels by focusing on actual income and comparing current performance with historical data. This enables sales teams to assess their progress toward revenue goals and make adjustments where necessary.
HR: Employee Engagement and Recruitment Metrics
Human resources professionals rely on dashboards to track employee engagement, recruitment progress, and workforce analytics. These dashboards can present metrics such as employee satisfaction, retention rates, diversity and inclusion data, and hiring metrics. By visualizing this data, HR departments can quickly identify areas for improvement or spot trends in employee behavior and engagement.
For example, an HR dashboard could display key performance indicators (KPIs) such as employee turnover, average time to hire, and diversity metrics, allowing HR professionals to act on this data in a timely manner.
Project Management: Task Timelines and Resource Allocation
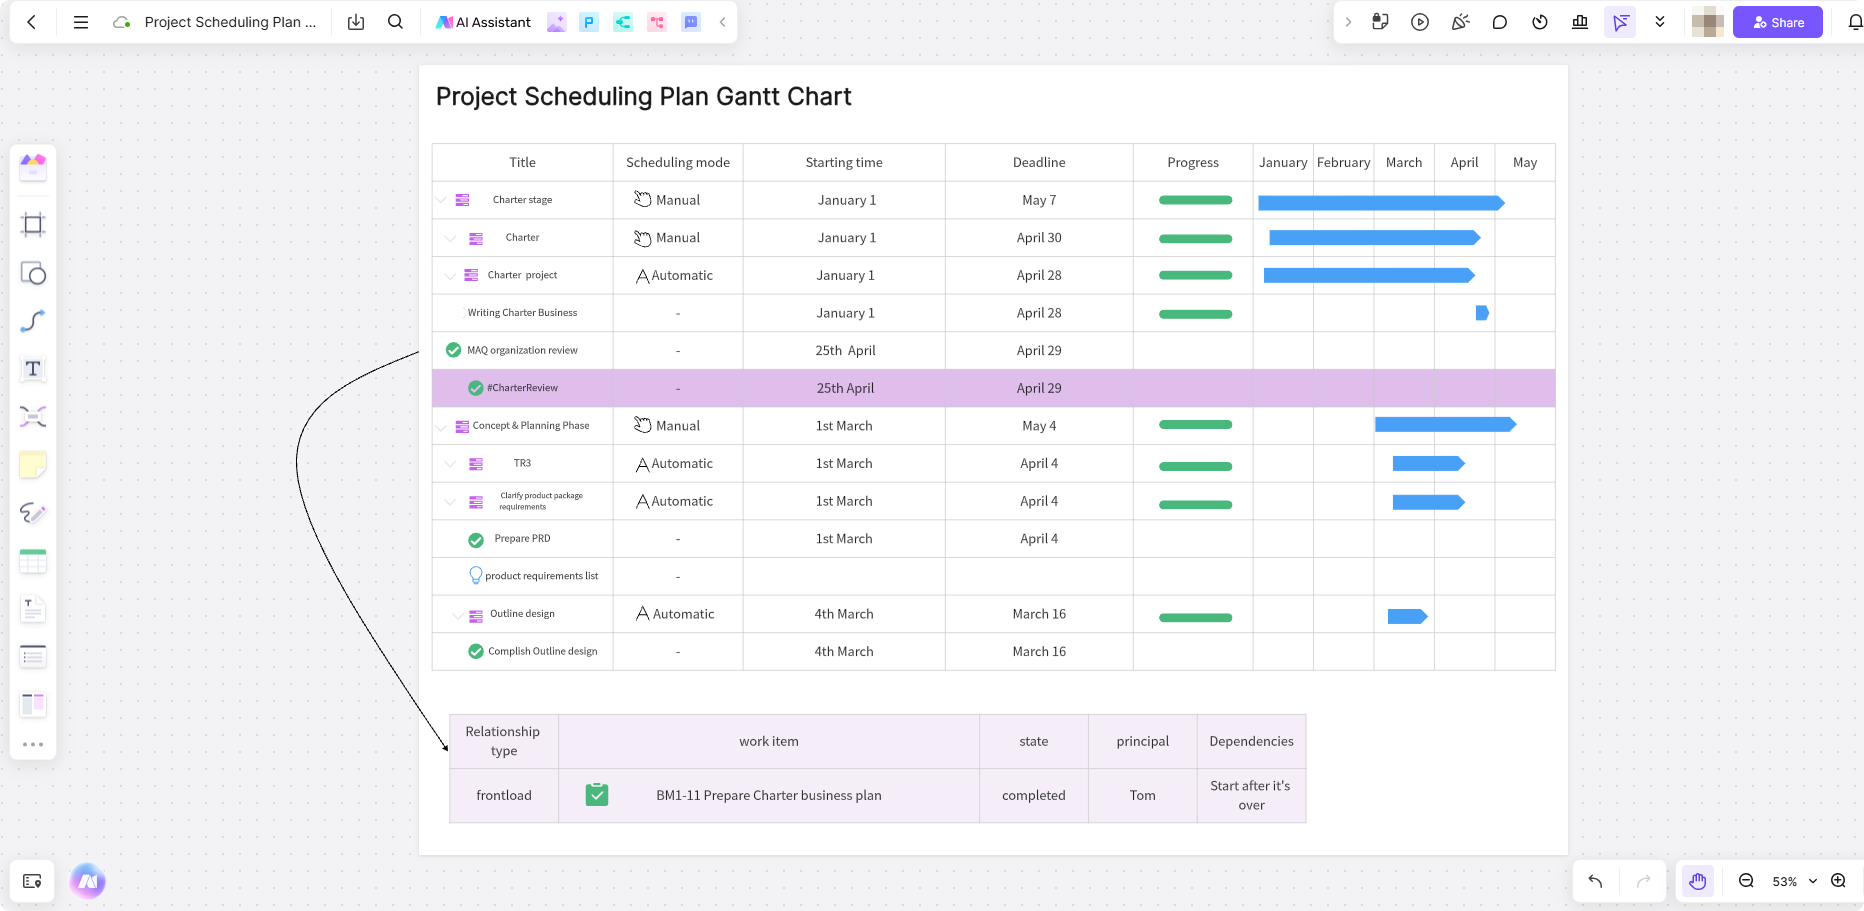
For project managers, dashboards are invaluable tools for tracking task timelines, milestones, and resource allocation. A project management dashboard enables professionals to monitor project progress, identify delays, and allocate resources efficiently. It can visually represent timelines, deliverables, and key milestones to ensure that projects stay on track and meet deadlines.
Project management dashboards also offer insights into resource utilization, helping managers determine if the project has sufficient resources or if adjustments need to be made.
Free Resource for Designing Dashboards: Empower Your Design Flow
Boardmix is a versatile online whiteboard that enhances your design process by providing powerful tools for collaboration, customization, and seamless integration, helping you streamline creative workflows and boost productivity.
Boardmix’s Highlight Features for Dashboard Design
Boardmix offers a range of powerful features that make dashboard design easier, more efficient, and highly collaborative. Here's an overview of its key features for creating impactful dashboards.
- Wide Variety of Pre-designed Templates
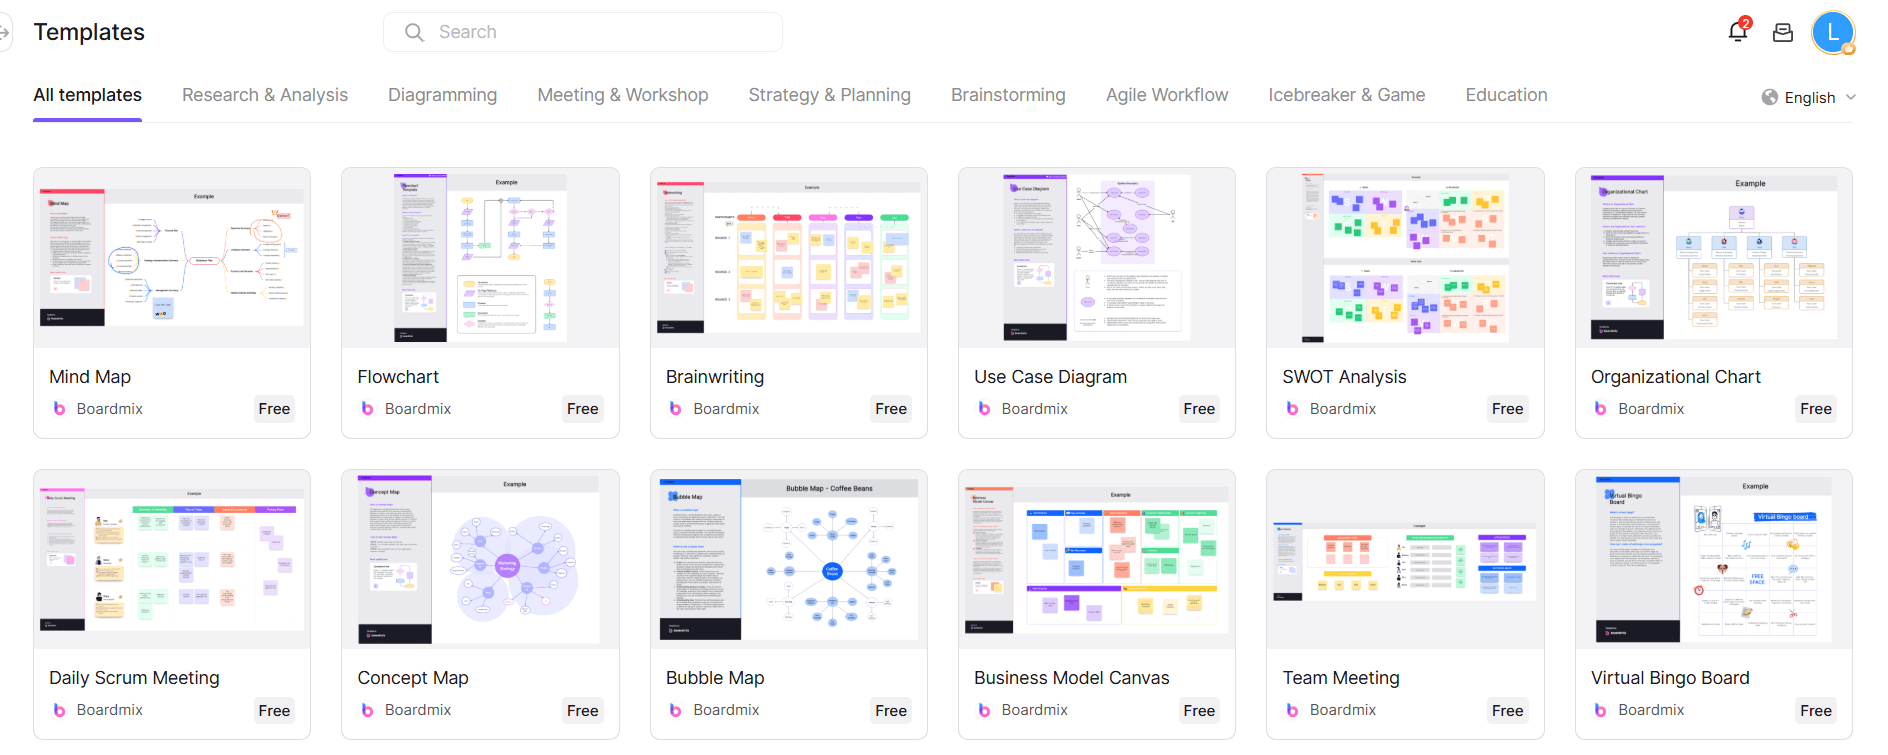
Boardmix provides a broad range of pre-made templates specifically designed for dashboards. These templates are customizable, allowing users to quickly design professional and visually appealing dashboards without starting from scratch. Whether for tracking sales, performance, or project management, there’s a template for every need.
- Extensive Shape and Image Library
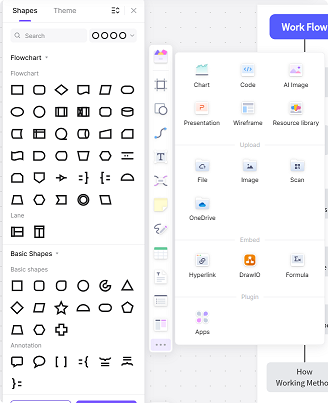
The platform features a rich library of shapes, icons, and images, making it easy for users to enhance their dashboard design. Users can incorporate various visual elements, such as charts, graphs, and symbols, to effectively communicate data and highlight important metrics.
- Incorporation of Charts for Data Analysis
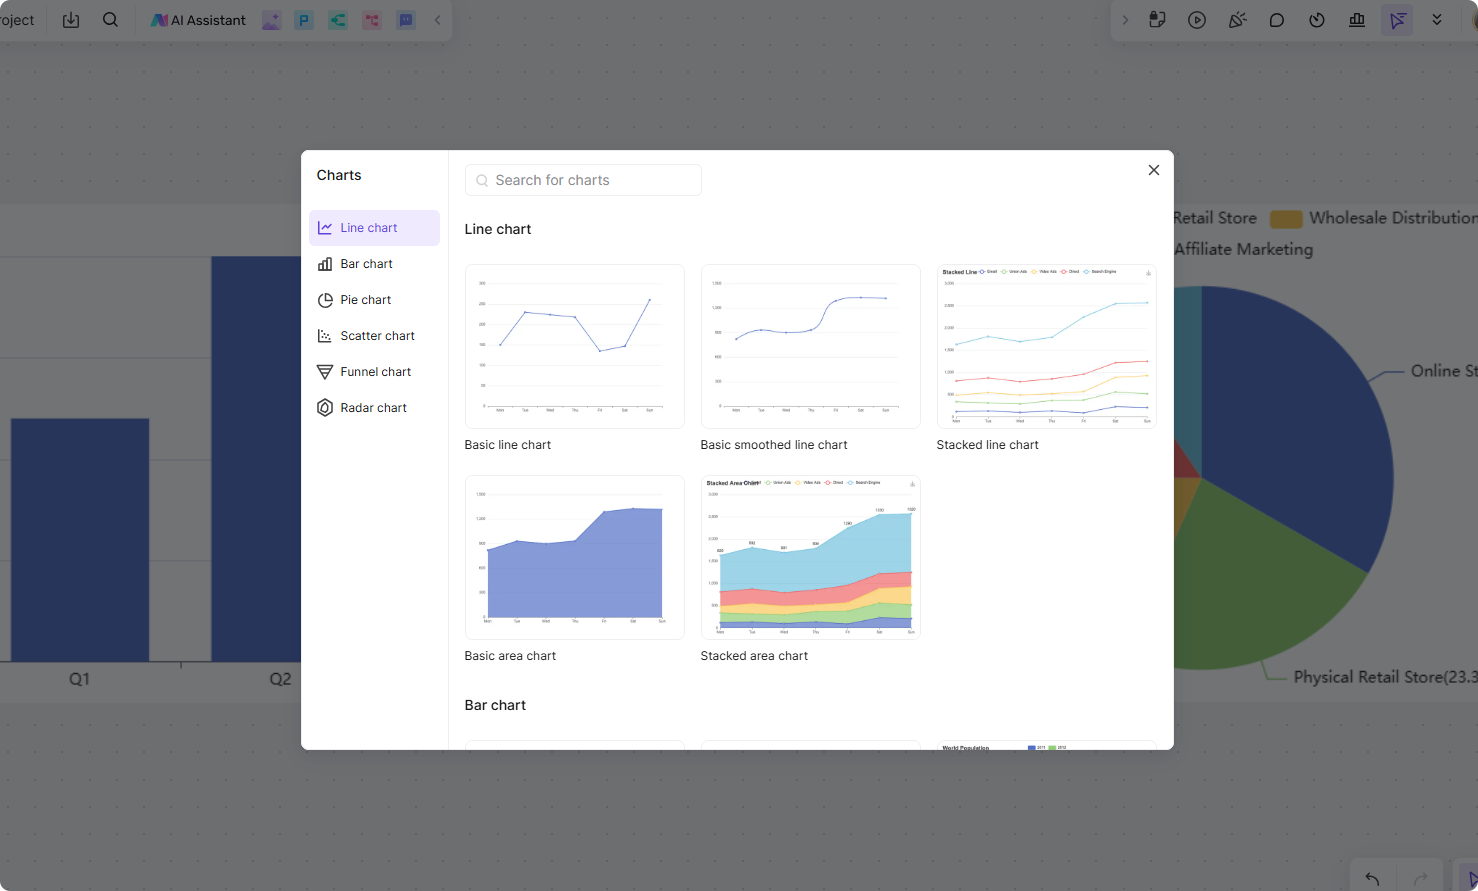
Boardmix allows users to seamlessly integrate various charts and graphs into their dashboards. This helps in transforming complex data into easily understandable visuals, making data analysis more efficient and insightful for decision-making.
- Real-time Collaboration
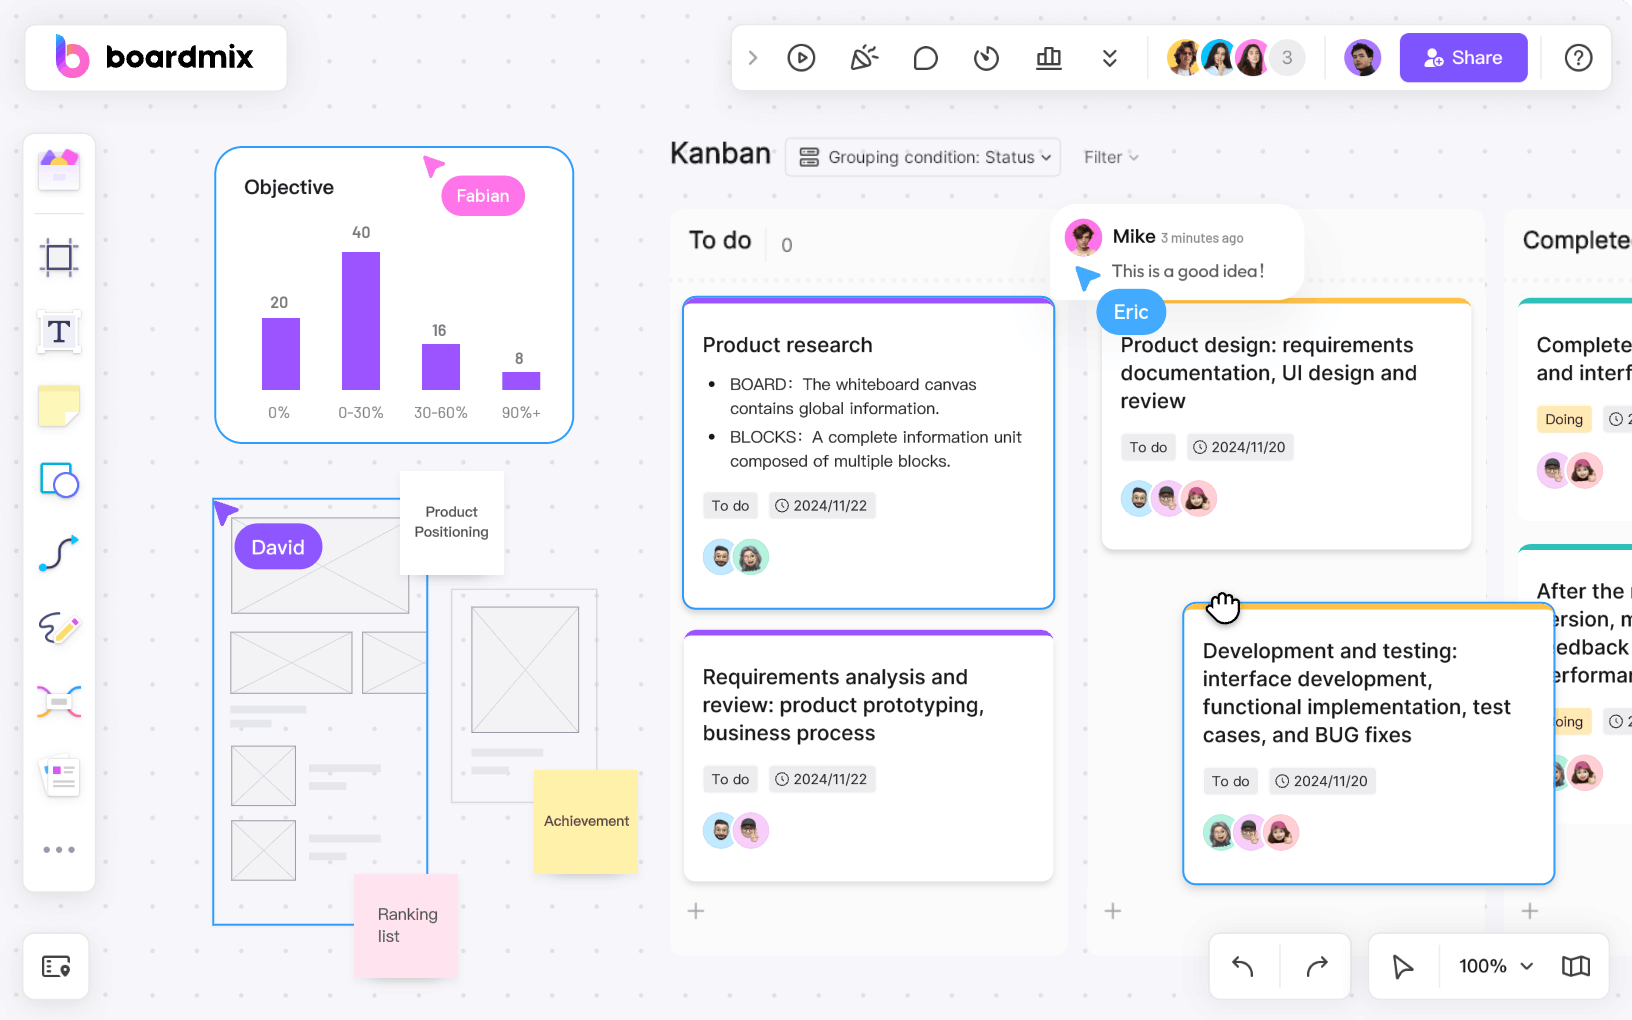
Boardmix’s real-time collaboration feature allows multiple team members to work on the same dashboard simultaneously. This fosters better communication, ensures alignment, and enables quick adjustments based on feedback.
Boardmix’s Free Resource for Designing Dashboards
Boardmix offers several templates to facilitate dashboard design, each catering to different stages of the design process. These templates help streamline workflows, ensuring clarity and consistency throughout the design journey.
- Design Thinking Template
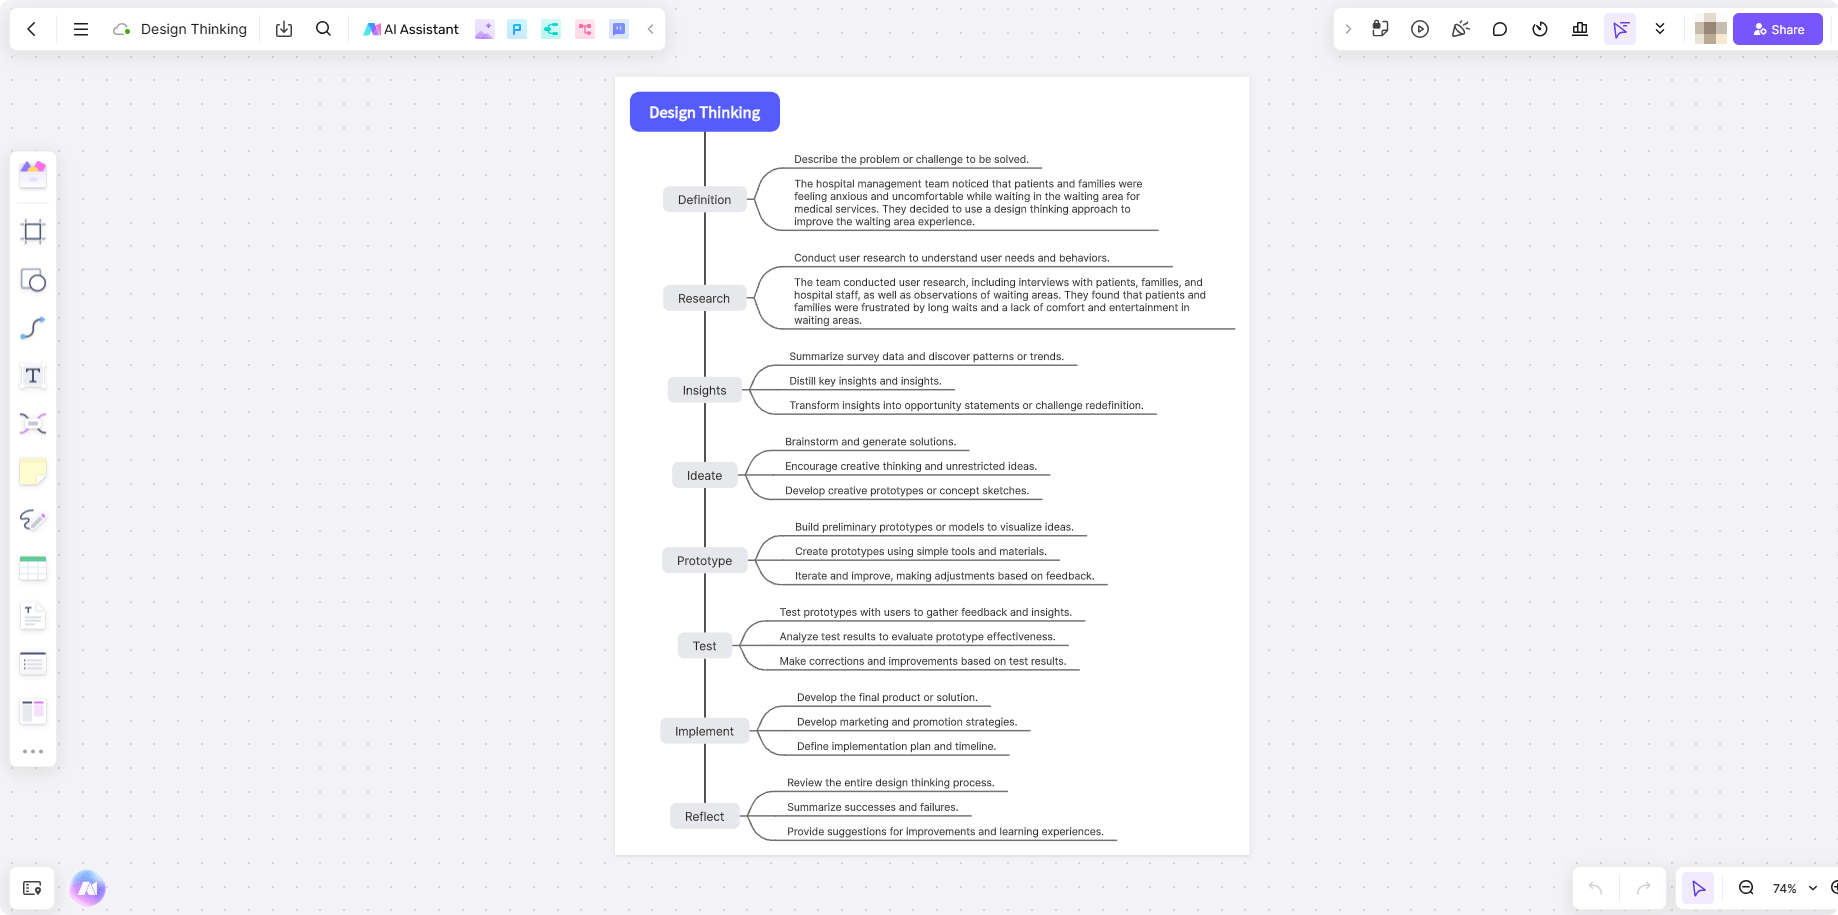
This template is ideal for the initial brainstorming and ideation phase. It helps designers structure their thoughts around the user experience, ensuring that the final dashboard design is user-centric and meets the needs of the target audience. It encourages creative problem-solving, helping you refine your vision for the dashboard.
- Design Requirement Template
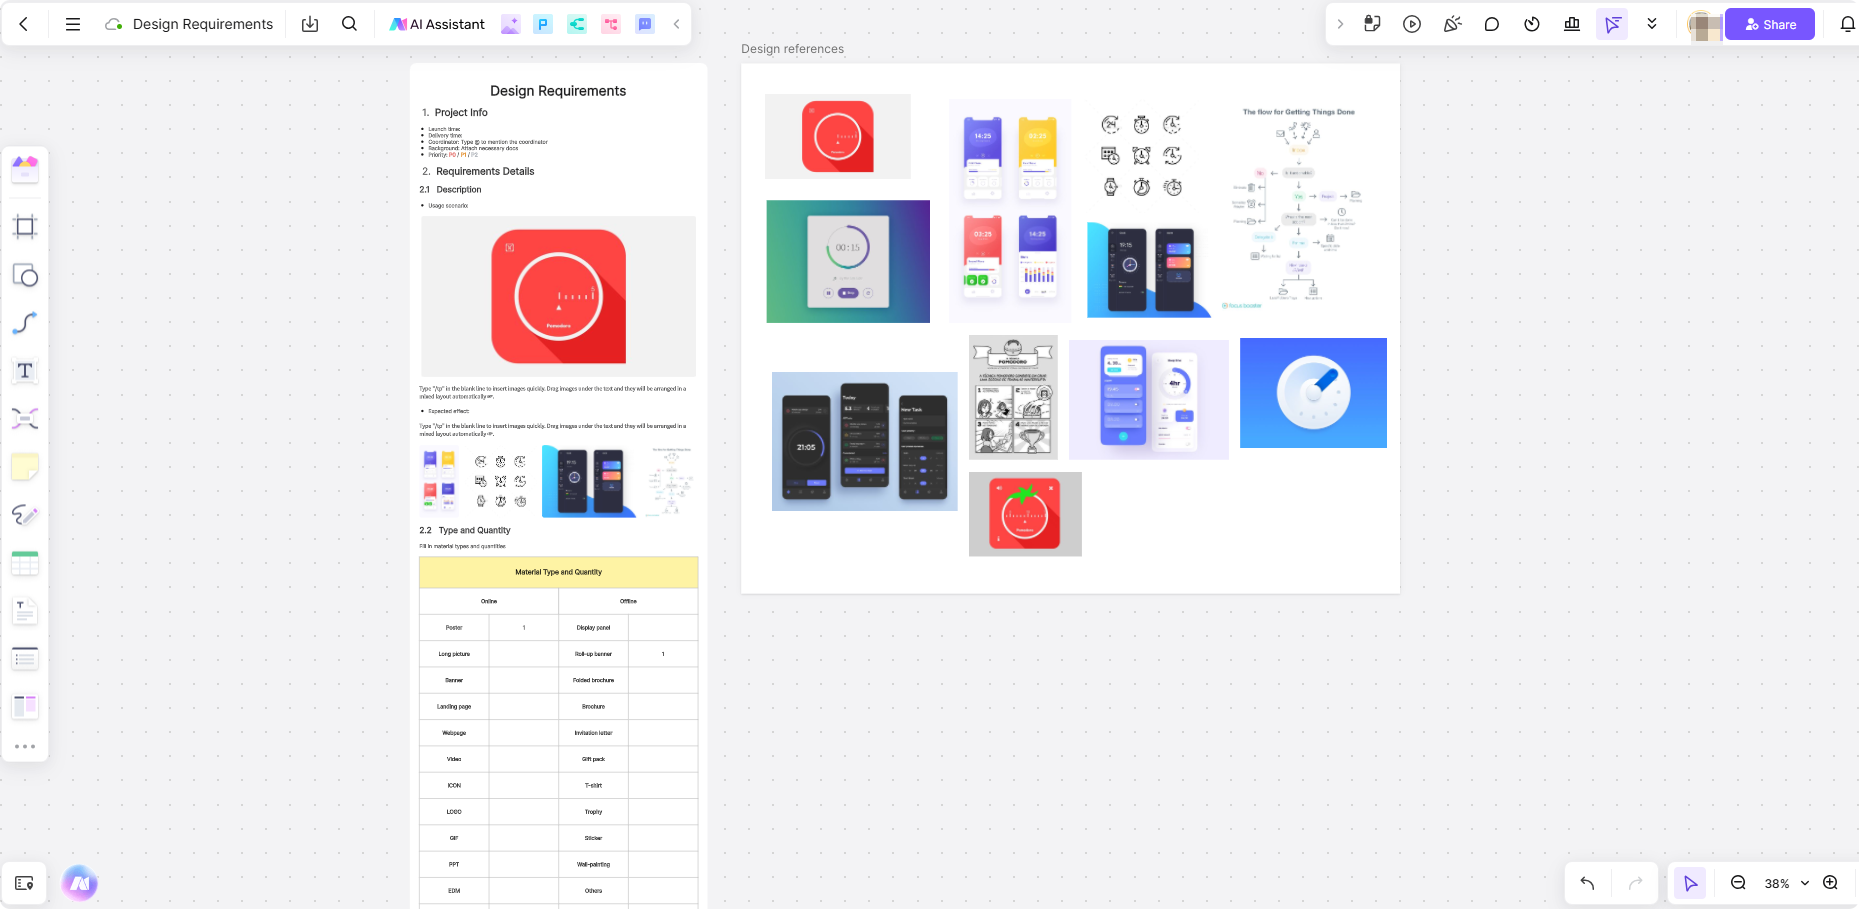
Used during the planning and specification phase, this template helps outline the key requirements for the dashboard design. It includes sections for design descriptions, data to be included, and the number of visual elements needed. It ensures that everyone involved in the project has a clear understanding of what the final design will entail and the specific features required.
- Requirement Kanban of Design Team Template
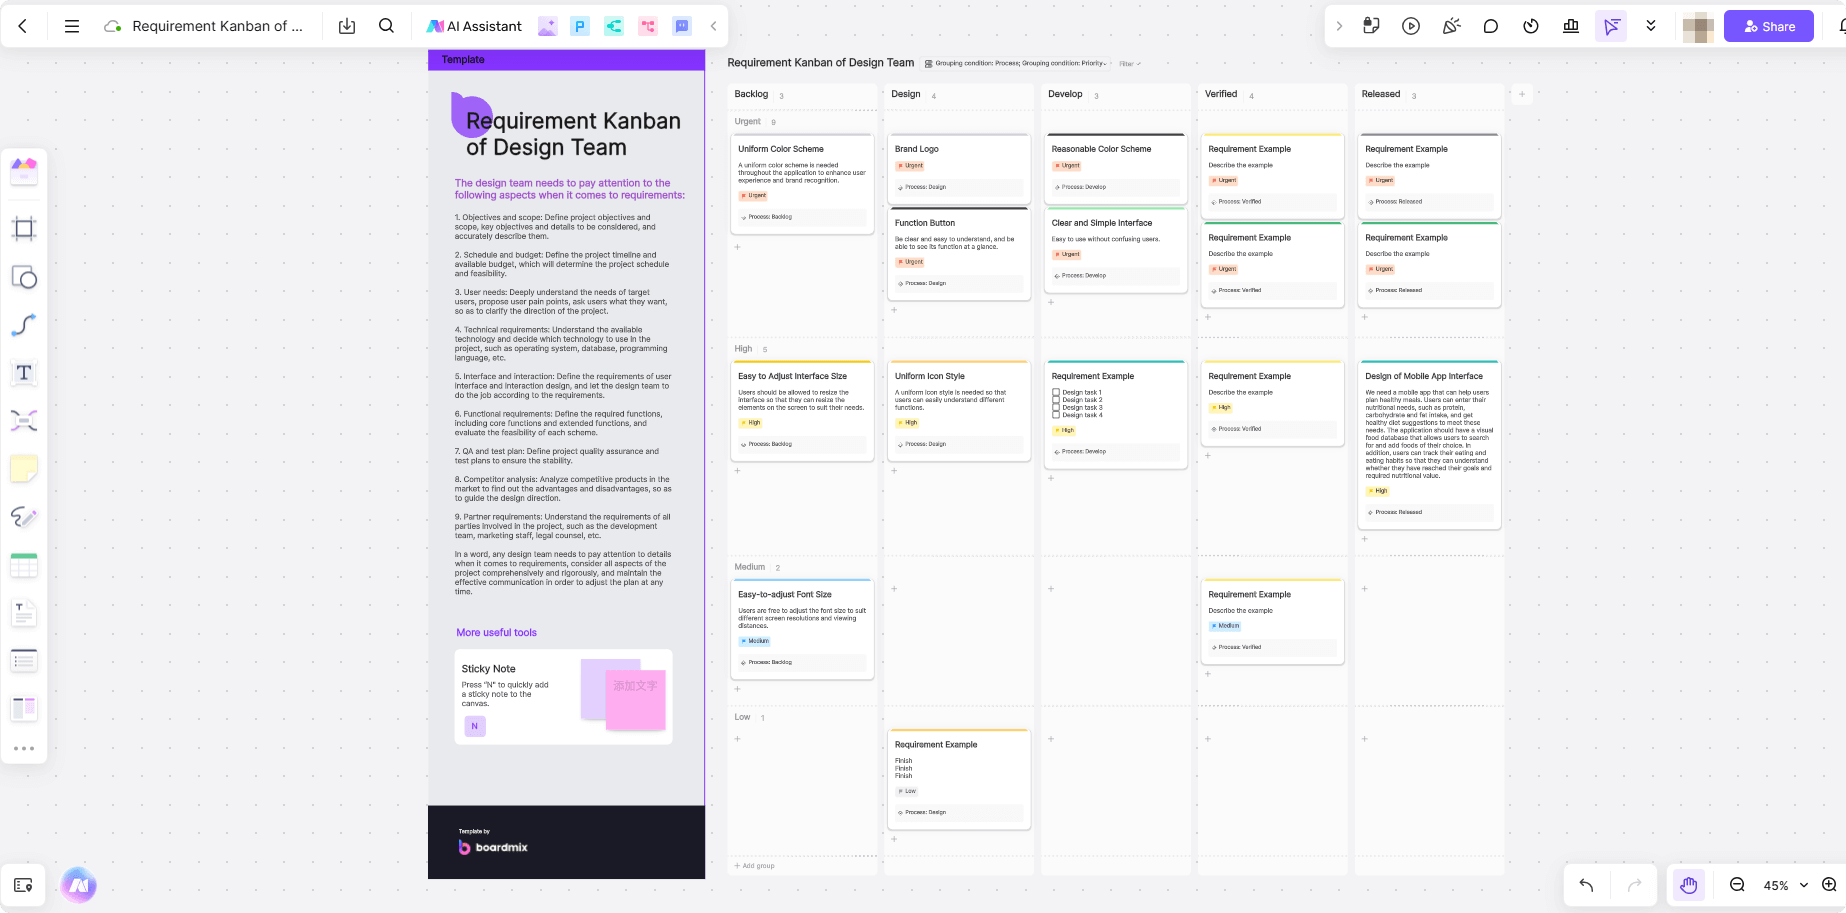
This template is best used for team collaboration and progress tracking. It helps manage the workflow of the design team by organizing tasks into categories such as "To Do," "In Progress," and "Completed." It ensures that all team members are aligned and working toward a shared goal, with clear visibility on each task's status.
Each of these templates corresponds to a different phase of the dashboard design process, offering a structured approach to design development, collaboration, and execution.
The Bottom Line
In conclusion, professional dashboards are essential for effective data visualization and decision-making. With Boardmix, you can enhance your dashboard design process through seamless collaboration, ready-to-use templates, and intuitive design tools. Regardless of tracking performance or monitoring key metrics, Boardmix helps you create visually engaging dashboards that drive actionable insights and professional success.


