

A flow chart for solar panel can simplify the complex manufacturing process into clear, structured steps, helping engineers, technicians, and even ordinary users understand how raw materials are transformed into efficient, power-generating solar panels.
In our daily lives, solar panels are widely used—from rooftop photovoltaic systems and large-scale solar farms to portable solar chargers, they are revolutionizing the way we utilize energy. Understanding the manufacturing process not only helps in selecting the right solar products but also fosters greater interest in clean energy technologies.
How to Make a Flow Chart for Solar Panels Manufacturing?
Main Process of the Flow Chart for Solar Panels Manufacturing
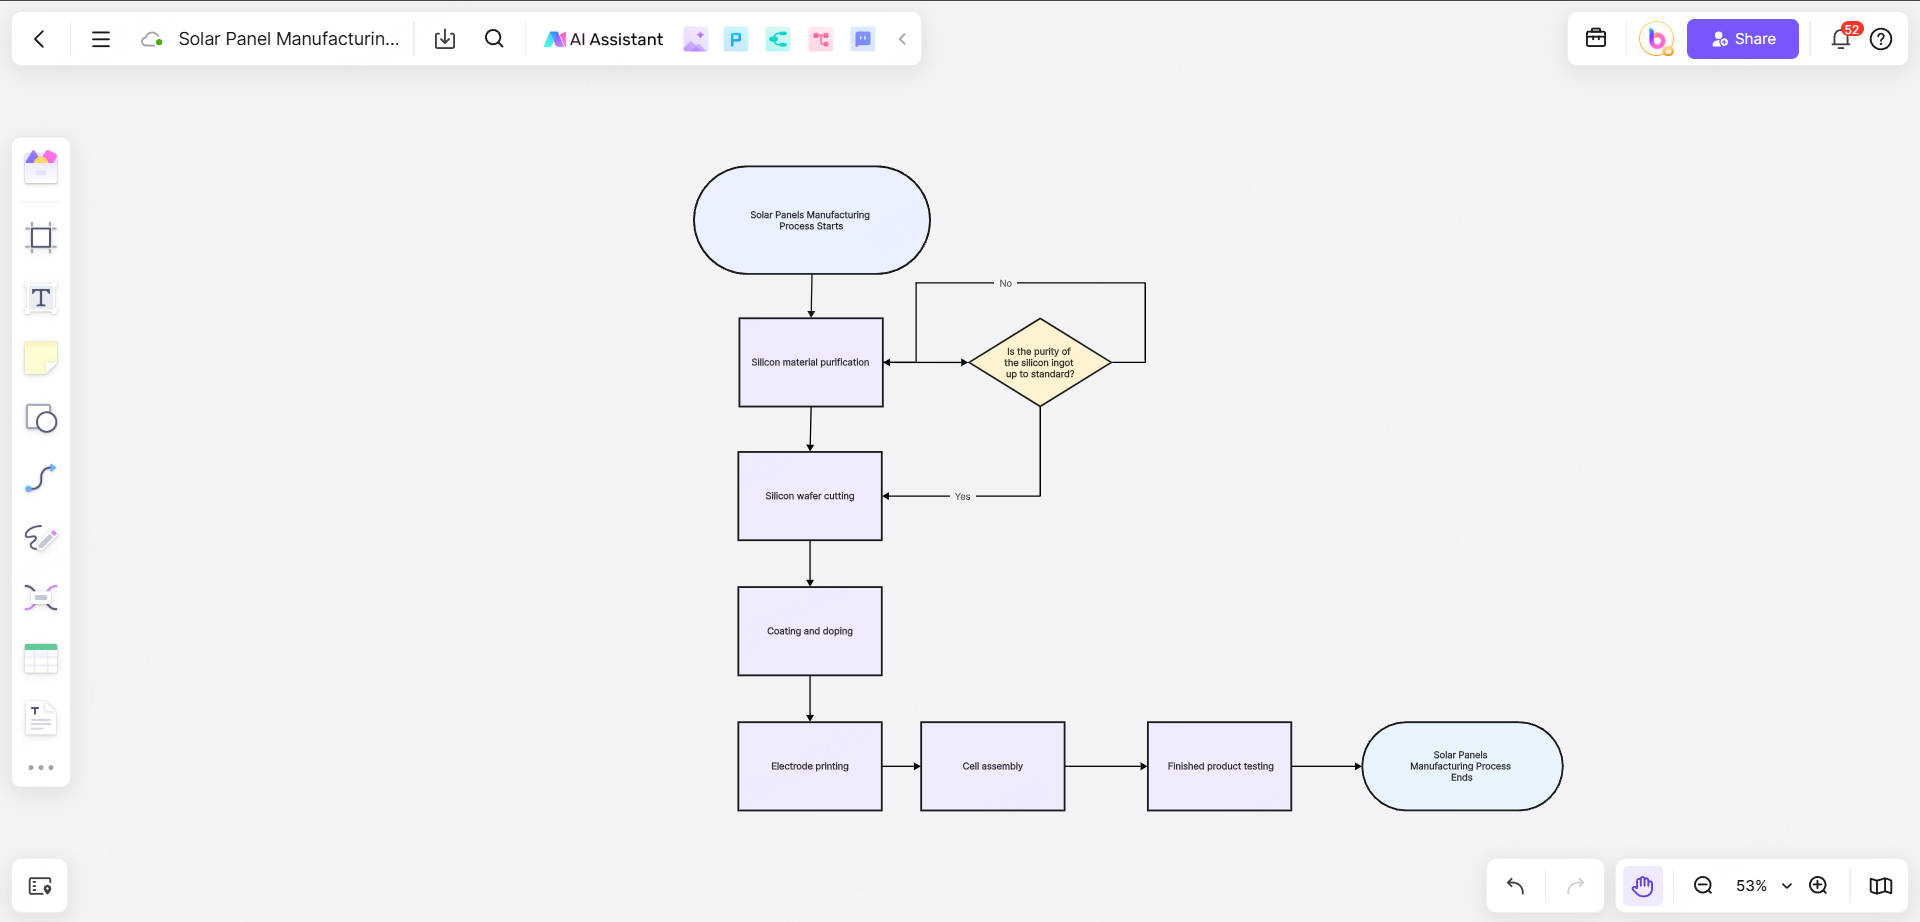
Before making the flow chart, we need to clarify the main process of solar panel manufacturing. The following are typical manufacturing steps.
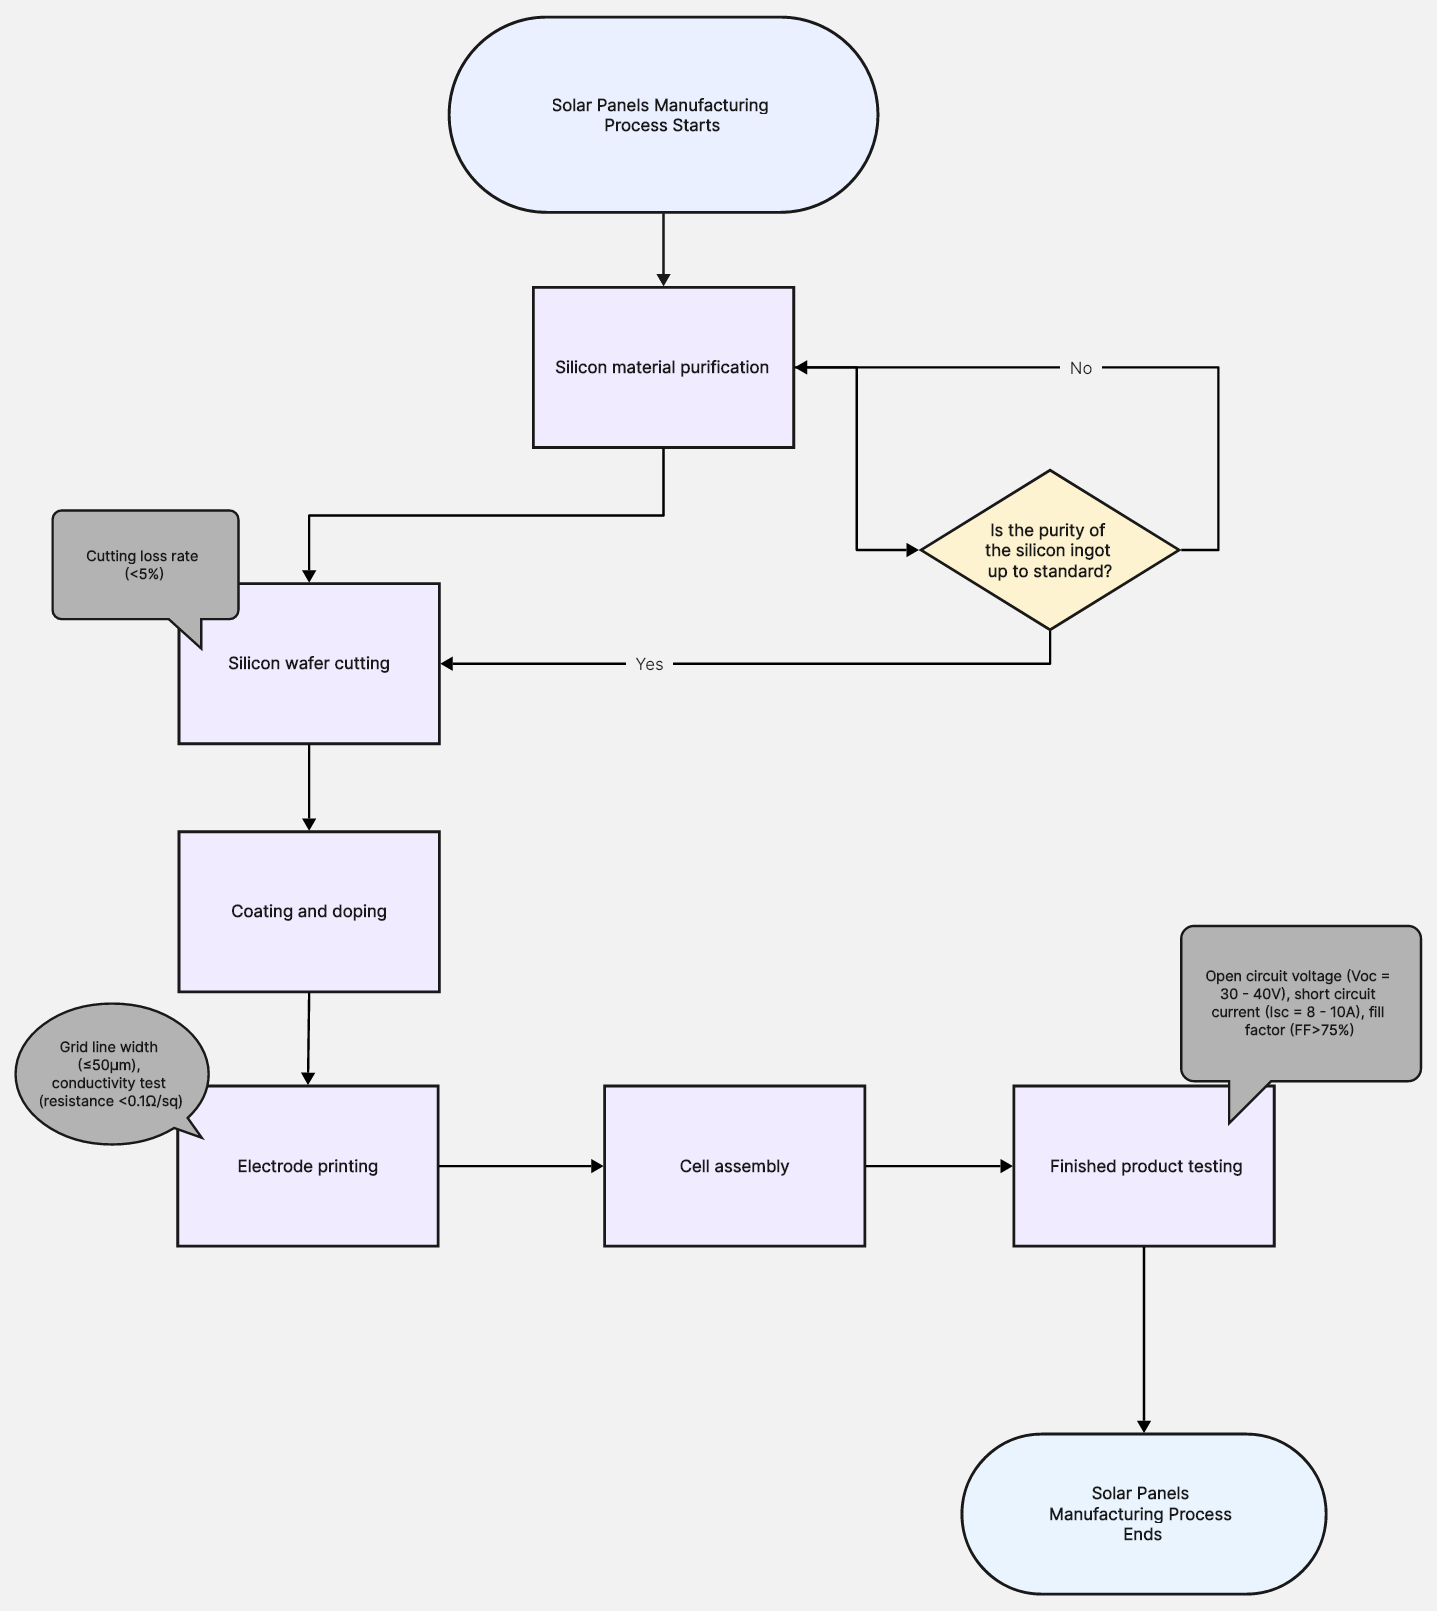
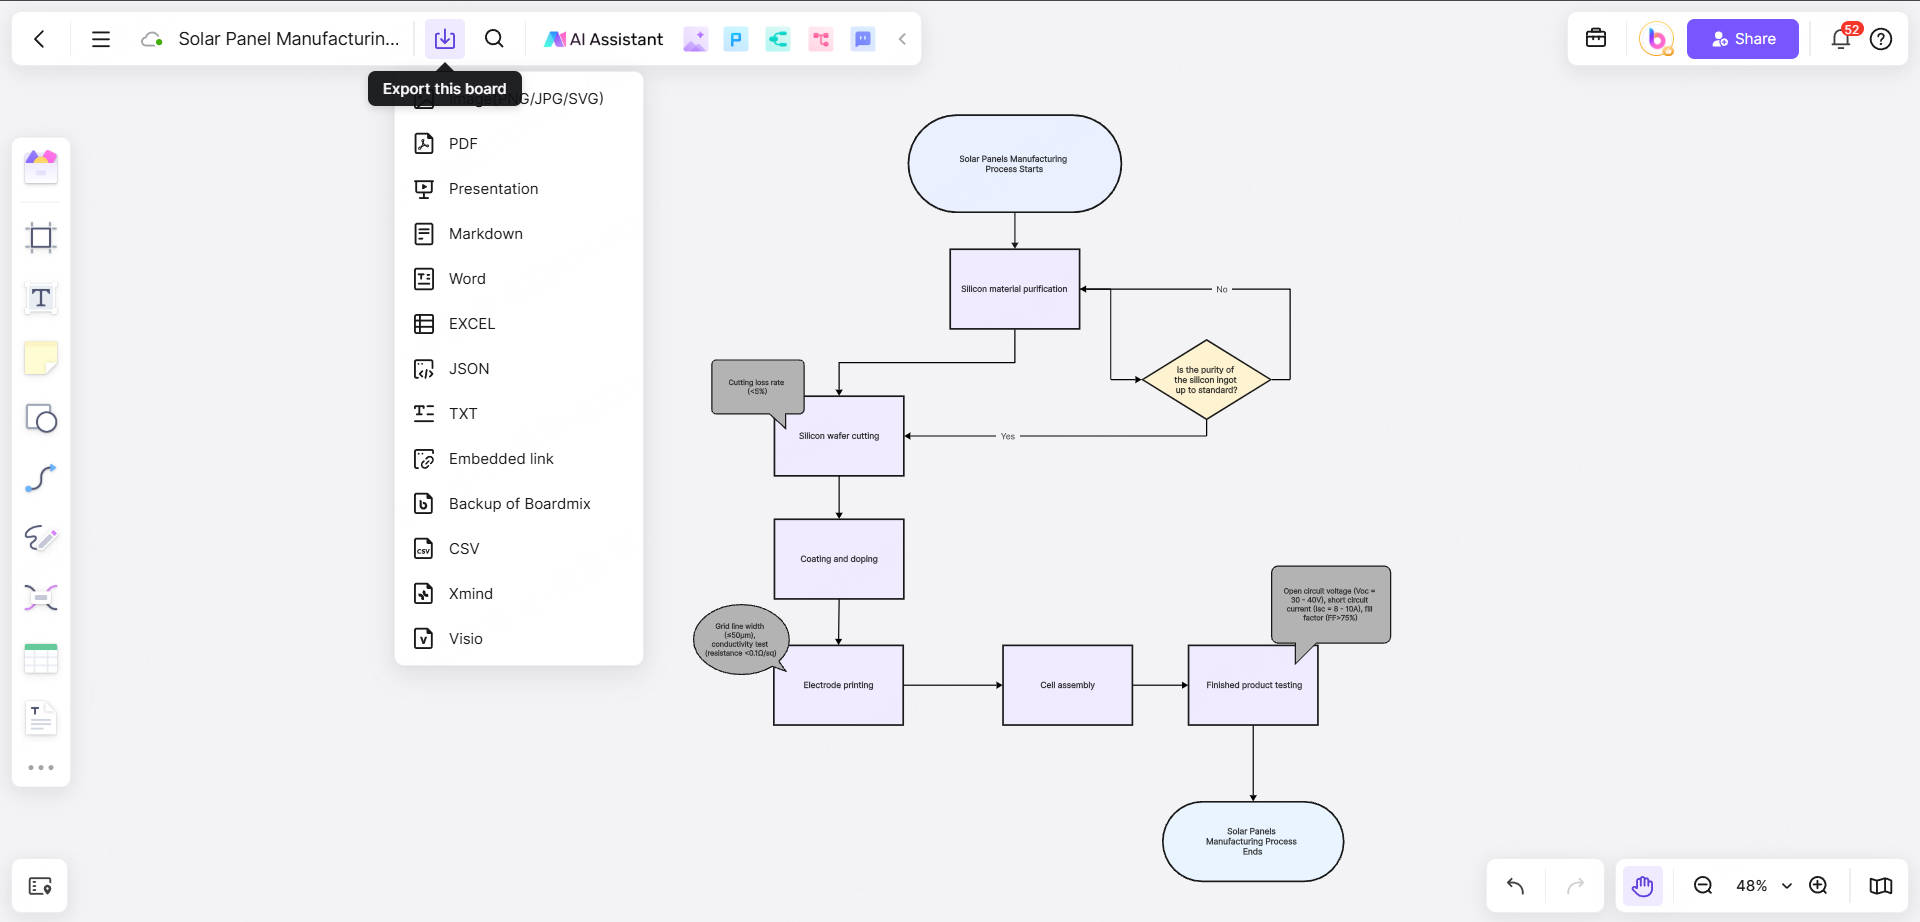
Silicon material purification: purify metallurgical grade silicon to solar grade silicon.
Silicon wafer cutting: cut silicon ingots into thin slices.
Coating and doping: form a PN junction on the surface of the silicon wafer and coat it with an anti-reflection layer.
Printing electrodes: make conductive grid lines through screen printing technology.
Cell assembly: connect the cells in series and package them.
Finished product testing: test the efficiency and weather resistance of the finished product.
These steps constitute the backbone of the flow chart. Next, we need to add detailed branch processes and technical parameters for each step.
Branch Steps of the Flow Chart for Solar Panels Manufacturing
The following are the detailed branch steps of each main process:
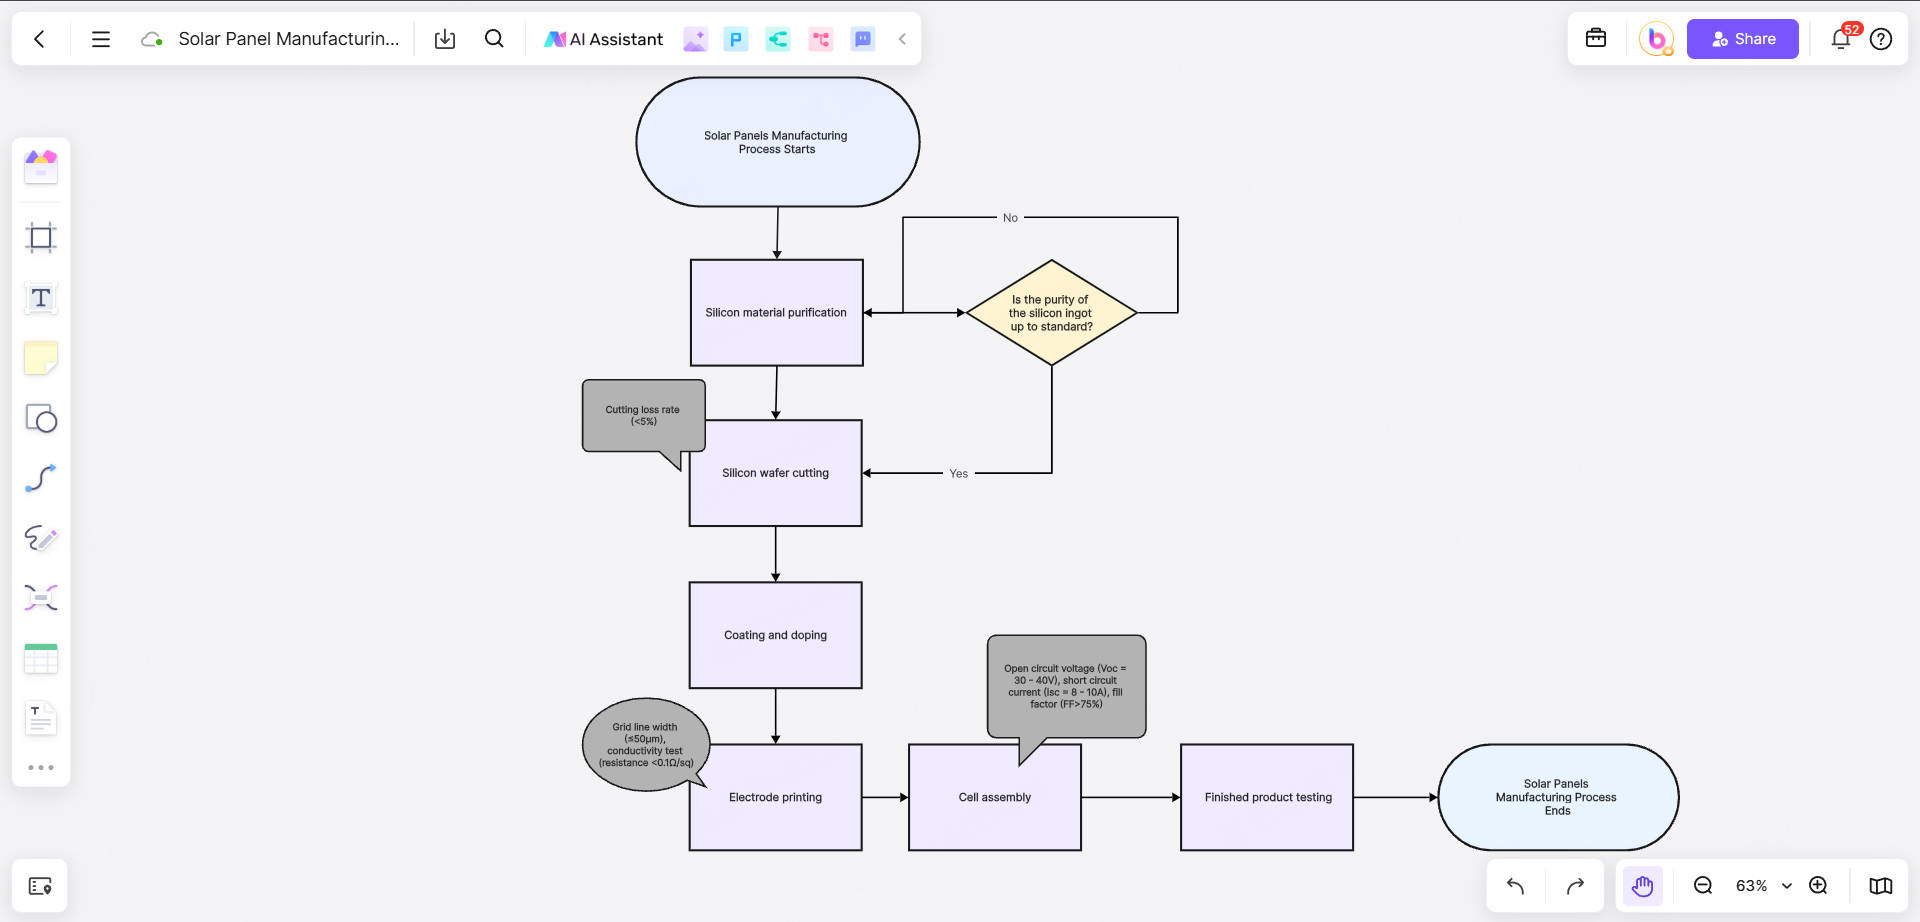
(1) Silicon material purification
Operation: Metallurgical grade silicon (98% purity) is purified to solar grade silicon (99.9999%) through chemical vapor deposition (CVD).
Parameter annotation: Resistivity detection (target value: 1-3 Ω·cm).
Decision point: Is the purity of the silicon ingot up to standard?
Yes → enter the cutting step;
No → return to the purification step.
(2) Silicon wafer cutting
Operation: Use a diamond wire saw to cut the silicon ingot into 180-200 micron silicon wafers.
Parameter annotation: Cutting loss rate (<5%).
(3) Coating and doping
Operation: Form a PN junction on the surface of the silicon wafer through high-temperature diffusion, and coat it with a silicon nitride anti-reflection layer (thickness 80nm).
Parameter annotation: Reflectivity (<5%).
(4) Electrode printing
Operation: Screen printing silver paste and aluminum paste, sintering to form conductive grid lines.
Parameter annotation: Grid line width (≤50μm), conductivity test (resistance <0.1Ω/sq).
(5) Cell assembly
Operation: Solder the cells in series, stack EVA film and backplane, and package them into components.
Parameter annotation: Lamination temperature (150℃), vacuum environment.
(6) Finished product testing
Operation: Conduct IV characteristic test and weather resistance test.
Parameter annotation: Open circuit voltage (Voc=30-40V), short circuit current (Isc=8-10A), fill factor (FF>75%).
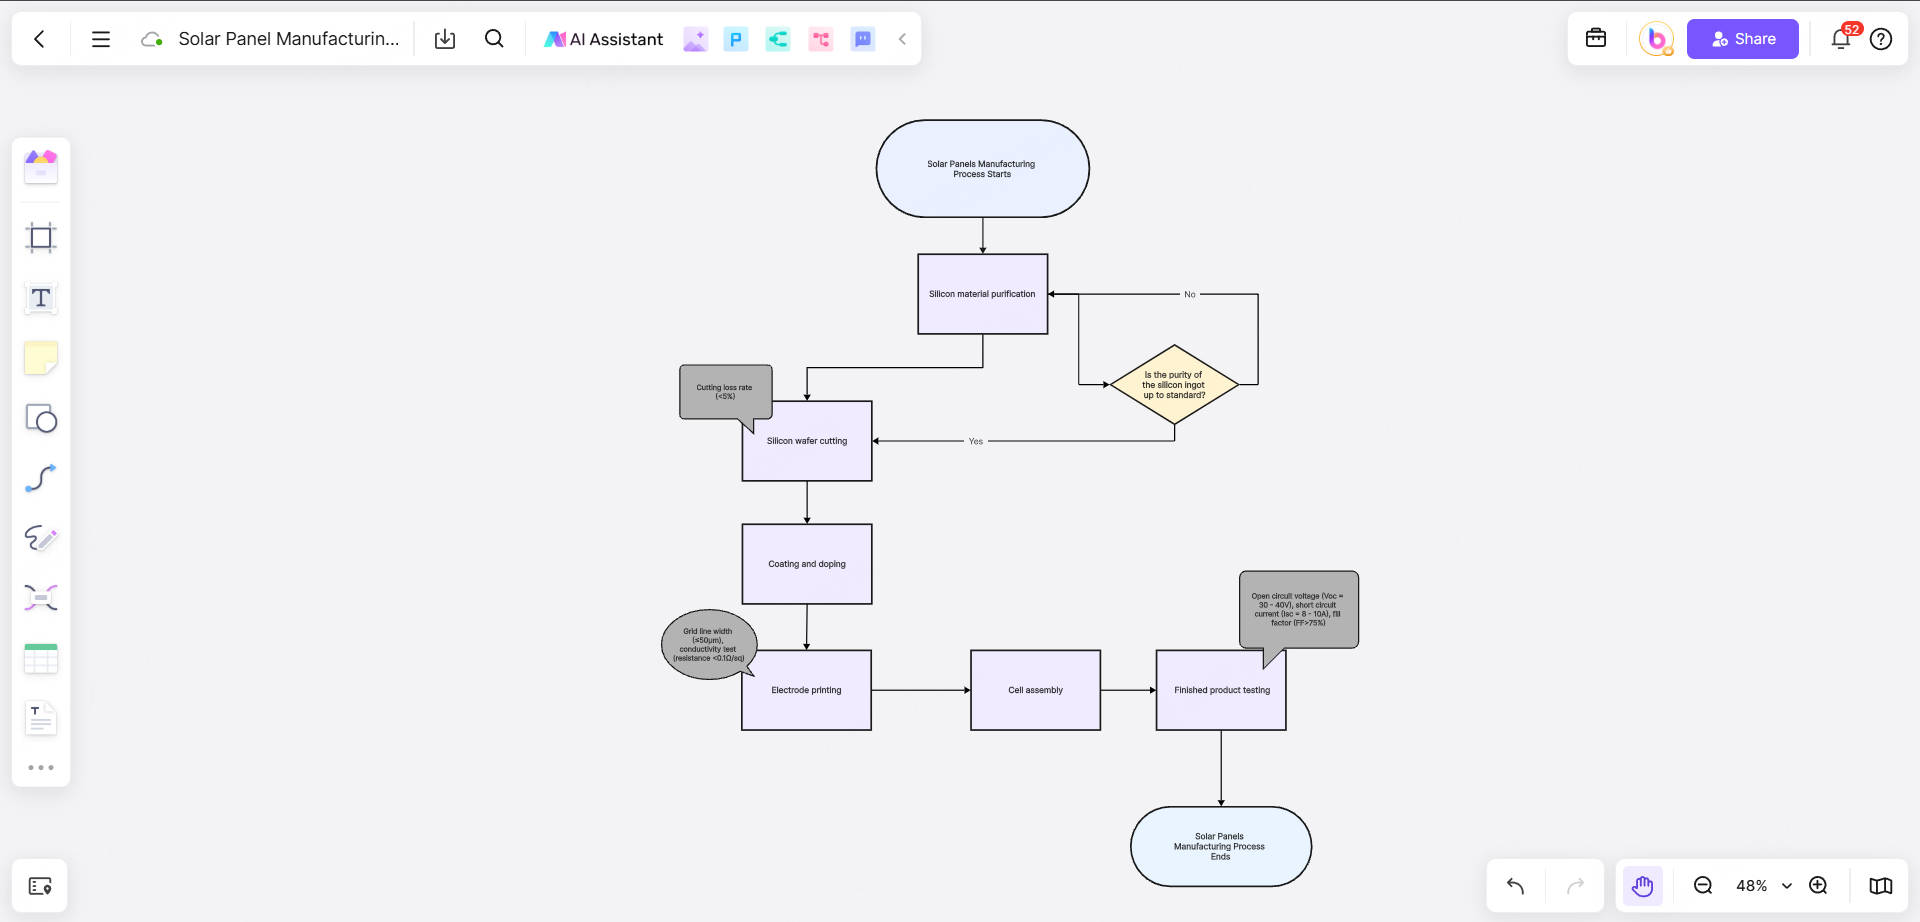
Symbols and Parameter Annotations of the Flow Chart
When drawing a process flow chart, it is important to use standard symbols and clear parameter annotations:
Rectangles: indicate operation steps (such as "Silicon material purification").
Diamonds: indicate decision points (such as "Is the purity of the silicon ingot up to standard?").
Ovals: indicate the beginning and end of the process.
Arrows: indicate the flow direction of the process.
Parameter annotations: Use small fonts or footnotes to mark key parameters (such as "Resistivity: 1-3 Ω·cm").
For example:
Start (oval): "Silicon material purification process starts".
Operation (rectangle): "Metallurgical grade silicon → CVD purification to solar grade silicon".
Decision (diamond): "Is the purity of the silicon ingot up to standard?"
Yes → enter the cutting step;
No → return to the purification step.
Exploring Free Online Flow Chart Maker: Boardmix
Flowcharts are very useful for visualizing processes, such as the solar panel manufacturing process. As a versatile online whiteboard collaboration platform, Boardmix has an intuitive interface, rich functions, and efficient collaboration capabilities, and is very suitable for online flowchart creation.
Features of Boardmix for Flowchart Creation
1. Smart connecting lines
Boardmix's connecting lines can automatically adsorb to the edges of symbols to ensure the beauty and neatness of the flowchart. When you move symbols, the connecting lines will automatically adjust to avoid the trouble of manual adjustment.
2. Unlimited canvas
Boardmix provides unlimited canvas, you can expand the scope of the flowchart at will without worrying about insufficient space. This is especially important for complex solar panel manufacturing flowcharts.
3. Version history and recovery
Boardmix automatically saves the history of each version, you can view or restore to the previous version at any time to avoid data loss caused by misoperation.
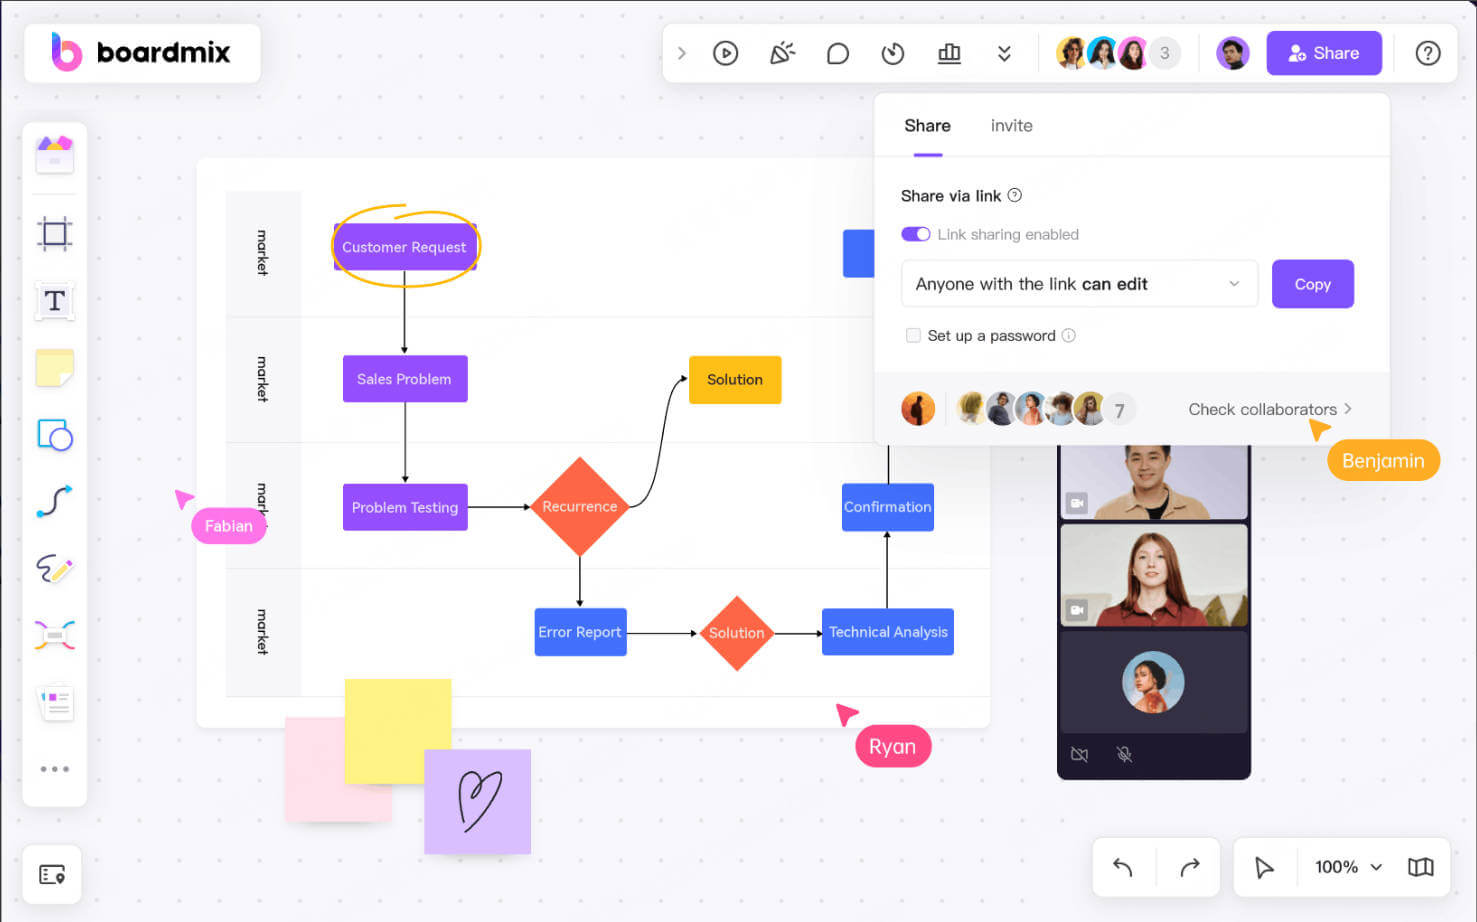
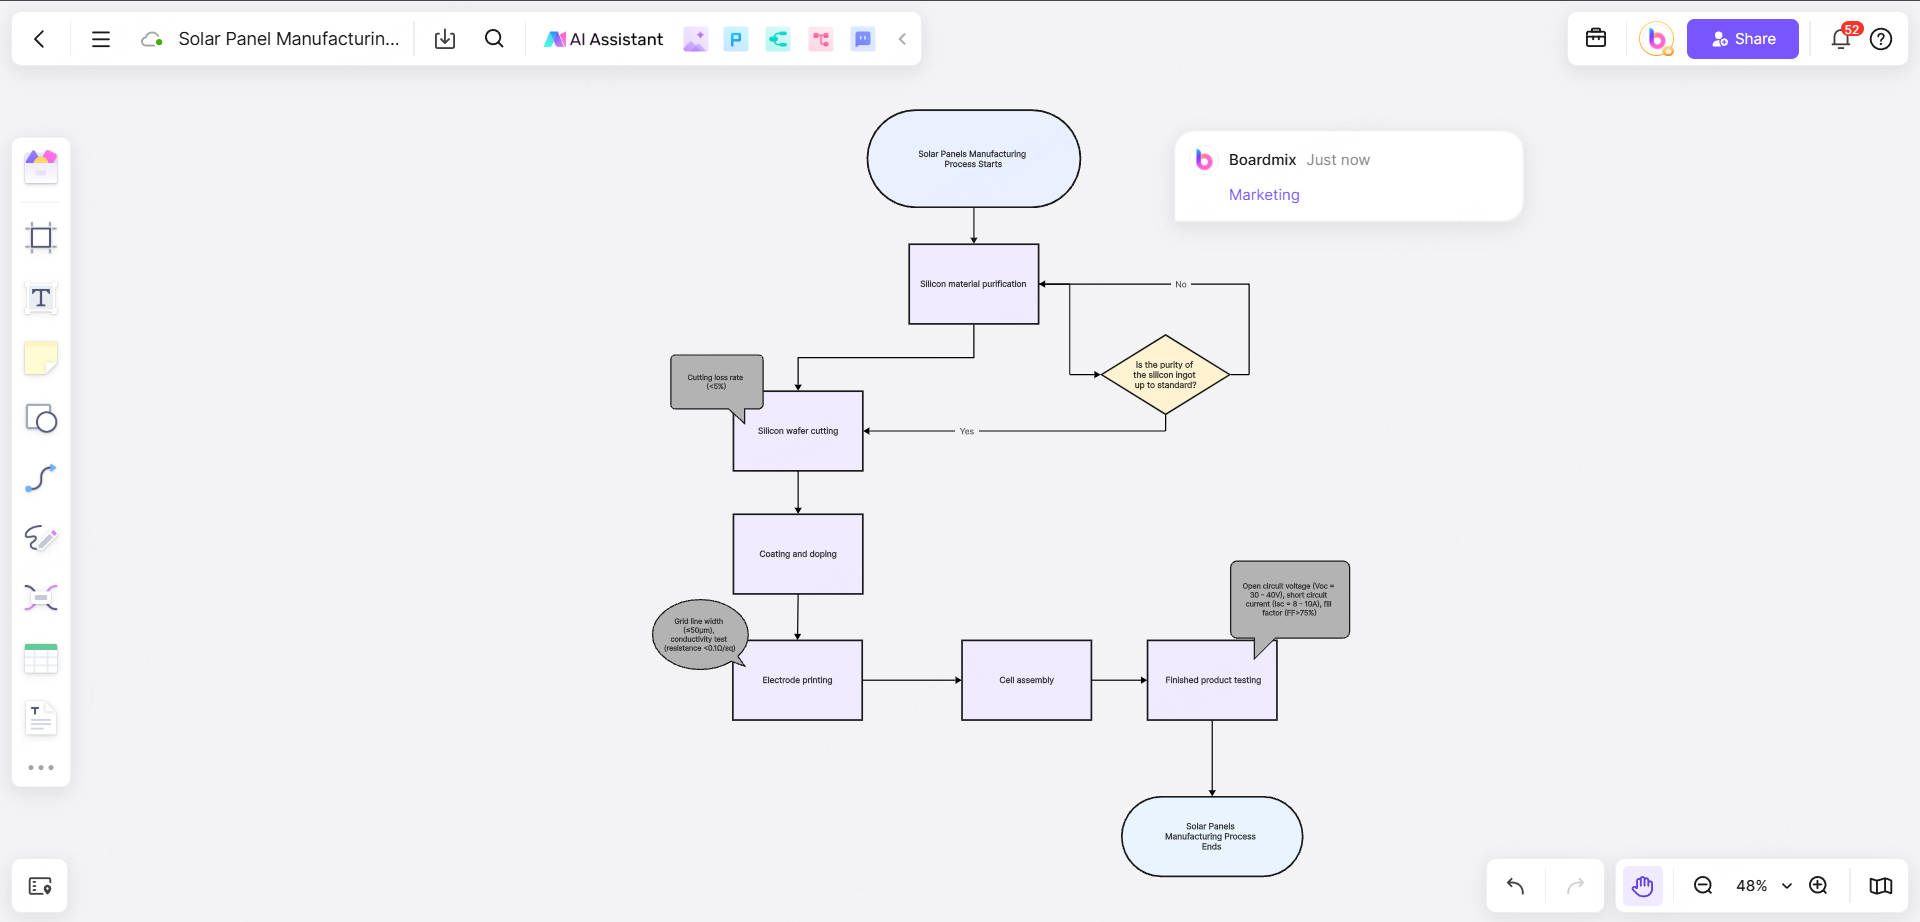
4. Comment and annotation function
When drawing a flowchart, you can add comments or annotations to discuss with team members. For example, add discussion opinions on technical parameters next to a step to ensure the accuracy of the flowchart.
5. Export and share
After completing the flowchart, you can export it to PNG, PDF or other format for easy embedding in documents or presentations. At the same time, Boardmix supports generating sharing links and sharing with colleagues or customers with one click.
Step-by-Step Guide: Make Flow Chart with Boardmix Easily
Now that you have discovered that Boardmix has so many features suitable for making flowcharts. Next, please follow the detailed steps below and let's use Boardmix to create our first solar panel manufacturing flowchart.
Step 1. Create a new whiteboard
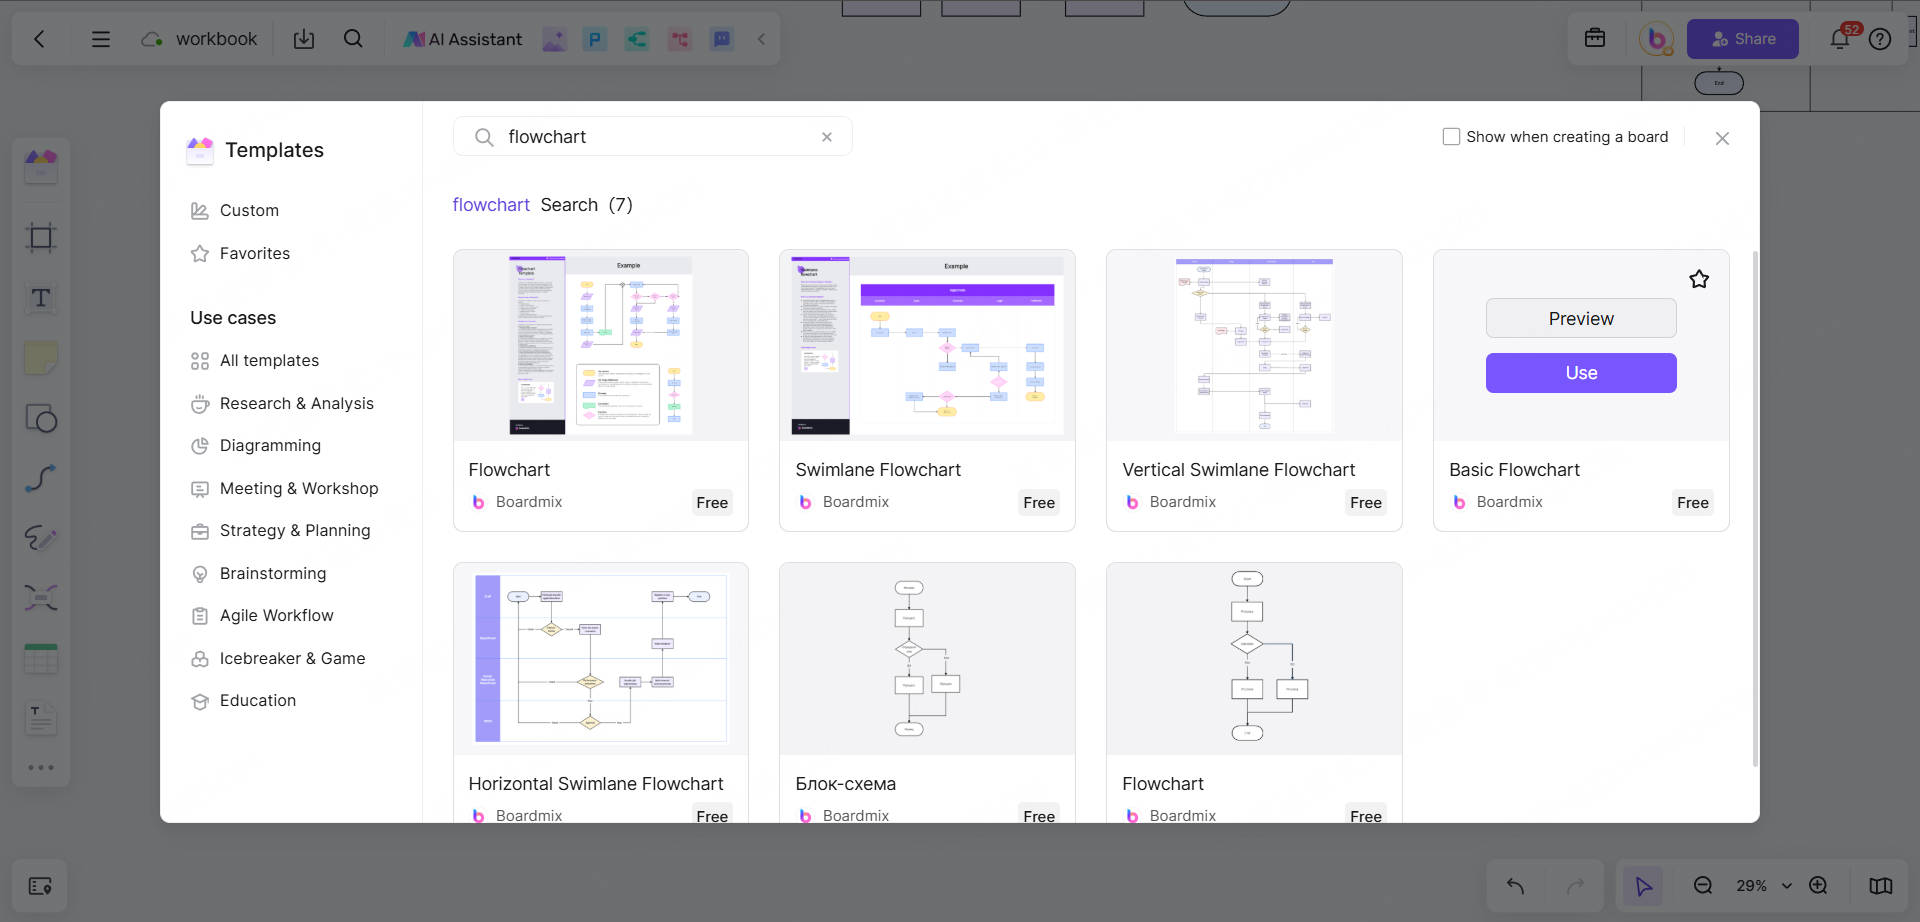
Log in to Boardmix, click "New Whiteboard", and select the "Flowchart" template.
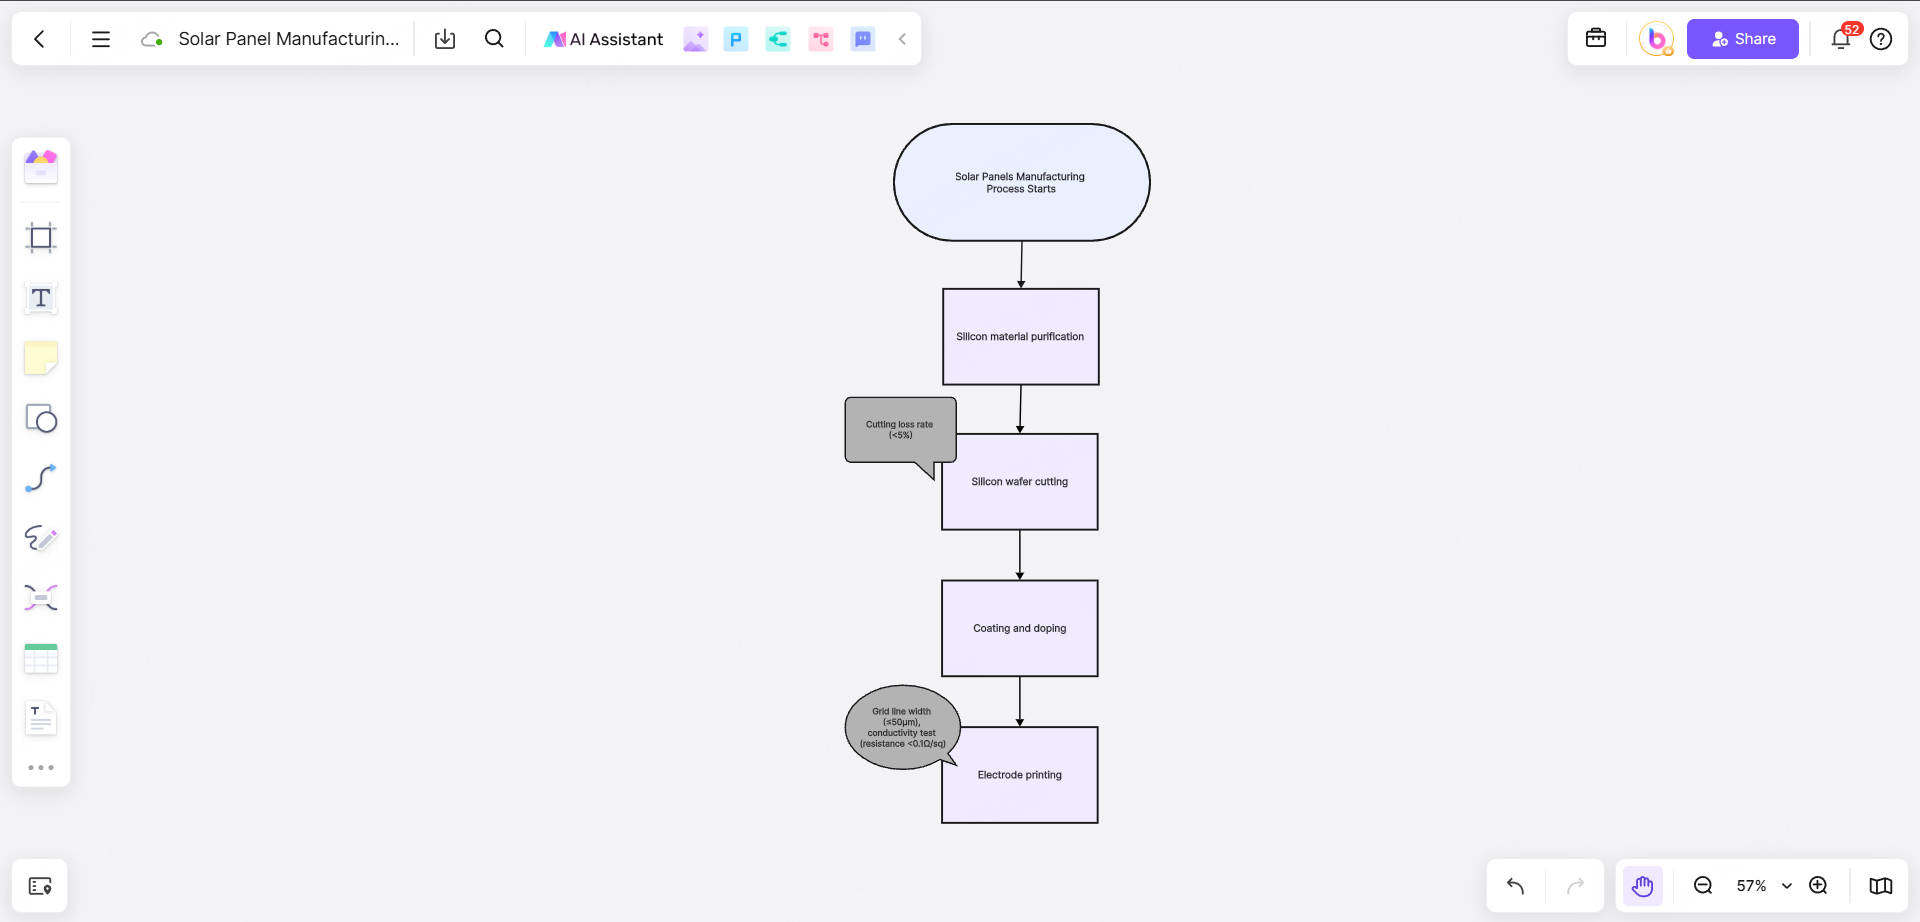
Name the whiteboard, such as "Solar Panel Manufacturing Process".
Step 2. Draw the main process
Select the "Rectangle" symbol from the left toolbar, drag it to the canvas, and enter the main process steps, such as "Silicon Material Purification".
Use "Arrows" to connect the steps to form the main process framework.
Step 3. Add branch processes
For each main process step, add detailed branch processes. For example, under the "Silicon Material Purification" step, add sub-steps such as "Metallurgical Grade Silicon → CVD Purification" and "Resistivity Detection".
Use the "Diamond" symbol to indicate decision points, such as "Is the purity of the silicon ingot up to standard?".
Step 4. Mark technical parameters
Add text boxes next to each step to mark key parameters. For example, mark "Cutting loss rate <5%" next to the "Silicon wafer cutting" step.
Use different colors or icons to distinguish different types of parameters (such as temperature, size, efficiency).
Step 5. Optimize layout and style
Adjust the size and position of symbols to ensure that the flowchart is neat and beautiful.
Use Boardmix's "Alignment Tool" to automatically align symbols and connectors.
Step 6. Collaboration and feedback
Invite team members to join the whiteboard and edit the flowchart together.
Use the "Comment" function to add feedback next to the steps that need to be modified.
Step 7. Export and share
After completing the flowchart, click the "Export" button and choose PNG or PDF format to save.
Generate a sharing link and send it to relevant people.
Why Choose Boardmix to Make Solar Panel Flowcharts?
1. Efficient online collaboration, real-time synchronization
Boardmix supports multiple people to edit online at the same time. Team members can collaborate in real time on the same whiteboard, whether adding steps, adjusting layouts, or adding comments, they can be synchronized instantly. This greatly improves the efficiency of drawing solar panel manufacturing flowcharts that require teamwork.
2. Rich template library
Boardmix has built-in multiple flowchart templates, including basic flowcharts, swimlane diagrams, organizational charts, etc. You can use these templates directly to quickly build the framework of the solar panel manufacturing process and save a lot of time.
3. Intuitive drag-and-drop operation
Boardmix uses drag-and-drop operation. Users only need to select symbols (such as rectangles, diamonds, and ellipses) from the left toolbar and drag them to the canvas to complete the drawing of the flowchart. This operation method is simple and easy to learn, and even beginners can quickly get started.
4. Powerful customization function
You can freely adjust the size, color, font style of symbols, and even add icons and pictures to make the flowchart more vivid and professional. For example, in the solar panel manufacturing flowchart, you can add corresponding technical parameter annotations or picture descriptions for each step.
5. Cross-platform support
Boardmix supports web, desktop, and mobile terminals. Whether you are in the office, at home, or on a business trip, you can edit and view flowcharts anytime, anywhere.
Tips for Making a Flow Chart for Solar Panels Manufacturing
✨Clearly define the main process and branch processes: Draw the main process first, then gradually add branch steps to ensure clear logic.
✨Use standard symbols: Symbols such as rectangles, diamonds, and ellipses should comply with flowchart specifications to avoid confusion.
✨Mark key parameters: Mark technical parameters (such as resistivity, temperature, size, etc.) next to each operation step to improve professionalism.
✨Keep the layout neat: Use alignment tools and connecting lines to ensure that the flowchart is easy to read.
✨Use professional tools: Use online flowchart software Boardmix to improve efficiency and aesthetics.
Boardmix is not only a powerful online whiteboard tool, but also an ideal choice for drawing solar panel manufacturing process diagrams. Whether you need to demonstrate technical details, optimize production processes, or conduct team training, Boardmix can help you complete the task easily. Log in to Boardmix now and start drawing your solar panel manufacturing process map!


