How does water turn into electricity? Understanding the process behind hydroelectric power can be simplified with a flowchart. A hydroelectric flowchart illustrates how energy flows from water reservoirs to the power grid, making renewable energy production accessible for education, project planning, and policy making. In this article, we'll dive into how it works and the tools that make creating these flowcharts easy.
What is Hydroelectric Energy?
Hydroelectric energy harnesses the power of flowing water to generate electricity. As one of the most prominent renewable energy sources, it offers sustainability and reliability. But how does it work? Let’s break it down into its key components.
Key Components of Hydroelectric Energy Production
- Water Source
Rivers, dams, or reservoirs act as the starting point, storing potential energy in elevated water. - Turbines
Flowing water is channeled through penstocks to rotate turbines, converting water’s kinetic energy into mechanical energy. - Generators
Turbines drive generators, which transform mechanical energy into electrical energy through electromagnetic induction. - Transmission Systems
Once electricity is produced, transformers step up the voltage, and transmission lines deliver it to the power grid.
Advantage Drawing of Hydroelectric Energy
A visual representation of hydroelectric energy highlights its advantages, such as:
- Clean Energy: Zero emissions during electricity generation.
- Reliable Output: Consistent energy production, unaffected by weather changes.
- Cost-Effective: After construction, operating costs are relatively low.
The Hydroelectric Flowchart Structure to Show Clarity
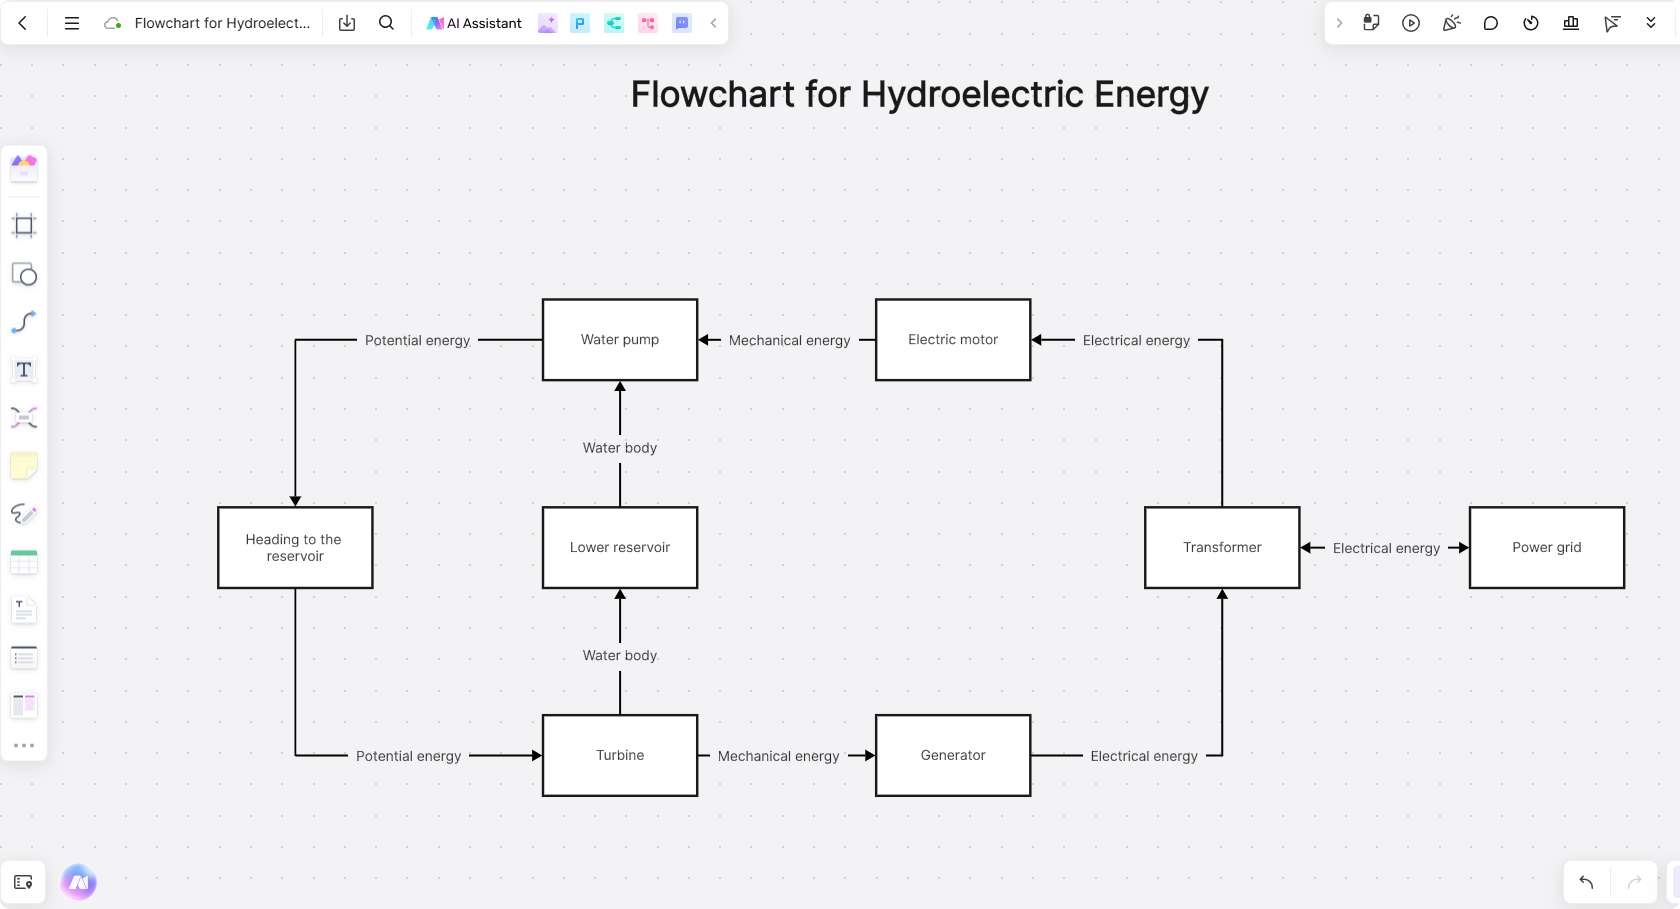
Hydroelectric Flowchart organizes key steps in a logical sequence, enhancing clarity and ensures a better understanding of how electricity is generated from water.
Key Components of a Hydroelectric Flowchart
Simplifying the energy production process, a hydropower flowchart organizes key steps for clarity: Water Reservoir → Penstock → Turbines → Generators → Transformer → Power Grid.
Water Reservoir: The process begins with a reservoir, where water is stored at an elevated height. This represents the potential energy that will eventually be converted into electricity.
Penstock: Water is released through a penstock, a large pipe that channels it toward the turbines. This step highlights the controlled flow of water, ensuring the system operates efficiently.
Turbines: The water’s kinetic energy spins the blades of turbines, converting the energy of motion into mechanical energy.
Generators: Connected to the turbines, generators transform mechanical energy into electrical energy through electromagnetic induction.
Transformer: Electricity from the generator is then passed through a transformer, where voltage is adjusted to meet the requirements of the power grid.
Power Grid: The final step is the delivery of electricity to homes, businesses, and industries via the power grid.
This linear structure provides a clear and comprehensive overview of the hydroelectric process, making it easy to follow for professionals, students, and the general public alike.
Branching Nodes for Additional Insights
To enhance its utility, a hydroelectric flowchart can include branching nodes that provide additional information or explore related systems. Here are some examples:
Environmental Impacts: A branch can depict how hydroelectric plants impact local ecosystems, including fish migration, water quality, and biodiversity.
Water Flow Regulation: Another branch can show how dams manage water flow for flood control, irrigation, or recreational purposes, alongside energy production.
Backup Systems: Highlighting backup power systems or auxiliary generators ensures the flowchart covers contingency measures for system failures.
The flowchart becomes a versatile tool, offering deeper insights beyond just energy production.
Tools to Create a Hydroelectric Energy Flowchart
Creating a hydroelectric energy flowchart doesn’t have to be overwhelming. With the right tools, you can visualize the entire process clearly and collaboratively. Let’s explore why Boardmix is the perfect choice for this task.
Why Use Boardmix?
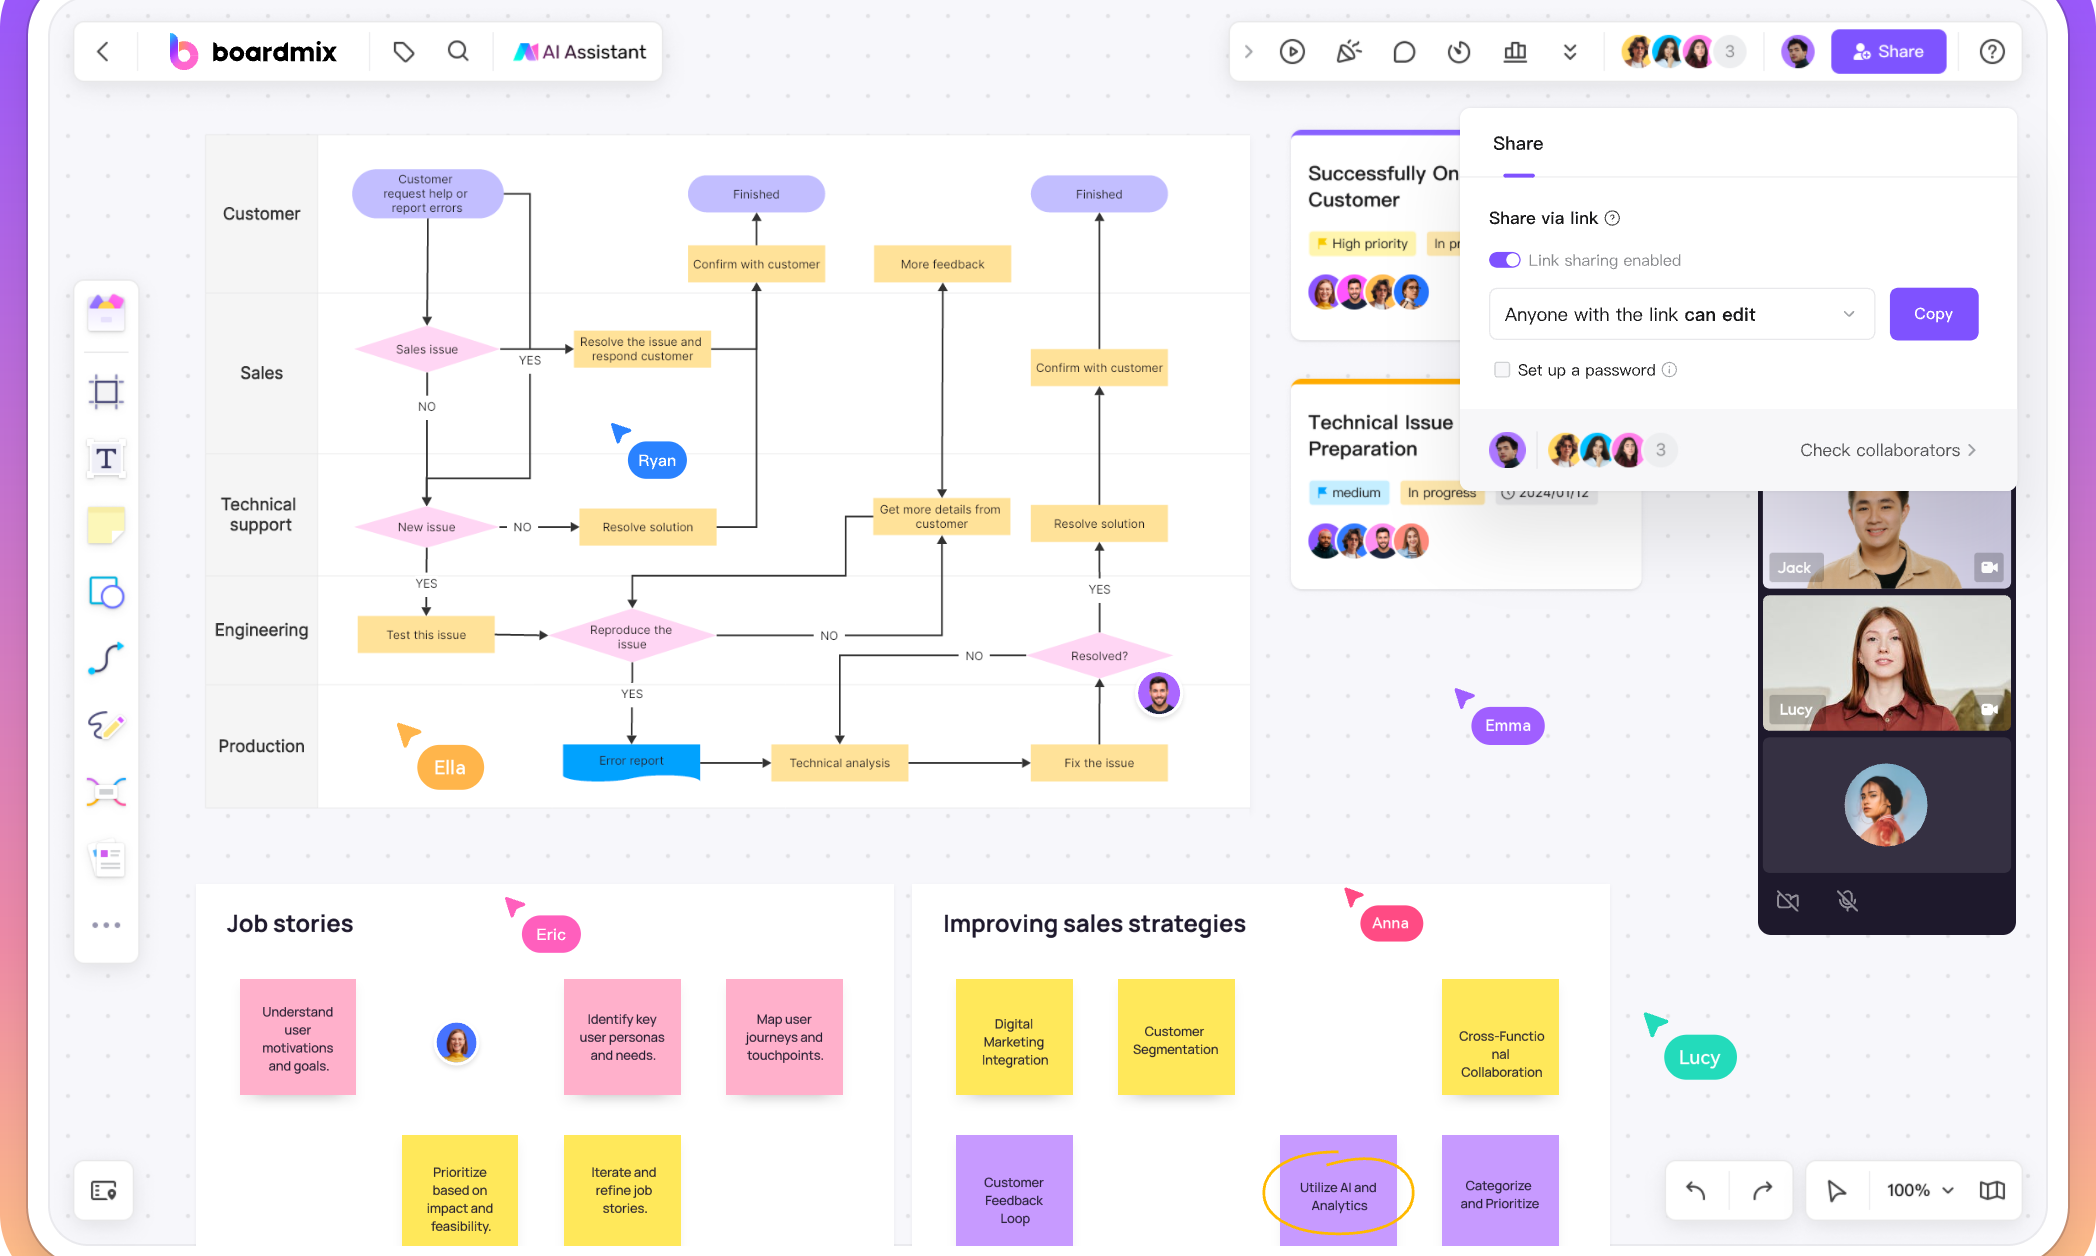
Boardmix is a versatile online whiteboard for creating energy system diagrams with ease. It combines intuitive tools with advanced features for crafting clear, professional flowcharts.
- Custom Templates: Jumpstart your project with professionally designed templates for energy systems. These save you the hassle of building diagrams from scratch.
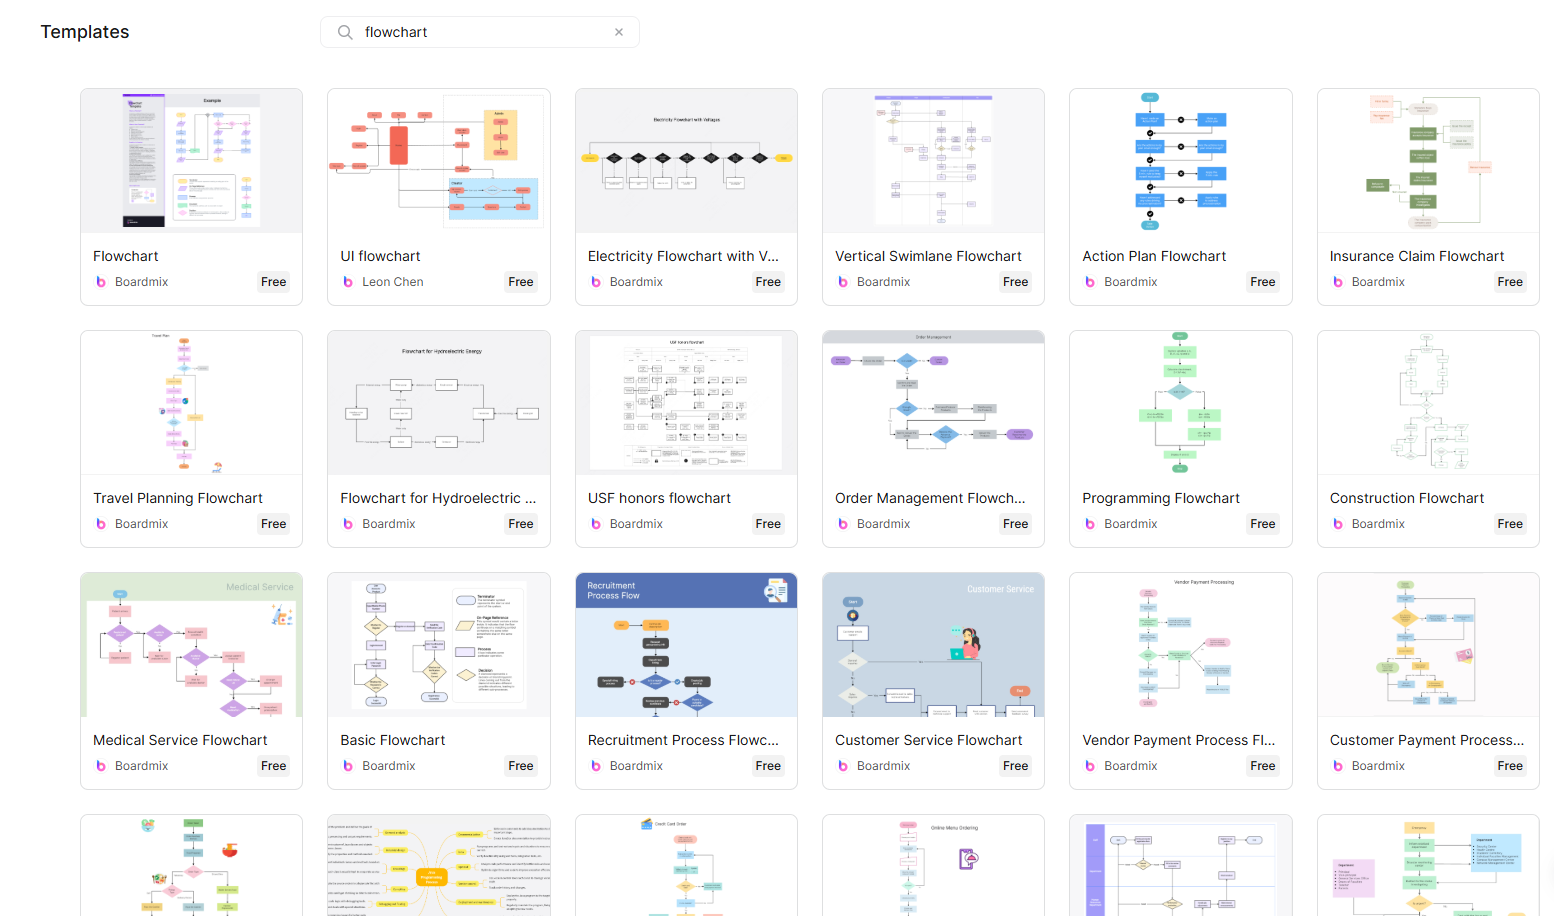
- AI-Powered Support: Imagine having an assistant that suggests layout improvements or helps you organize your ideas seamlessly. That’s what Boardmix’s AI can do for you.

- Real-Time Collaboration: Whether it’s a classroom project or a team of 500+ professionals working remotely, Boardmix makes group collaboration effortless and instant.
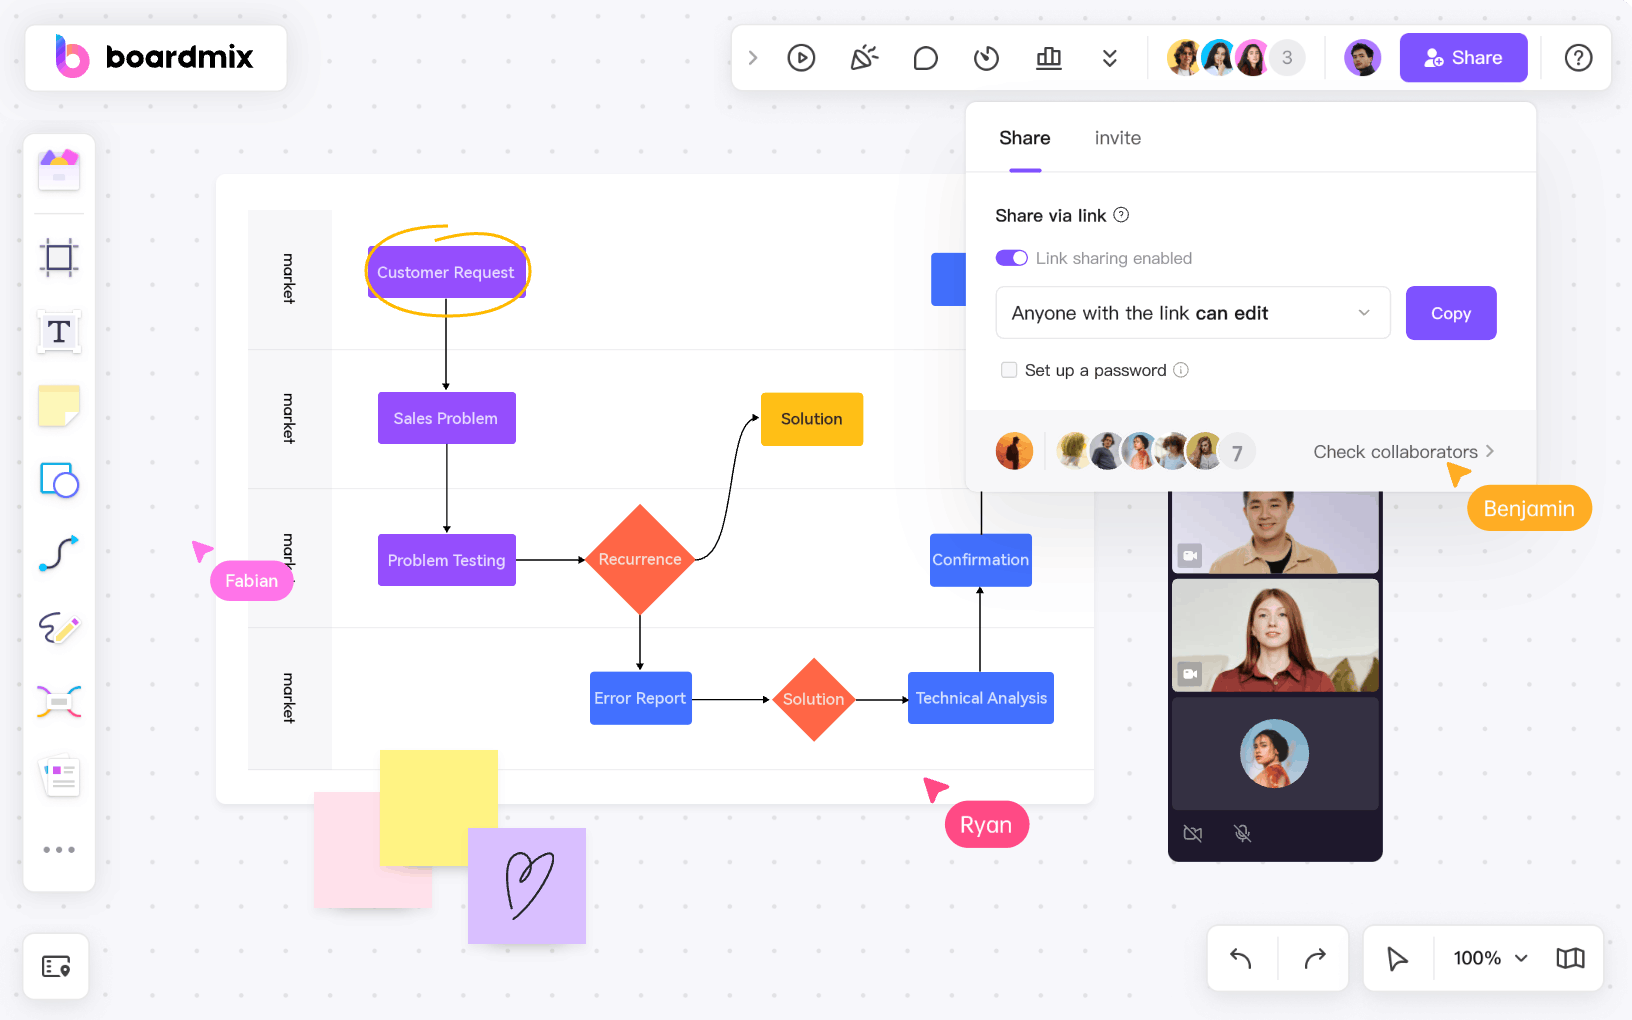
- Unlimited Canvas: No need to worry about space limitations—map out even the most complex systems on an infinite canvas.
- Built-In Online Drawing Tools: Create highly customized diagrams with precision using Boardmix’s intuitive drawing tools.
- Seamless Integration with Zoom: You can host live discussions or presentations while working on your diagram directly inside Zoom.
- Free Template Library: Access a wide variety of templates for energy, business, education, and more without any extra cost.

With these features, Boardmix transforms diagram creation into a smooth, interactive experience for individuals and teams alike.
Steps to Create a Hydroelectric Flowchart on Boardmix
Building a hydroelectric energy flowchart with Boardmix is simple and user-friendly. Here’s a step-by-step guide to get you started.
Steps 1. Sign In to Boardmix
Begin by logging into your Boardmix account. If you don’t have one, signing up is quick and free.

Steps 2. Choose a Template
Select from the library of energy flowchart templates designed to help you get started faster. You can also opt to create a diagram from scratch if you prefer a custom layout.
Steps 3. Add Nodes for Key Steps
Identify the critical components of the hydroelectric system, such as water sources, turbines, and generators. Add these as nodes on your diagram to represent each step.
Steps 4. Customize Labels
Make your flowchart clear and informative. Add descriptive labels for each node to explain their roles in the energy generation process.
Steps 5. Incorporate Visuals
Enhance your flowchart with relevant visuals like icons, images, or even hand-drawn elements. This makes your diagram more engaging and easier to understand.
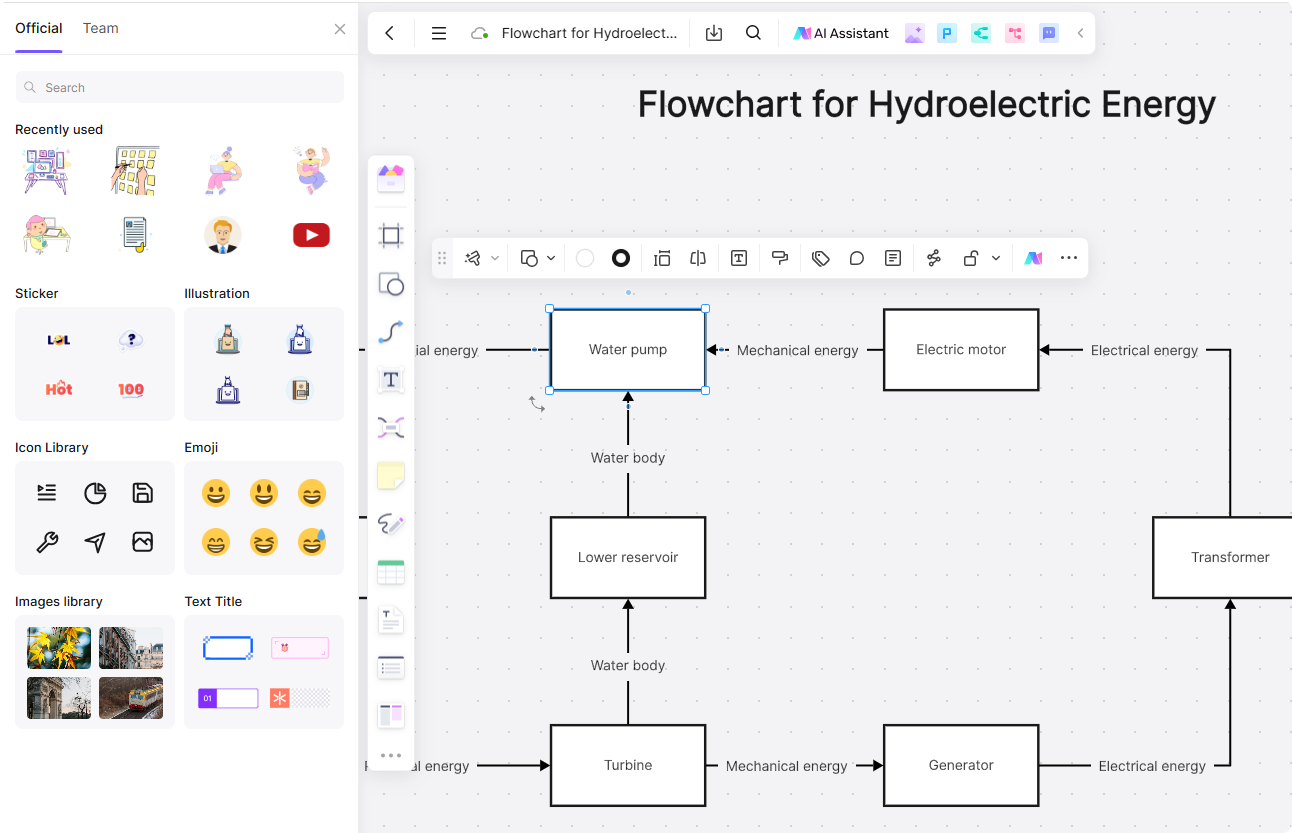
Steps 6. Collaborate and Finalize
Invite colleagues, classmates, or team members to review your work in real time. Boardmix allows you to collaborate with over 500 people simultaneously, ensuring everyone can contribute and provide feedback. Once finalized, export your flowchart and share it with your audience.
By using Boardmix, you’re not just creating a flowchart—you’re building a clear, collaborative, and visually compelling representation of your ideas. Try it today and see how it simplifies your work!
How Are Hydroelectric Flowcharts Used in Industries?
Hydroelectric flowcharts serve a wide range of purposes across various industries and user groups. From education to policy-making, these diagrams help simplify complex systems, streamline processes, and foster collaboration. Let’s explore how different people and industries use hydroelectric energy flowcharts in their unique contexts.
Education: Simplifying Complex Concepts for Students and Teachers
In classrooms, hydroelectric flowcharts bridge the gap between theory and practice.
For Teachers: Imagine trying to explain the intricate process of converting water flow into electricity. A visual flowchart can break this down into simple, digestible steps, making it easier for students to grasp fundamental concepts about renewable energy.
For Students: Students can use flowcharts to create projects, explain renewable energy systems in presentations, or analyze the pros and cons of hydroelectric power generation. For instance, a science fair project might include a detailed flowchart showcasing a miniature hydroelectric setup.
Case Example: A high school environmental science class uses a hydroelectric flowchart to compare energy outputs from different renewable sources, sparking discussions about sustainability.
Project Planning: Streamlining Workflows for Professionals
Energy professionals rely on hydroelectric flowcharts to map complex processes and ensure project efficiency.
For Engineers and Project Managers: Flowcharts help map out workflows, from identifying potential water sources to designing turbines and generators. They also make it easier to allocate resources and plan for contingencies.
For Energy Companies: During the development of a hydroelectric plant, energy companies can use flowcharts to visualize the construction timeline, equipment maintenance schedules, and operational workflows.
Case Example: A renewable energy company uses a hydroelectric flowchart to coordinate between engineers, contractors, and regulators during the construction of a new dam, ensuring transparency and efficiency.
Policy Making: Evaluating Renewable Energy Strategies
Government agencies and policymakers turn to hydroelectric flowcharts for data-driven decision-making.
For Policymakers: Flowcharts can help evaluate the efficiency of existing hydroelectric plants, assess their environmental impact, and identify areas for improvement. These diagrams also enable better communication of complex energy policies to the public.
For Environmental Analysts: Analysts use flowcharts to showcase the environmental trade-offs of hydroelectric projects, such as their impact on aquatic ecosystems or greenhouse gas emissions.
Case Example: A government task force creates a flowchart to evaluate the potential environmental benefits and risks of building a hydroelectric dam across a major river, including its effects on nearby communities.
Business and Financial Analysis: Supporting Investment Decisions
Flowcharts make it easier for businesses and investors to evaluate the viability of hydroelectric projects.
For Business Strategists: Energy companies can use flowcharts to pitch the financial and operational feasibility of hydroelectric projects to stakeholders, breaking down costs, revenues, and timelines in a clear and concise way.
For Investors: Visualizing the flow of energy production and the associated costs helps investors assess the risks and rewards of funding renewable energy projects.
Case Example: A clean energy startup presents a hydroelectric energy flowchart to potential investors to illustrate how their innovative turbine design boosts energy efficiency while reducing construction costs.
Environmental Advocacy: Raising Awareness Through Visuals
Environmental organizations use hydroelectric flowcharts to educate the public and advocate for sustainable energy solutions.
For Advocacy Groups: Flowcharts can simplify the science behind hydroelectric energy, making it accessible to non-experts. They can also highlight the benefits and challenges of adopting hydroelectric power.
For Community Outreach: During town hall meetings or environmental campaigns, flowcharts can be used to showcase the positive impact of hydroelectric projects on reducing carbon emissions.
Case Example: An environmental NGO uses a hydroelectric flowchart in a public awareness campaign to show how transitioning from coal to hydroelectric power can significantly lower carbon footprints.
Research and Development: Innovating for the Future
Researchers and innovators use hydroelectric flowcharts to model new technologies and improve energy systems.
For Scientists: Researchers rely on flowcharts to experiment with new turbine designs, optimize water usage, or integrate AI-driven monitoring systems into hydroelectric plants.
For Innovators: Startups working on smart energy solutions can use flowcharts to map out how AI and IoT technologies can enhance hydroelectric power generation.
Case Example: A research team uses a hydroelectric flowchart to model how AI algorithms can predict maintenance needs for turbines, reducing downtime and maximizing energy output.
Hydroelectric flowcharts help people visualize complex systems, identify opportunities for optimization, and communicate ideas effectively. By tailoring hydroelectric flowcharts to specific needs, professionals and organizations across industries can make better decisions, foster collaboration, and drive innovation in renewable energy.
Conclusion
Flowcharts are invaluable tools for simplifying complex processes like hydroelectric energy production. By breaking down each step visually, they provide clarity for education, project planning, and policymaking. Using Boardmix, anyone can create detailed and accurate diagrams that enhance understanding and communication. Start designing your hydropower flowchart today and make energy concepts accessible for all!


