How can you make sense of the complex relationships between domains and kingdoms in biology? Creating a flowchart to show the relationship between domains and kingdoms offers a clear and visual way to organize these classifications. From prokaryotic organisms to eukaryotic kingdoms, flowcharts simplify learning. In this guide, explore practical steps and discover how Boardmix can help you create detailed, professional diagrams with ease.
What Are the Domains and Kingdoms?
Understanding the classification of life forms is crucial in biology. By visualizing the relationship between domains and kingdoms, learners can grasp how organisms are categorized based on shared traits and evolutionary history. This hierarchical system begins with three broad domains and narrows into detailed kingdoms, offering insights into life’s diversity and complexity.
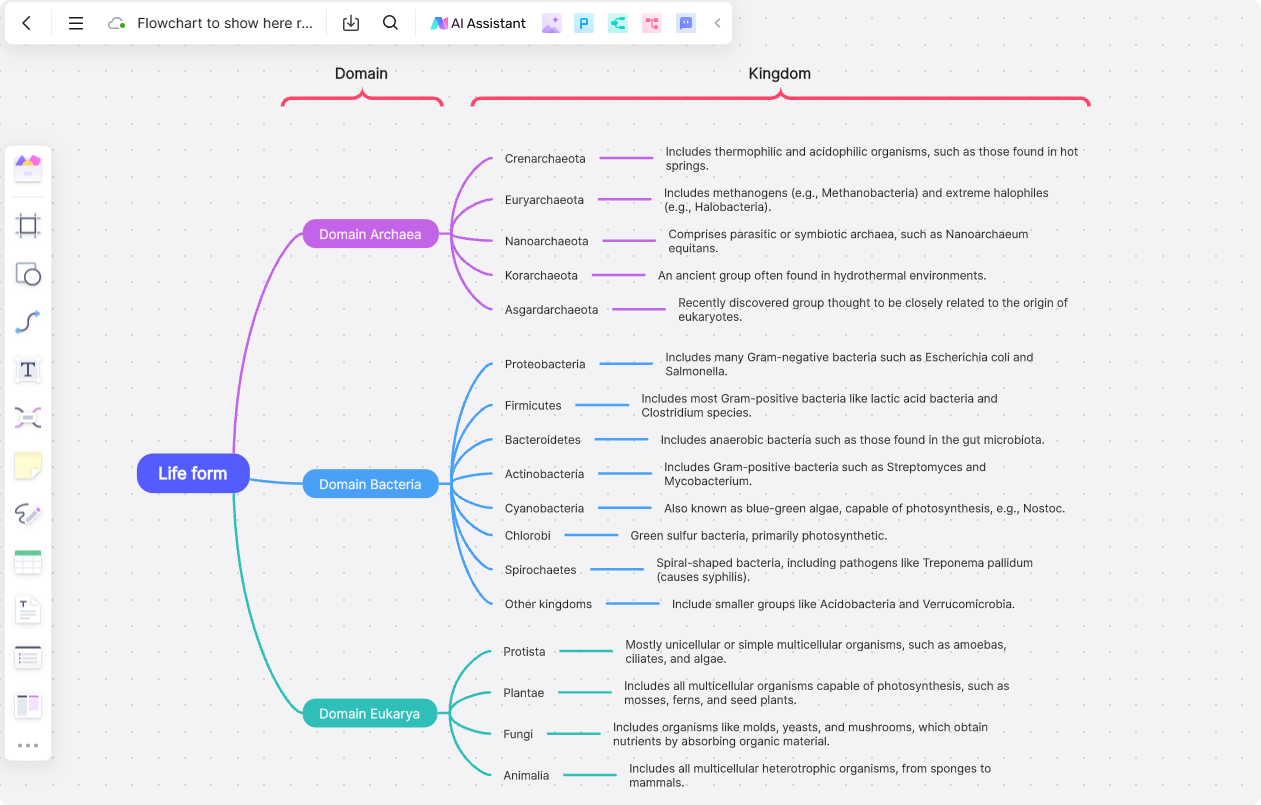
The Three Domains of Life
The domains are the highest classification level, encompassing all living organisms.
- Bacteria: Prokaryotic organisms characterized by a lack of a membrane-bound nucleus. They inhabit diverse environments, from soil to the human gut, playing vital roles in ecosystems.
- Archaea: Another group of prokaryotes, archaea have unique biochemical properties. They are often found in extreme environments like hot springs and deep-sea hydrothermal vents.
- Eukarya: Comprising organisms with complex, membrane-bound cellular structures, this domain includes plants, animals, fungi, and protists.
Kingdoms Within the Eukarya Domain
The Eukarya domain is further divided into kingdoms based on specific traits.
- Protista: This kingdom includes single-celled organisms and some simple multicellular forms like algae. They exhibit diverse modes of nutrition, such as photosynthesis and ingestion.
- Fungi: Known as decomposers, fungi recycle nutrients by breaking down organic matter. Mushrooms and molds are notable members.
- Plantae: Plants are autotrophs that convert sunlight into energy, forming the foundation of most ecosystems. Examples include trees, grasses, and flowers.
- Animalia: Animals are heterotrophs, meaning they consume other organisms for energy. This kingdom showcases biodiversity ranging from insects to mammals.
A Flowchart to Show the Relationship Between Domains and Kingdoms
Visual tools like flowcharts simplify complex biological concepts by presenting them in a structured and interactive manner. In a flowchart showing the relationship between domains and kingdoms, each domain (Bacteria, Archaea, and Eukarya) is represented as a main node. Sub-nodes depict their respective characteristics or kingdoms, providing a clear visual hierarchy.
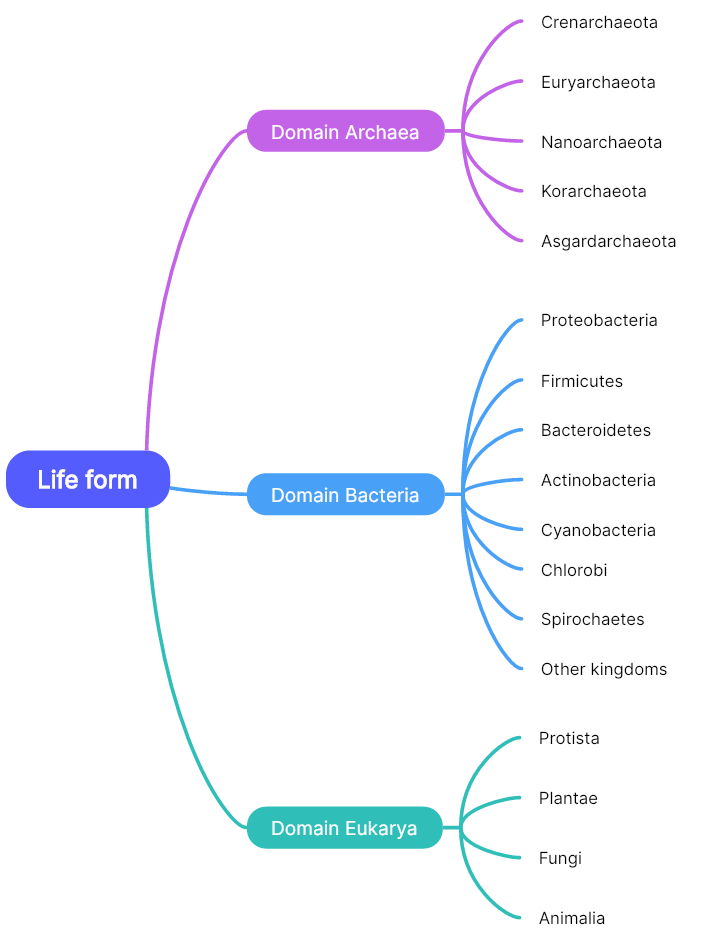
For example:
- Start Node: Life forms.
- Branches: Three domains (Bacteria, Archaea, Eukarya).
- Further Nodes: Sub-categories such as Protista, Fungi, Plantae, and Animalia under Eukarya.
This approach makes it easier to follow the evolutionary links and shared characteristics across groups.
Creating a Flowchart to Visualize Relationships Between Domains and Kingdoms
Understanding the connection between domains and kingdoms can seem challenging. With the right tools and techniques, you can create clear, engaging flowcharts that simplify complex biological classifications.
Choose the Right Tool to Design the Flowchart
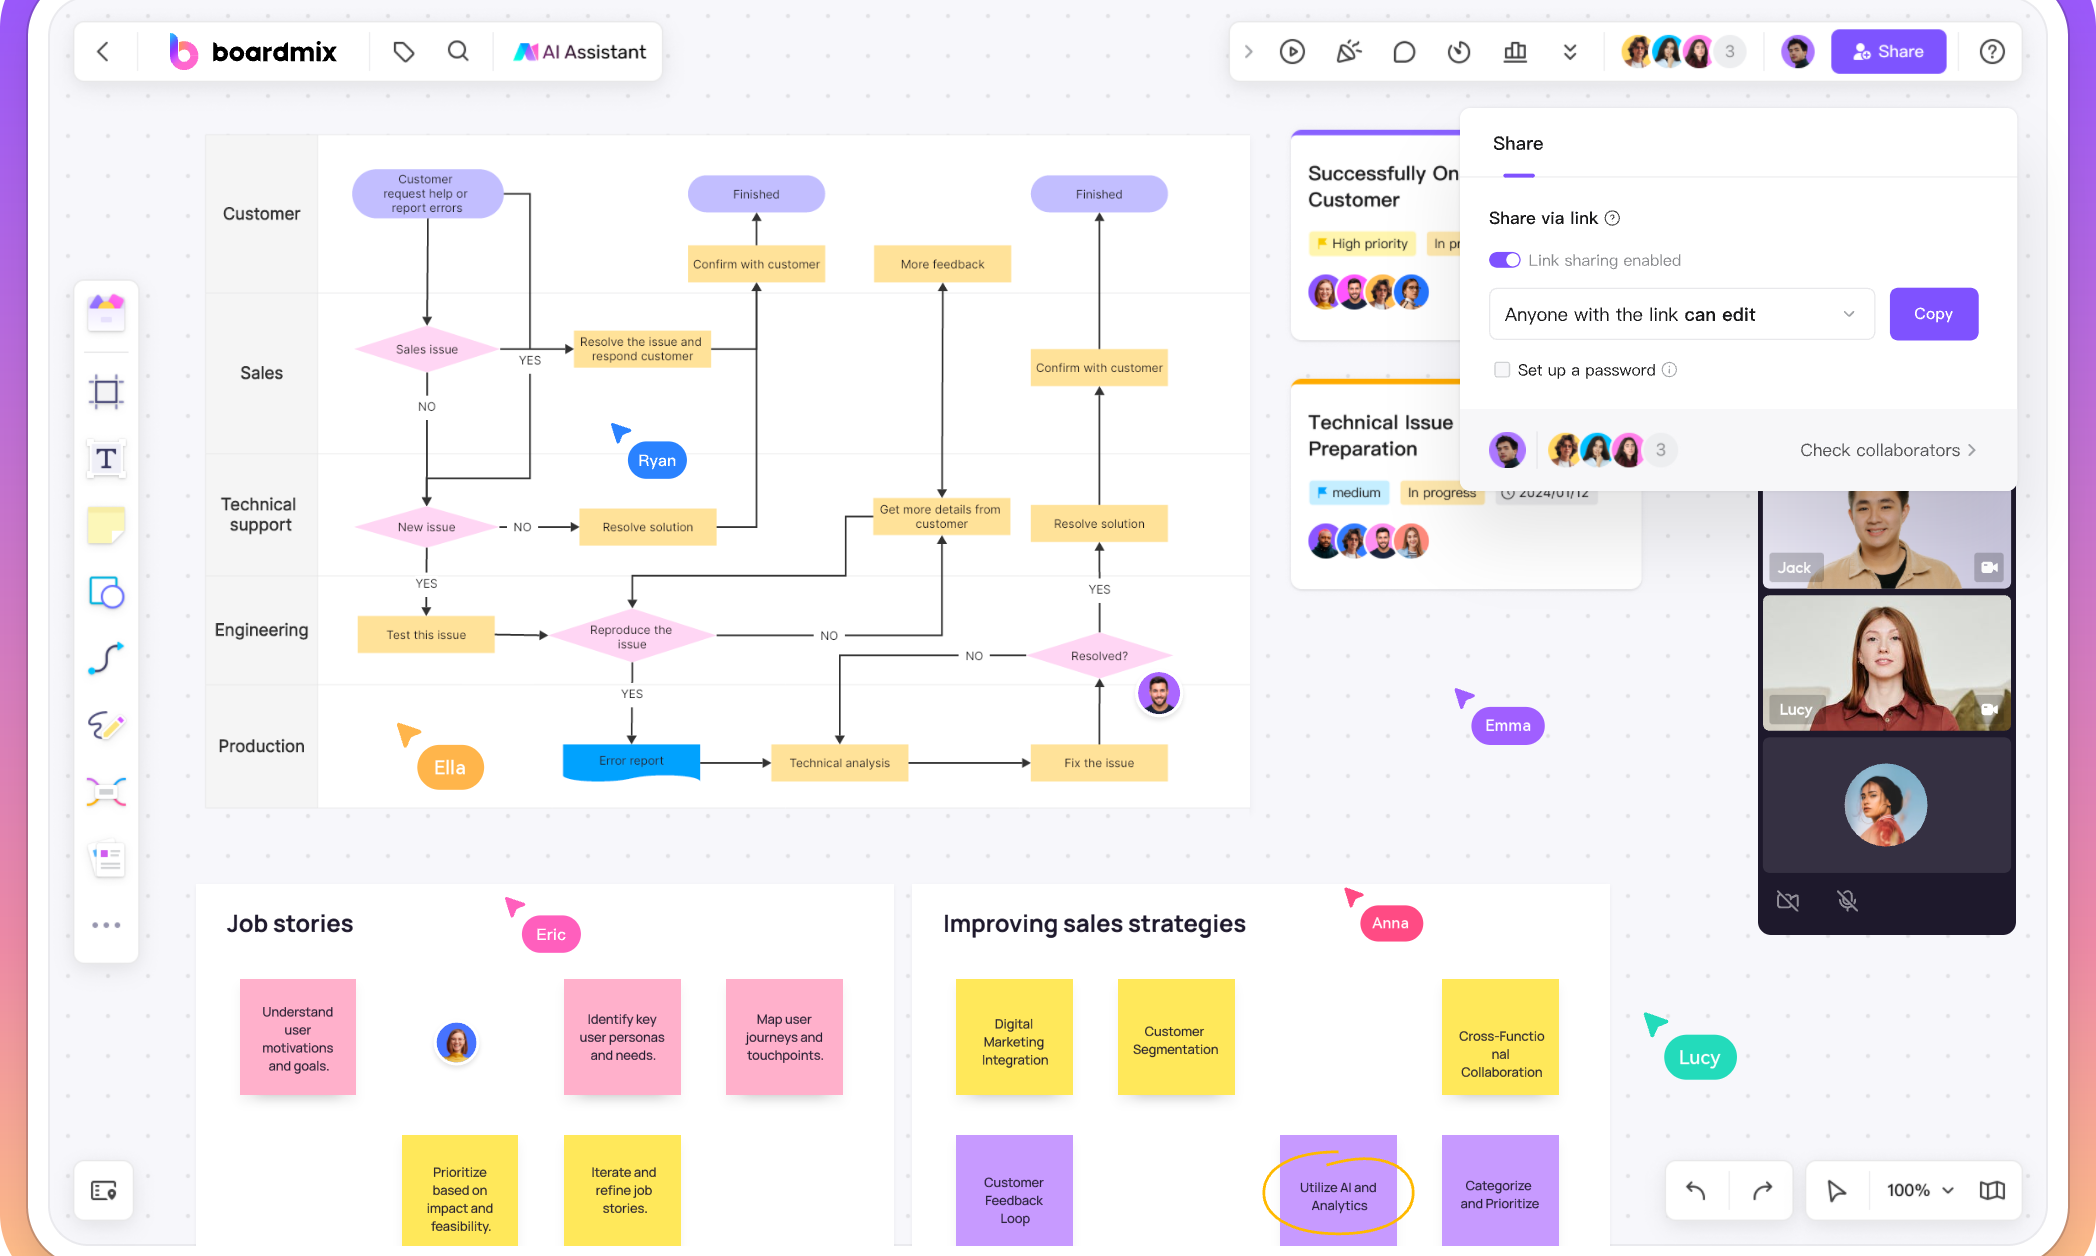
A right platform makes all the difference when visualizing biological relationships. Boardmix is an excellent online platform for creating detailed and professional flowcharts. Its user-friendly interface and advanced features make it ideal for visualizing complex biological relationships. Also, Boardmix offers a seamless experience for designing professional flowcharts.
- Customizable Templates: Access a library of free templates specifically designed for biology-related projects, saving time on setup.

- Real-Time Collaboration: Work simultaneously with over 500 participants, making it ideal for group assignments or team projects.

- Interactive Elements: Enhance your diagrams with icons, colors, links, and annotations for a more dynamic presentation.
- Infinite Canvas: Create expansive diagrams without limitations, perfect for showcasing intricate relationships like domains and kingdoms.
- AI-Powered Assistance: Let AI suggest optimizations or auto-complete certain elements to streamline your workflow.

- Cross-Platform Compatibility: Access and edit your diagrams on desktops, tablets, or smartphones—anytime, anywhere.
- Integrated Meeting Tools: Collaborate efficiently by integrating Zoom, Microsoft Teams, or Google Meet directly within the platform.

Follow these Steps to Design the Flowchart
Mapping out domains and kingdoms might sound complex, but breaking it down step by step makes the process much more approachable. Here’s how you can create an effective flowchart with Boardmix.
Step 1. Sign In
Log into your Boardmix account from any device to begin. The platform’s intuitive interface ensures a smooth start for beginners and experts alike.

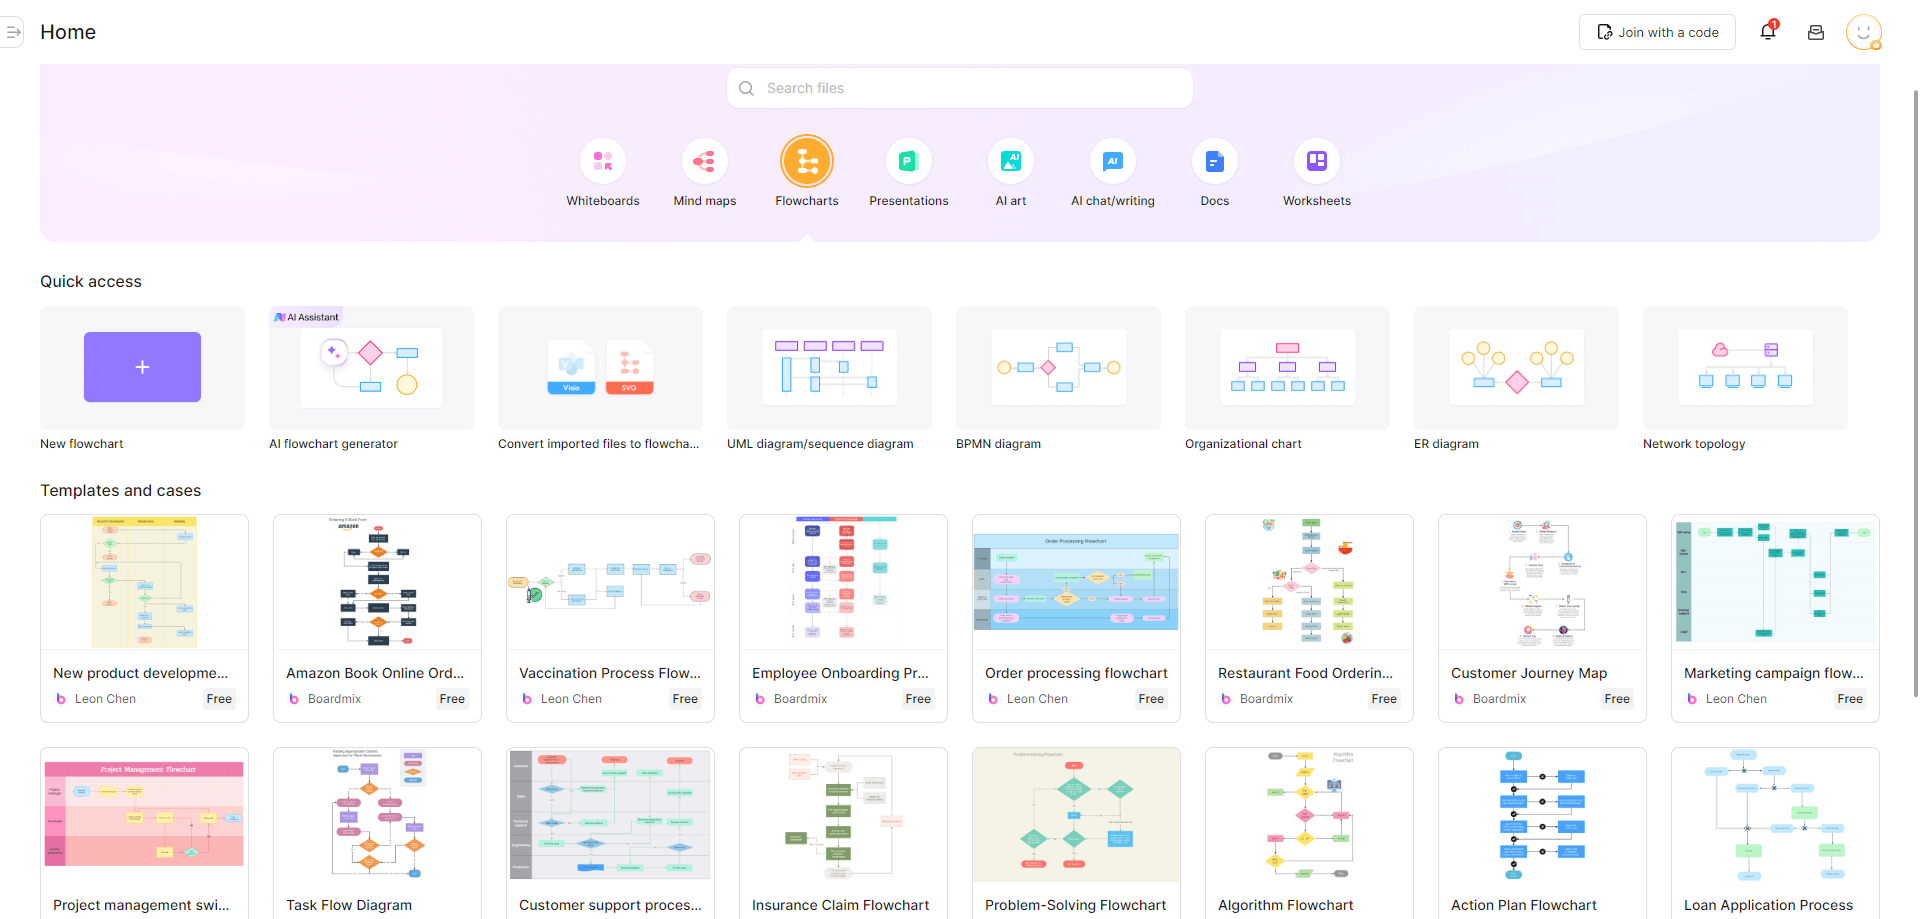
Step 2. Select Templates
Choose from pre-designed biology templates, or start from a blank canvas if you prefer complete customization. Templates provide a strong foundation to organize your ideas.
Step 3. Add Nodes
Represent the three domains—Bacteria, Archaea, and Eukarya—as your main nodes. Expand with sub-nodes for the kingdoms within Eukarya.
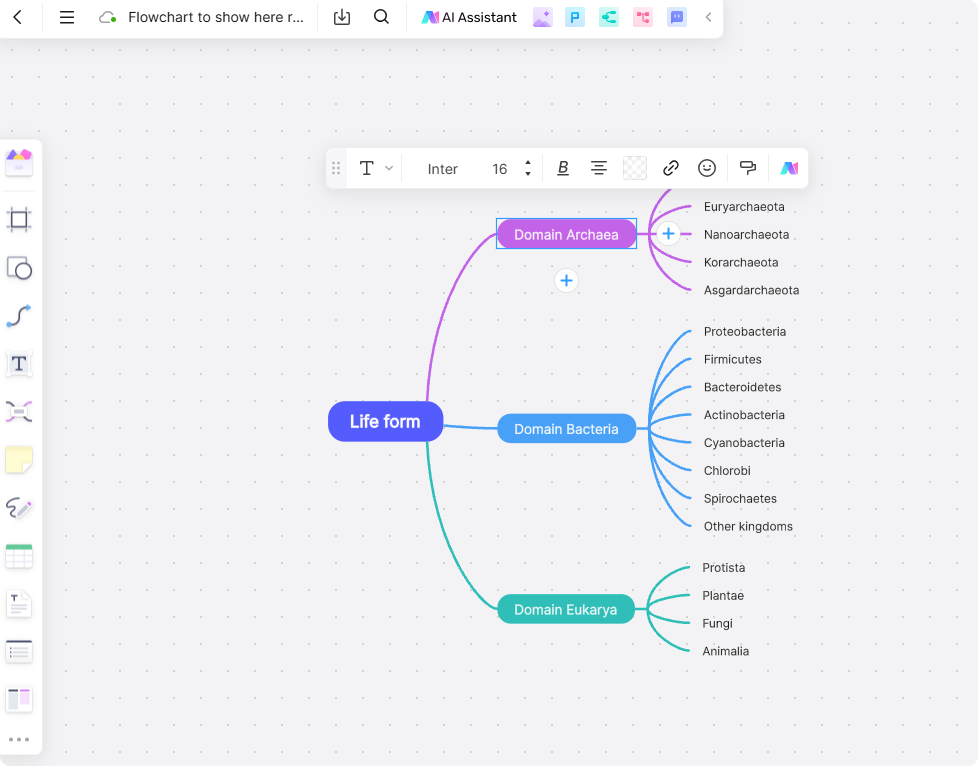
Step 4. Customize Labels
Clearly name each node with concise yet descriptive labels, such as "Protista" or "Fungi," to improve readability and comprehension.
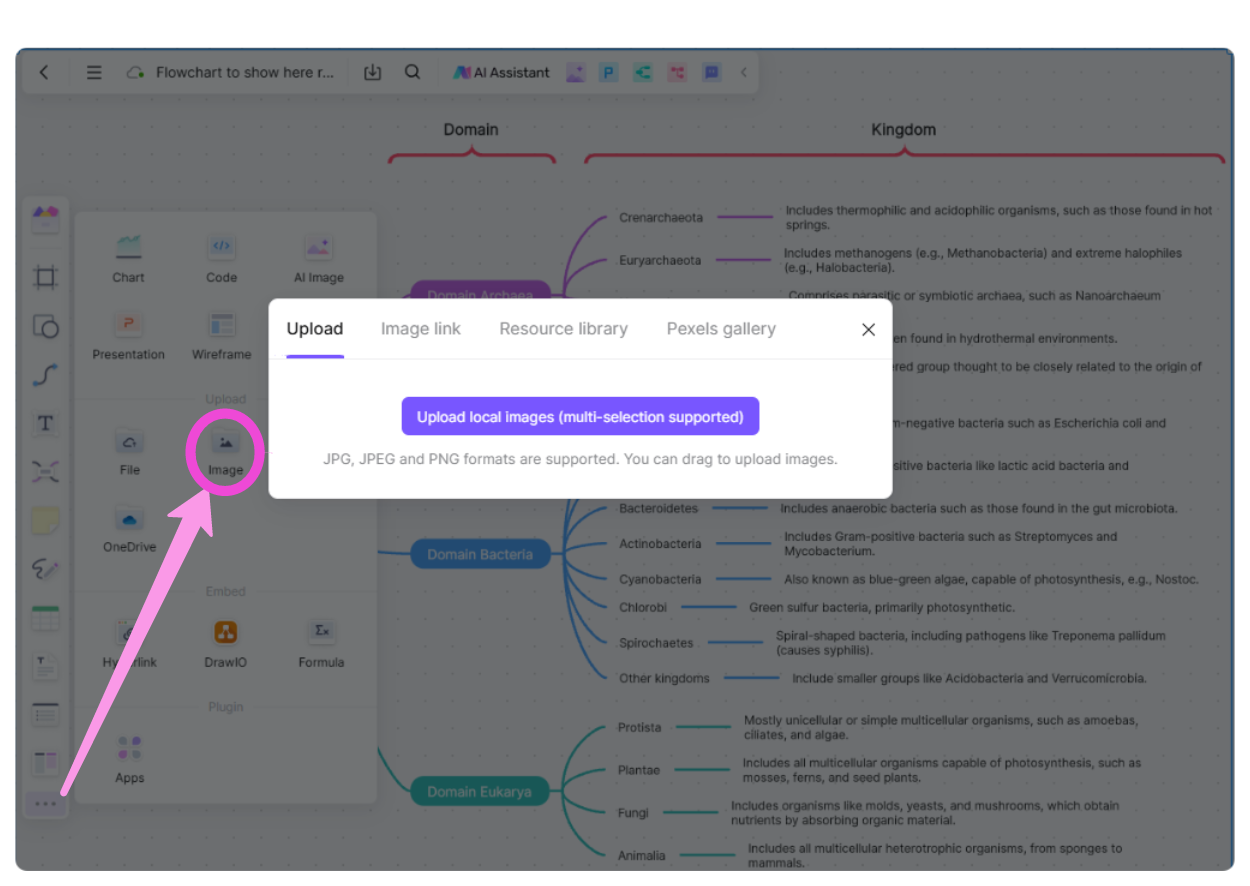
Step 5. Add Images
Include visuals like organism pictures or habitat illustrations to make your chart more engaging and informative. This enhances both aesthetic appeal and understanding.
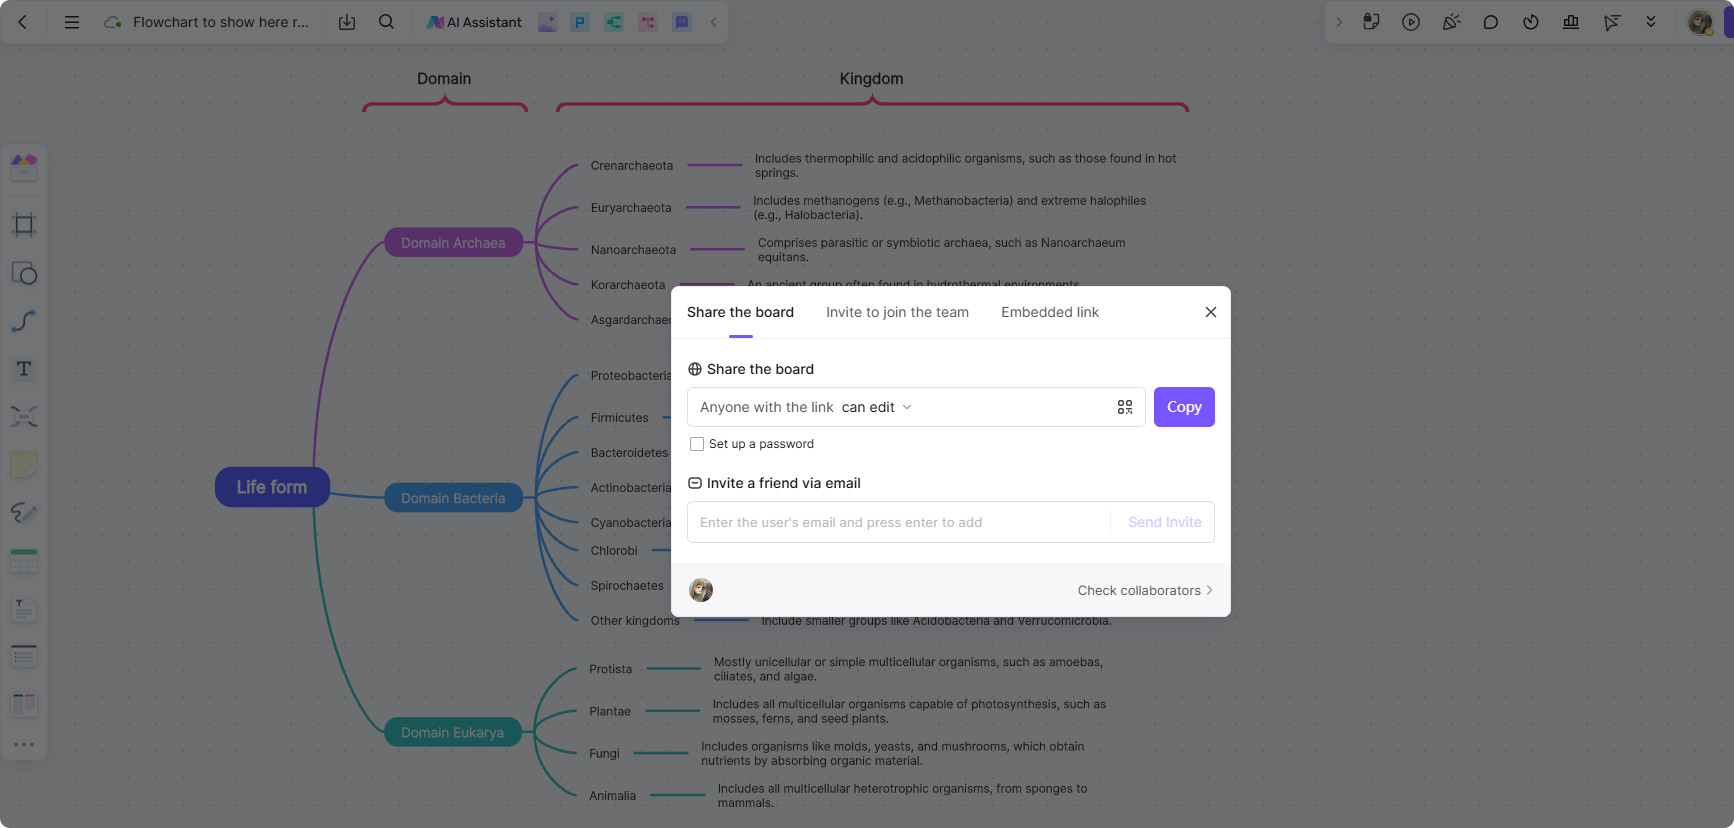
Step 6. Collaborate Online
Share your work with classmates, educators, or colleagues. Boardmix’s real-time collaboration ensures everyone can contribute without delays.
Step 7. Update Regularly
Modify your flowchart as new insights arise. The infinite canvas and autosave feature make ongoing revisions effortless.
Tips and Tricks for Showing the Relationship Between Domains and Kingdoms
Crafting an effective flowchart is all about organization and clarity. Use these practical tips to make your diagram stand out.
- Use Consistent Colors
Assign a unique color to each domain and its kingdoms for quick differentiation. For example, green for Plantae and blue for Protista. - Simplify Connections
Avoid overcrowding your diagram by focusing on major relationships. This ensures that viewers can follow the flowchart easily. - Incorporate Visuals
Add organism images, such as algae for Protista or mushrooms for Fungi, to give life to your flowchart and improve retention. - Organize Hierarchically
Structure your diagram from top to bottom or left to right, with domains at the top and kingdoms branching below. This hierarchy mirrors biological classifications. - Add Descriptive Annotations
Provide brief explanations for key nodes, such as “Eukarya includes multicellular organisms,” to give more context.
When you follow these steps and suggestions, you'll see how easy it is to design a clear and engaging flowchart. With Boardmix by your side, understanding even the most detailed biological concepts becomes a breeze.
Conclusion
Visualizing biological classifications like domains and kingdoms enhances understanding and retention. A well-crafted flowchart simplifies these intricate relationships, making it an invaluable educational tool. Using Boardmix, students and educators can create dynamic and engaging flowcharts tailored to their needs. Start your journey in biology today with professional, easy-to-use tools that bring concepts to life!


