Line charts are an essential and versatile tool in the arsenal of any data scientist, business analyst, or professional who relies on data visualization to make informed decisions. A line chart creator simplifies this process, allowing you to quickly input data, customize visuals, and generate clear, professional charts. Perfect for presentations, reports, or personal projects, it ensures your data is easy to understand and impactful.
In this article, we'll delve into the world of line charts and tools to create line charts, exploring their importance, how they're created, and how they can help you extract hidden patterns and trends in your data.
What is a Line Chart?
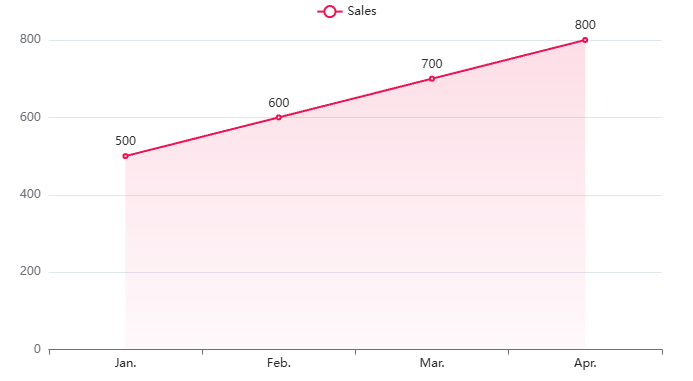
A line chart, also known as a line graph, is a graphical representation that displays information as a series of data points called 'markers' connected by straight line segments. It is primarily used to visualize the trend of data over time, also known as a 'time series.'
The beauty of line charts lies in their simplicity and effectiveness. With a quick glance, you can understand the general direction of your data, whether it's upward, downward, or stable. Plus, line charts make it possible to identify patterns and trends that may not be immediately apparent in raw data.
When to Use a Line Chart
Using a line chart is ideal when you're looking to visualize changes over time. This is especially useful in trend analysis and projections, as line charts can clearly show the increase or decrease in values over a given period.
Additionally, line charts are effective for comparing multiple sets of data. For example, if you want to compare the annual sales of different products or the growth rates of multiple companies, a line chart can provide a clear and easy-to-understand visual representation.
In summary, you should consider using a line chart when you need to:
- Visualize trends over time.
- Compare multiple sets of data.
- Identify patterns or trends in your data.
- Make future projections based on historical data.
However, it's also important to remember that not all situations are suitable for a line chart. If the data is categorical or if there is no clear relationship between variables, other types of charts may be more appropriate.
Types of Line Charts
There are several types of line charts, each with its own characteristics and uses. Here are some of the most common ones:
Simple Line Chart
This is the most basic type of line chart, which shows a single line drawn through the chart to represent a single set of data. It is useful for visualizing trends over time.
Multiple Line Chart
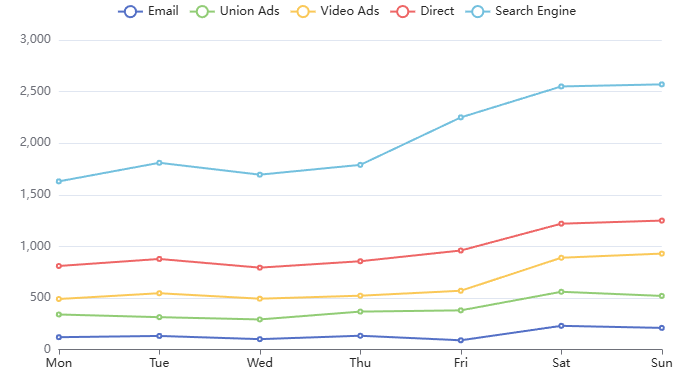
This type of chart shows multiple lines, each representing a different set of data. It is useful for comparing multiple sets of data on the same chart.
Stacked Line Chart
In this type of chart, lines are stacked on top of each other, allowing you to visualize the total contribution of each set of data to the overall total.
Line Chart with Markers
This type of chart uses markers to highlight specific points along the line.
Pros and Cons of Line Charts
Line charts, like all data visualization tools, have their advantages and disadvantages.
Pros of Line Charts
- Clarity: Line charts are great for showing clear trends over time. They allow the viewer to quickly see whether values are increasing, decreasing, or staying stable.
- Comparison: They are effective for comparing multiple sets of data on the same chart. This can be helpful for seeing how different variables or categories compare to each other.
- Prediction: Line charts can help identify patterns and trends that can be useful for making future projections.
Cons of Line Charts
- Lack of Accuracy: Although line charts are good for showing general trends, they may not be as accurate when it comes to specific details. For example, if values fluctuate a lot, a line chart may not capture all the variations.
- Not Suitable for All Data Types: Line charts are ideal for continuous and quantitative data. However, they are not as effective for categorical or qualitative data.
- They can be misleading: If not used correctly, line charts can give the wrong impression. For example, if the Y axis does not start at zero, it can make differences appear larger than they really are.
In general, it is important to choose the right type of graph based on the type of data you are dealing with and the story you want to tell with that data.
How to Make a Graph Line Chart?
Creating a line graph is a fairly simple and straightforward process, and can be done using a number of tools, from spreadsheet software like Excel to online tools like Boardmix.
Basic Steps of Creating Line Charts
If you want to create a line chart, here are the basic steps you can follow.
- Collect your data: The first step in creating any graph is to have the data you want to visualize. This data should be organized in such a way that it has one independent variable (usually time) and one or more dependent variables.
- Choose your tool: Depending on your needs and skills, you can choose from a number of tools to create your line graph. Excel is a popular and easy-to-use choice for basic graph creation. If you need more control over your visualizations, you might consider using a collaborative tool like Boardmix.
- Create the graph: In Excel, you can create a line graph by selecting your data and then choosing the “Insert Line Graph” option. In Boardmix, you can use the chart feature to create line charts.
- Customize your graph: Once you have created your graph, you can customize it to fit your needs. This can include adding a title, axis labels, a legend, etc.
- Interpret your chart: Finally, after you create and customize your chart, you need to be able to interpret it correctly. Make sure you understand what the chart is showing and how it relates to your data.
Step Guide: How to Create a Line Chart in Excel
Creating a line chart in Excel is simple for visualizing data trends. Follow these steps for a clear chart.
- Prepare Your Data
Ensure your data is organized in a table format. Place the categories (e.g., dates or months) in the first column and the corresponding values in the adjacent columns. For example:
| Month | Sales |
| January | 500 |
| February | 600 |
| March | 700 |
This format ensures Excel can correctly interpret and plot the data.
- Select the Data
Highlight the data you want to include in your line chart. Include both the categories (e.g., months) and the values (e.g., sales). This ensures all necessary information appears in your chart.
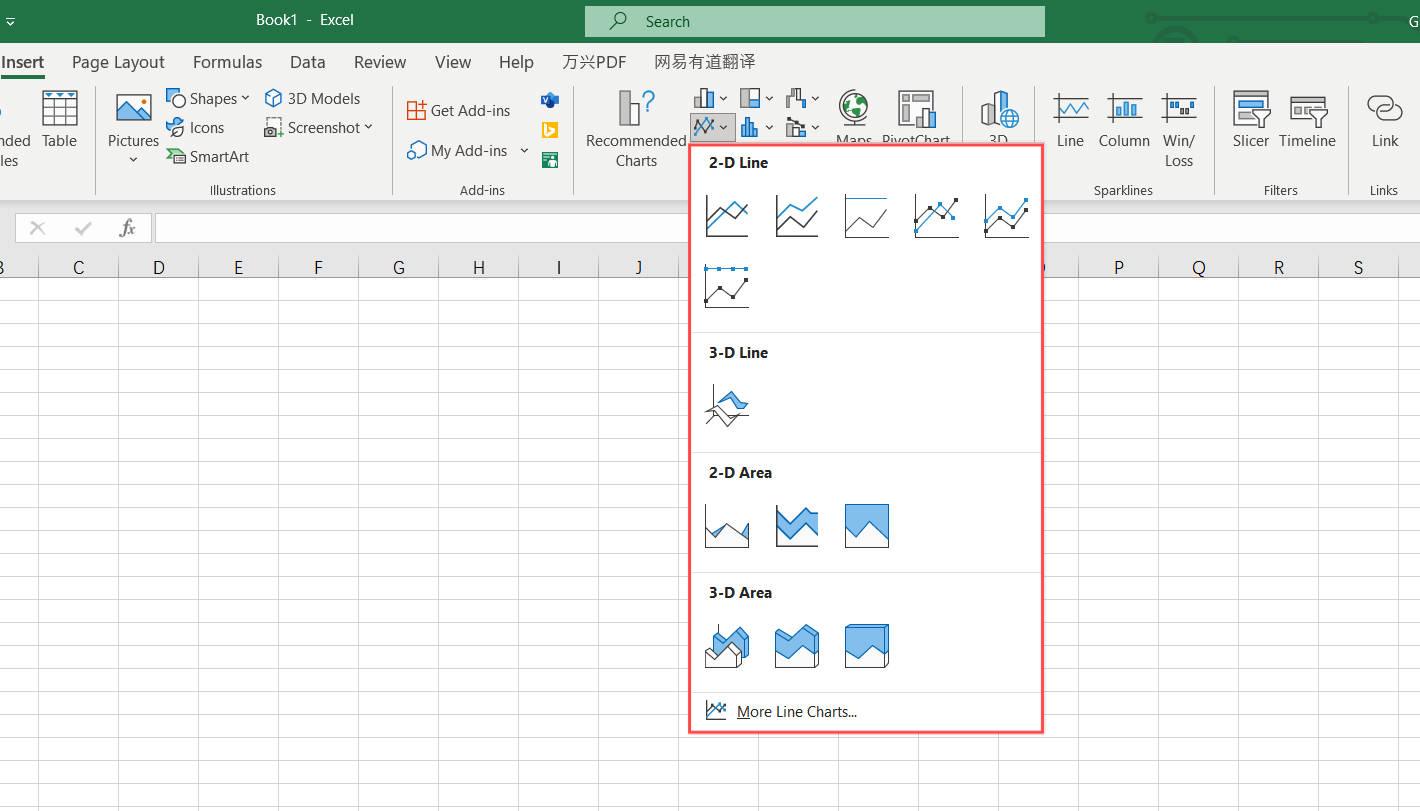
- Insert the Line Chart
- Navigate to the Insert tab in the Excel ribbon.
- In the Charts section, click the Line Chart
- Choose a line chart style (e.g., simple line, line with markers).
Excel will generate a chart based on your selected data and style.
- Customize the Chart
Once your chart appears, you can customize it for clarity and visual appeal:
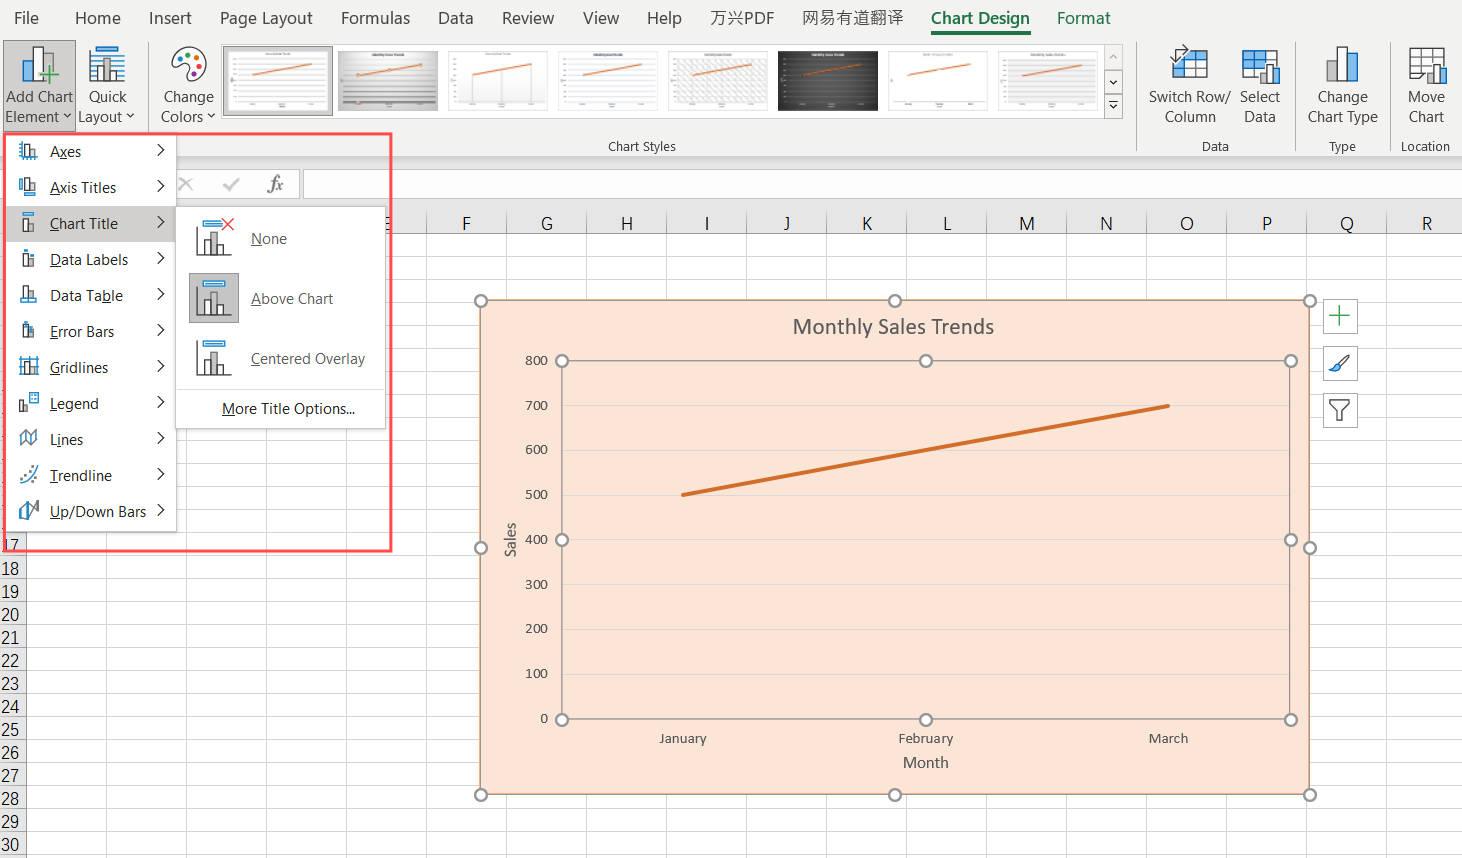
- Add a Title: Click on the chart title to edit it. A descriptive title (e.g., "Monthly Sales Trends") makes the chart easier to understand.
- Label Axes: Use the Chart Elements button (the “+” icon) to add axis labels for better context.
Adjust Colors and Styles: Use the Chart Tools tab to change line colors, add gridlines, or apply styles.
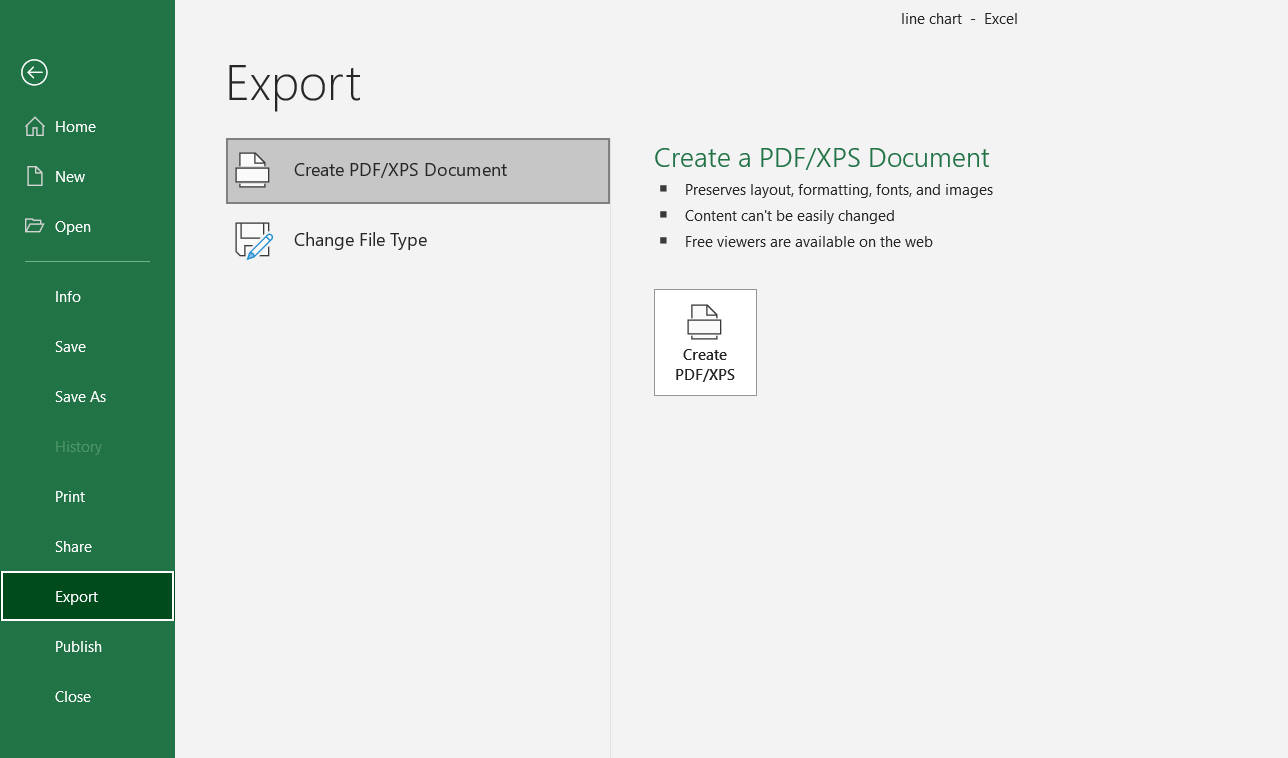
- Save or Export
When finished, save your work or export the chart. You can copy it into a report or presentation by right-clicking and selecting Copy.
Tips for Best Results
- Avoid overcrowding the chart with too much data; keep it clear and focused.
- Use contrasting colors if you’re plotting multiple data sets to enhance readability.
- Regularly update your data in the table to reflect changes; the chart will automatically adjust.
With these steps, you can quickly create an informative line chart.
Explore Online Line Chart Creator: Boardmix
To create a line chart, in addition to Excel, we can use an intuitive online platform like Boardmix.
What is Boardmix and Why It is a Good Line Chart Creator?
Boardmix is an innovative web tool designed to create stunning, interactive visualizations, including line charts. Known for its easy-to-use interface and wide range of customization options, Boardmix is quickly becoming the favorite tool of data analysts and professionals.
Whether you're visualizing business trends, project timelines, or personal data, Boardmix offers:
- User-Friendly Interface: Intuitive design for quick chart creation.
- Customizable Options: Adjust colors, labels, and styles to fit your needs.
- Collaboration Features: Share and edit charts with your team in real-time.
- Cloud-Based Access: Work on your charts anytime, anywhere.
With Boardmix, users can create line charts that truly represent the story of their data. The tool allows you to control everything from the color of the line to its thickness, ensuring the individuality of each chart.
How to Create a Line Chart with Boardmix?
The process of creating a line chart in Boardmix is intuitive. Here's how to do it:
Step 1: Log in to Boardmix
First, go to the Boardmix website and log in to your account. If this is your first time, you'll need to create an account.

Step 2: Create a new board
Once you're logged in, create a new board by clicking the button at the top.
Step 3: Choose line chart
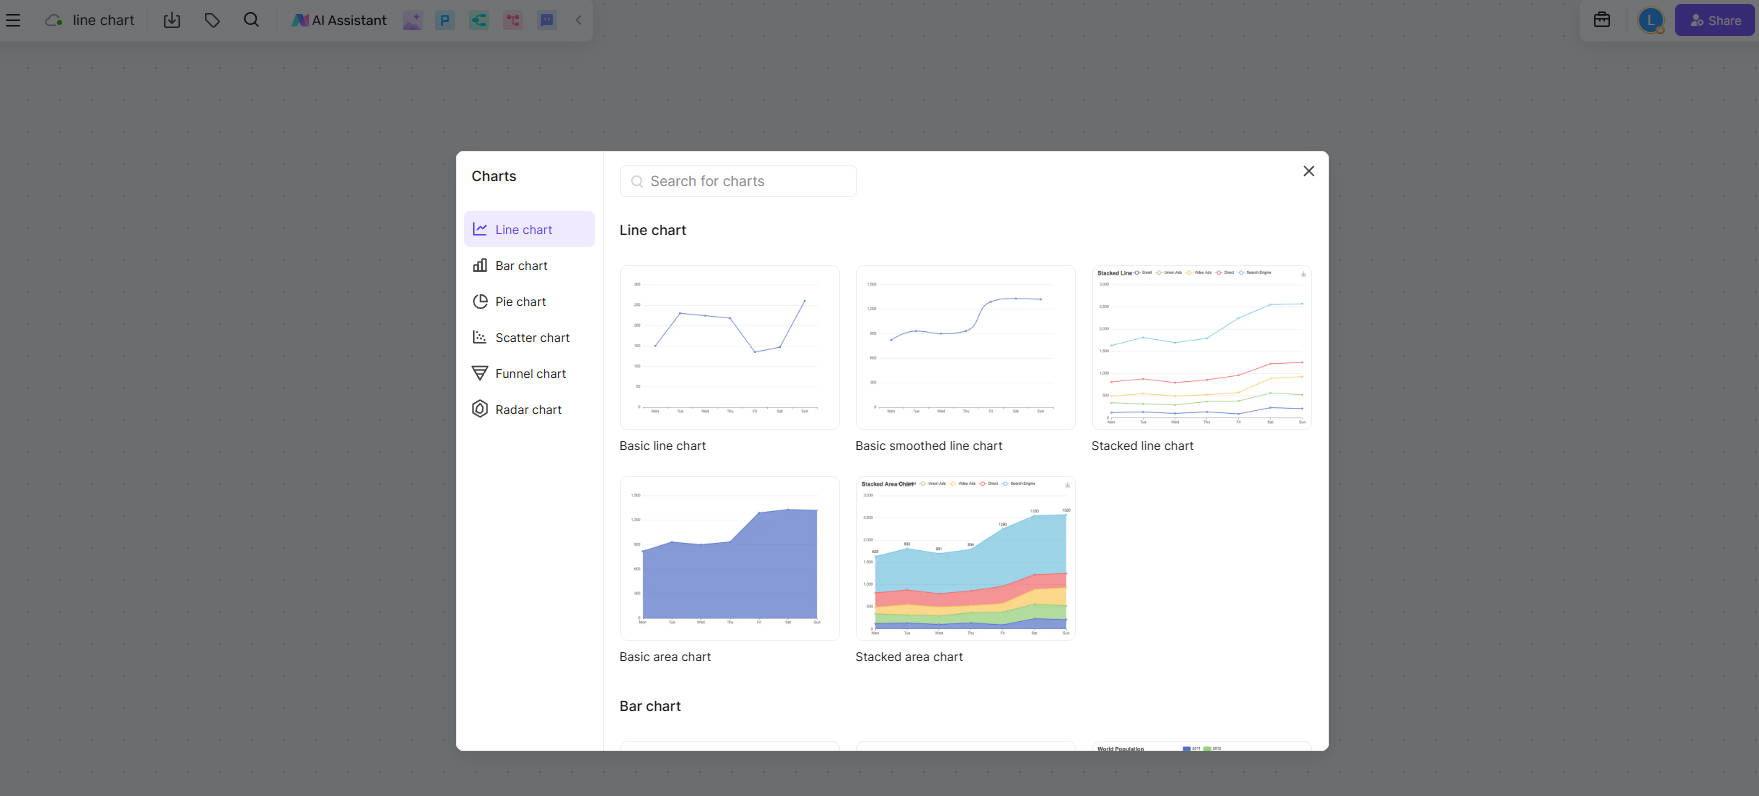
After entering the canvas, click the 3-dot menu on the left and select 'Chart > Line chart' from the list of available options.
Step 4: Enter your data
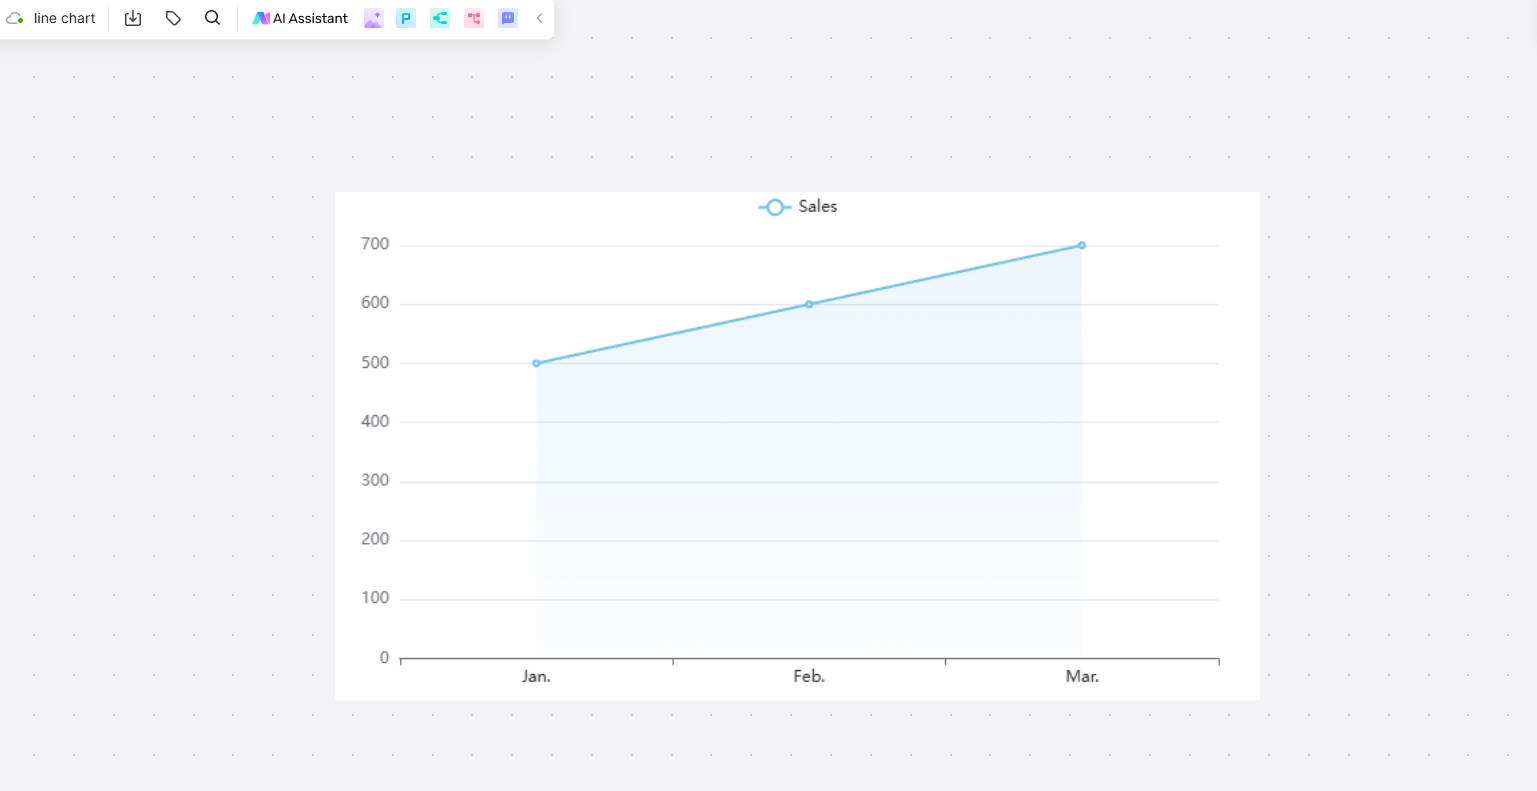
Now it's time to enter your data into Boardmix. The X-axis typically represents time, while the Y-axis represents the quantity you're measuring.
Step 5: Customize your line chart
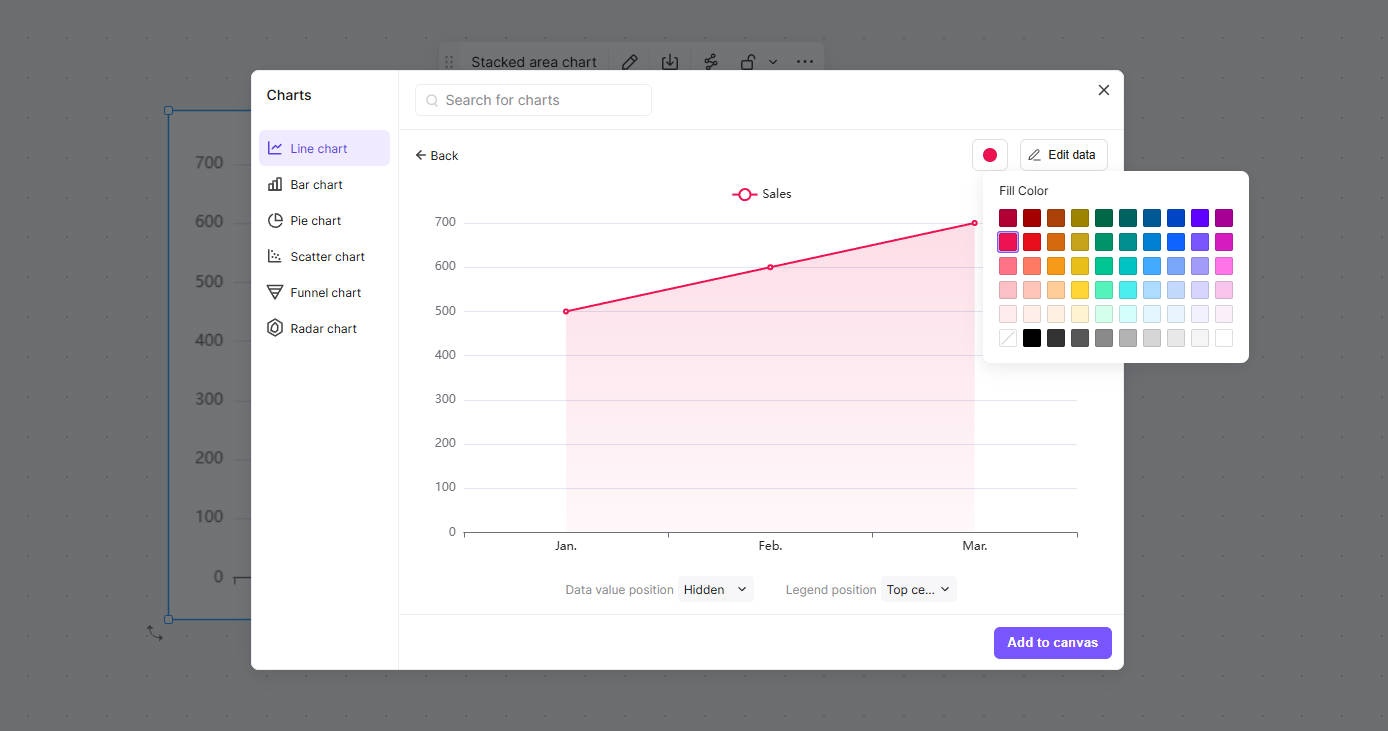
After you import your data, you'll have complete freedom to customize your chart. You can change the colors of the lines, adjust the axes, add labels, and more. Customization options are robust in Boardmix, so make sure your line chart perfectly fits your preferences and needs.
Step 6: Save and share your line chart
Once your line chart looks exactly the way you want, save it. You can then share the chart via email or on social media, embed it on your website, or download it for offline use.
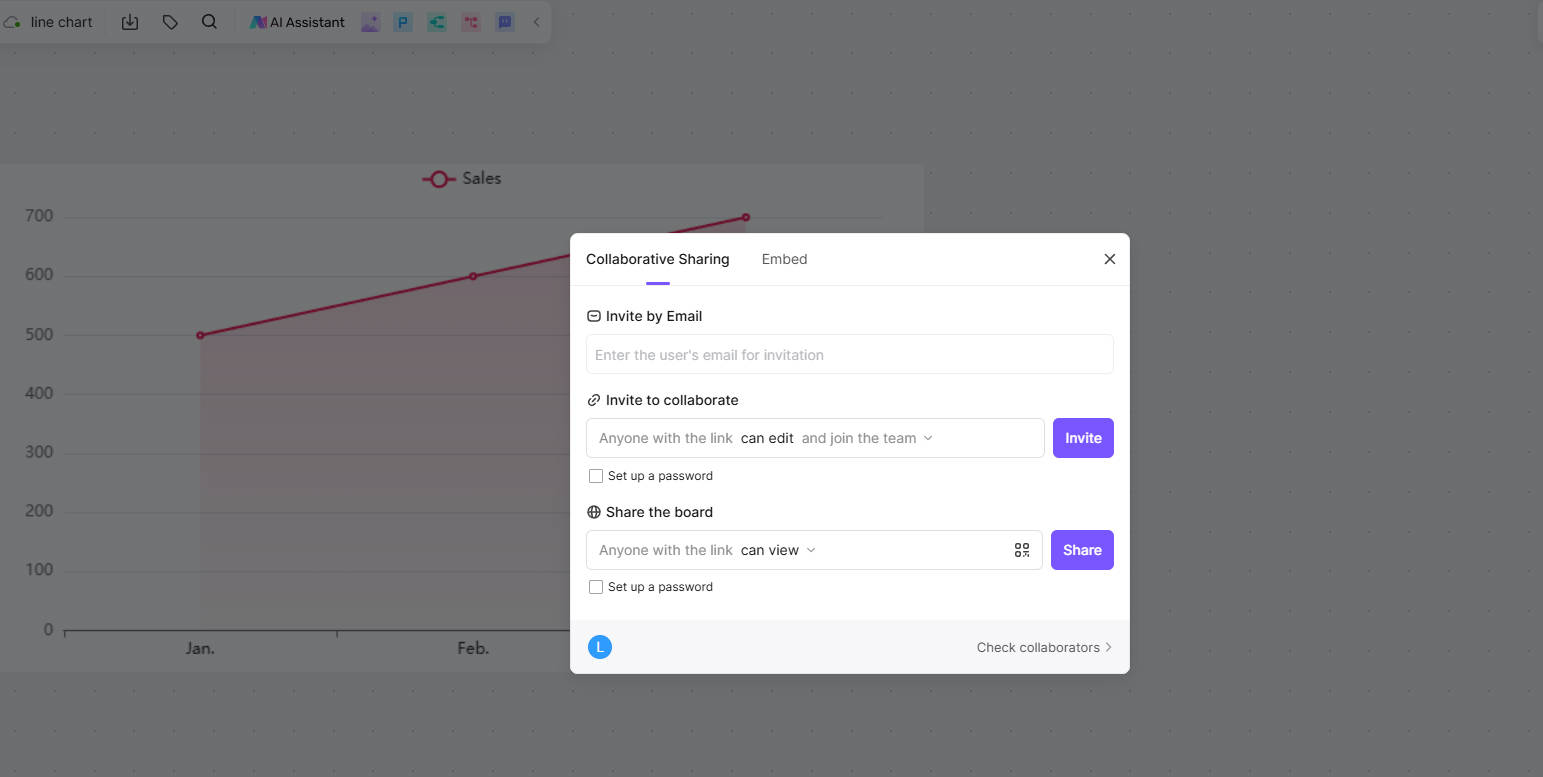
Creating a line chart with Boardmix not only makes the process easier, it also allows you to present your data more effectively. So dive in and let Boardmix's powerful features help you bring your data to life.
Tips and Tricks for Making a Line Chart
1. Understand Your Data
Before you start creating a line chart, make sure you know your data well. Familiarize yourself with the variables and trends you need to display. This will allow you to choose the right data points and provide context to your audience.
2. Choose the Right Tool
Selecting the right tool to create your line chart is crucial. When choosing, you need to consider factors such as ease of use, customization, collaboration features, and integration options. Platforms like Boardmix offer a great balance between these features.
3. Keep it Simple
While it's appealing to use all of the tools, it's important to know how to create a line chart. Given the features a tool offers, simplicity often works best. Stick to 2-3 colors, keep axis labels clear and concise, and avoid cluttering the chart with too many lines.
4. Use gridlines sparingly
Gridlines can help guide the eye and make your line chart easier to read. However, too many gridlines can make your chart look cluttered. Use them sparingly and make sure they are clear enough not to distract from the lines representing the data.
5. Highlight key data points
Highlighting key data points or significant trends can help your audience understand the important parts of your line chart. Most online tools offer options to highlight certain points by changing their size or color.
6. Use interactive elements
Interactivity can increase interest in your chart. Features like hover effects on data points or interactive legends can make your line chart more informative and engaging for your audience.
By applying these tips and tricks, you'll be able to create compelling and clear line charts that not only look professional but also successfully convey the story of your data.
Conclusion
To sum up, line charts are a powerful visualization tool that can be of great value to anyone working with data. They provide an easy way to identify trends and patterns and are essential for making data-driven decisions. Creating a line chart is not only practical but also offers numerous possibilities to make your data stand out. Use Boardmix to create your line chart to enhance your data visualization. Get started now!


