State diagrams are an essential tool in system design and building computer applications. They are the skeleton of any system's functionality, showing how it reacts and adapts to different events or stimuli. In this article, we will discover the usefulness of state diagrams through practical examples in various fields such as programming, systems engineering, and more, with the help of the Boardmix diagramming tool.
What is a State Diagram?
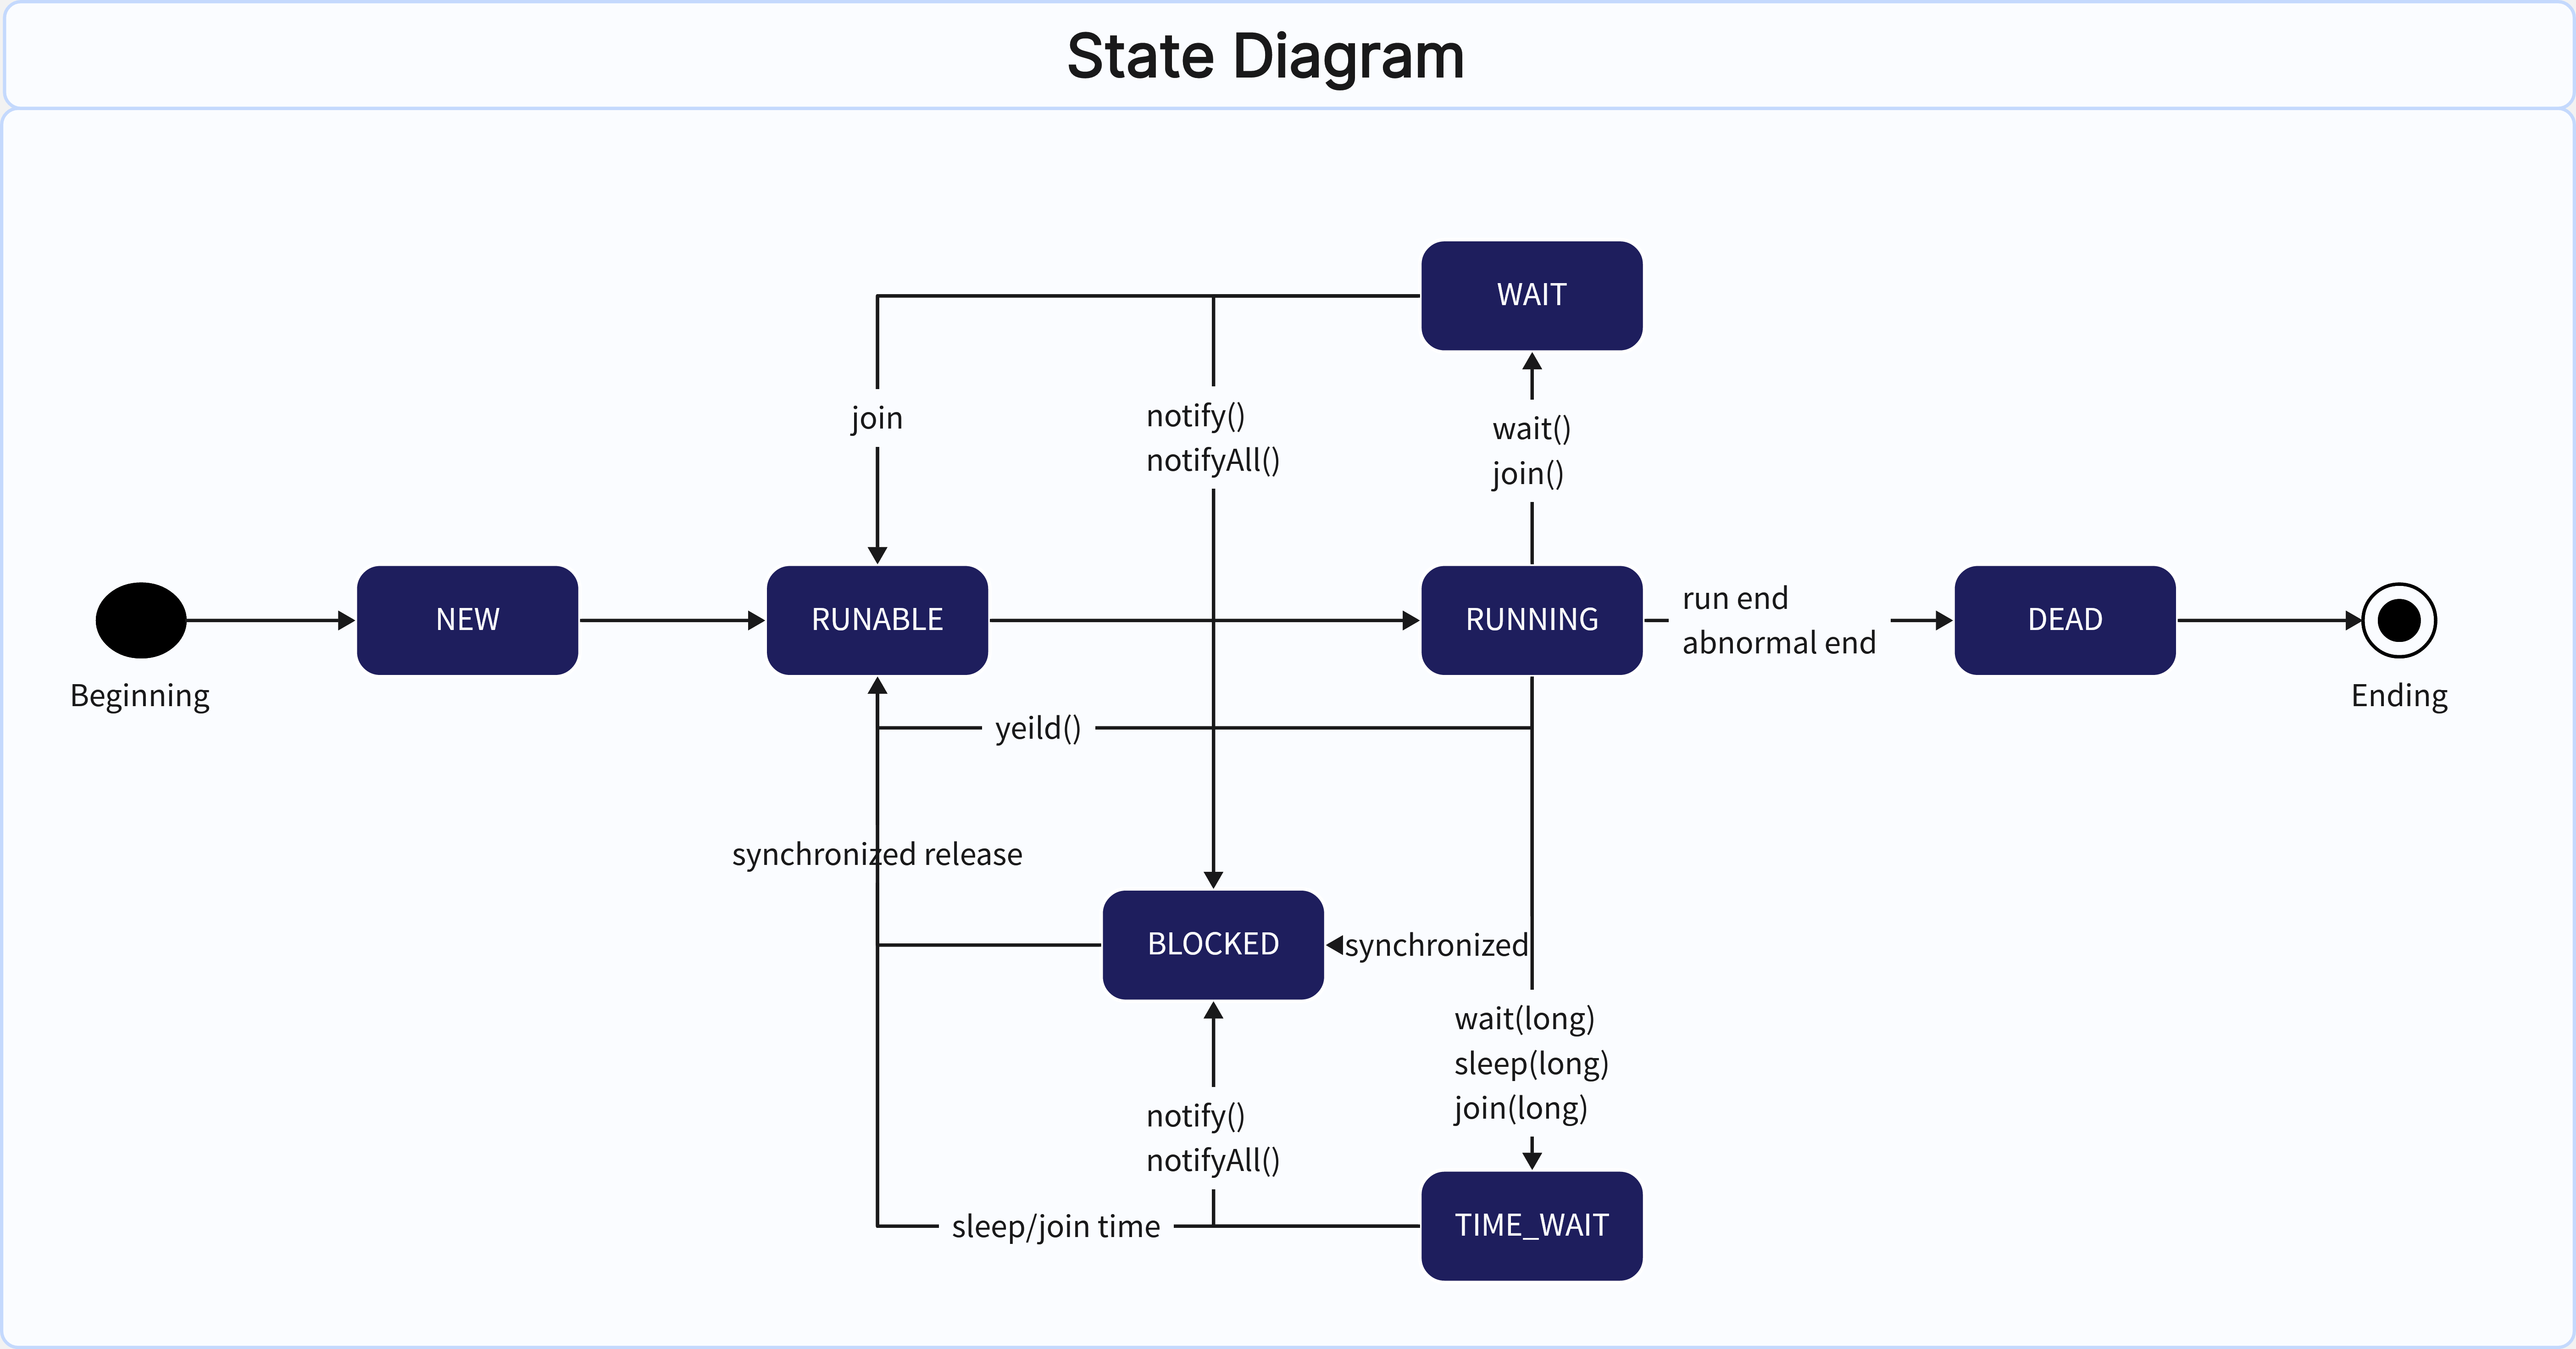
Create a state diagram on Boardmix
A state diagram is a graphical representation of the behavior of a system or component in response to external events during its lifetime. State diagrams show the various conditions (states) the system can be in and the transitions between these states, usually triggered by events or stimuli. These types of diagrams are widely used in software development, system design, and other areas to describe the dynamic behavior of systems.
Fundamental Components of State Diagrams
A state diagram is made up of several key components including states, transitions, events, and actions.
States
States represent the different conditions in which an object can be found. Each state is represented by a rectangle with rounded corners, inside which the name of the state is indicated.

Transitions
Transitions represent changes in state. They are indicated by arrows that start from one state (the source state) and point to another (the destination state). Transitions usually include an event or condition that triggers the change in state.
Events
Events are events that occur during the execution of a system and that can trigger a change in state. They can be internal (generated by the system itself) or external (caused by an agent external to the system).

Actions
Actions are the activities that are performed when a system enters or leaves a specific state.
Exploring 6 State Diagram Examples
State diagrams are used in a wide variety of industries and contexts. Here are some concrete examples:
Example 1: Calendar Availability State Diagram
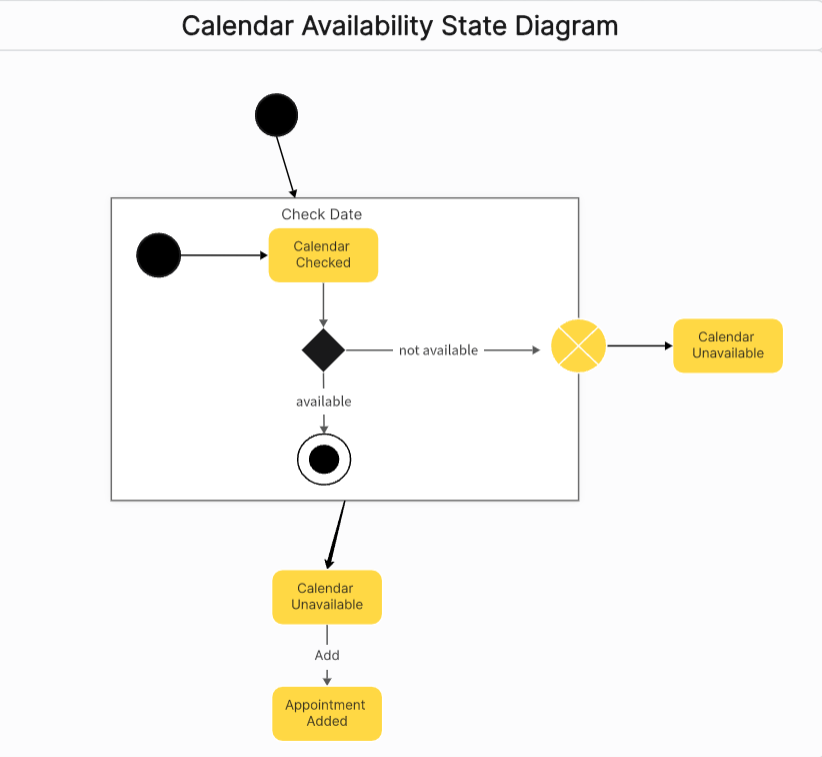
Create a calendar availability state diagram on Boardmix
This state machine diagram example illustrates the procedure by which an individual sets an appointment on his or her calendar. In the composite state known as "Check Date," the system checks the calendar for free slots through several different substates. If no time slot is found on the calendar, the process is automatically bypassed. However, if the calendar finds availability, the appointment will be successfully recorded and added to the calendar.
Example 2: Coffee Machine State Diagram
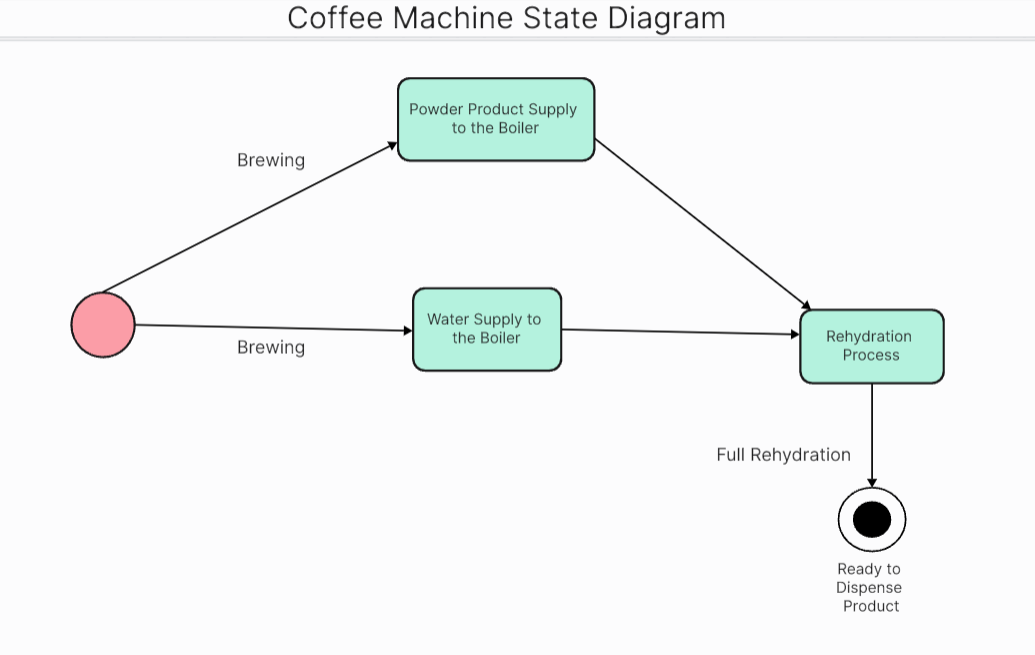
Create a coffee machine state diagram on Boardmix
In this case, the state diagram could represent the different states that a coffee machine goes through during operation: power on, coffee brewing, coffee dispensing, cleaning, and powering off. These types of diagrams are very useful in the manufacturing and electronics industry to visualize the inner workings of machines.
Example 3: University State Diagram
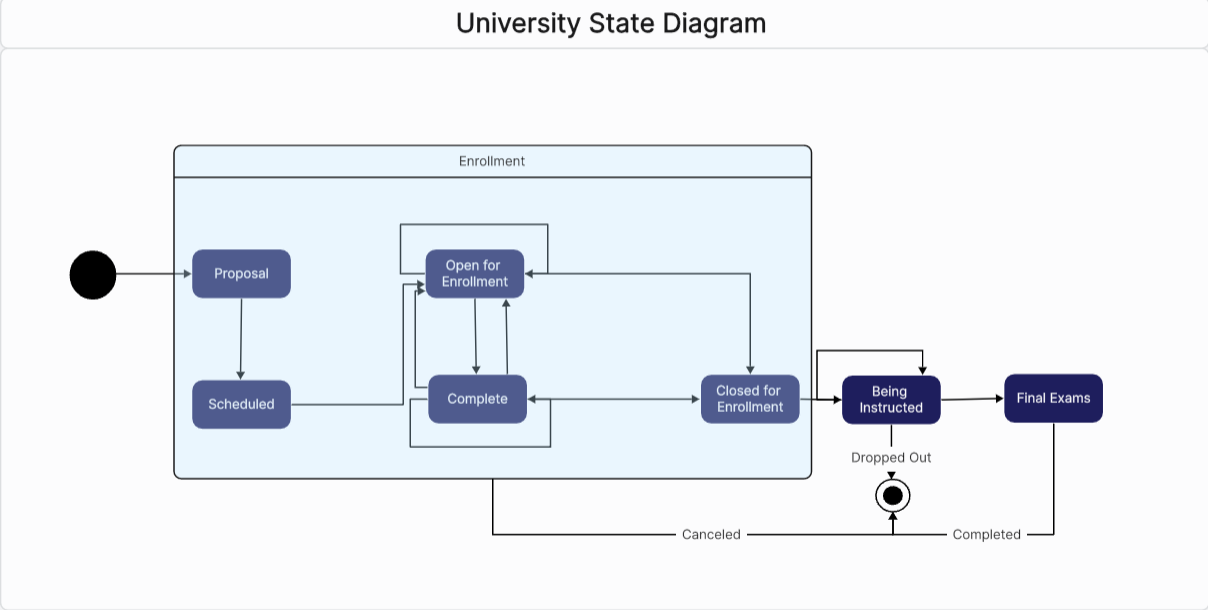
Create a university state diagram on Boardmix
This example shows the enrollment and classes process at a university. The different states a student can experience are described here, from initial enrollment to taking final exams.
Example 4: Hospital Control System State Diagram
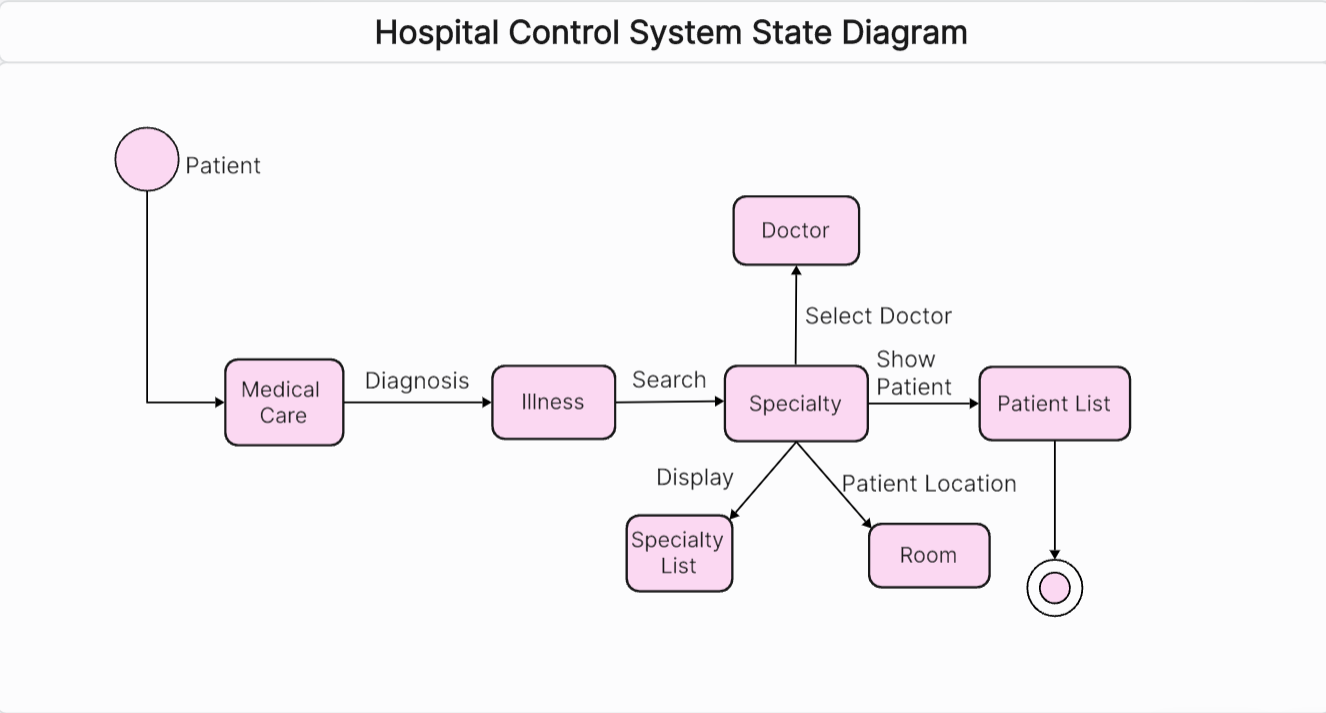
A hospital control system state diagram could represent the different states a patient goes through during their hospital stay: admission, diagnosis, treatment, recovery, and discharge. These types of diagrams are very useful in healthcare management to understand and optimize patient care processes.
Example 5: Airport Check-In State Diagram
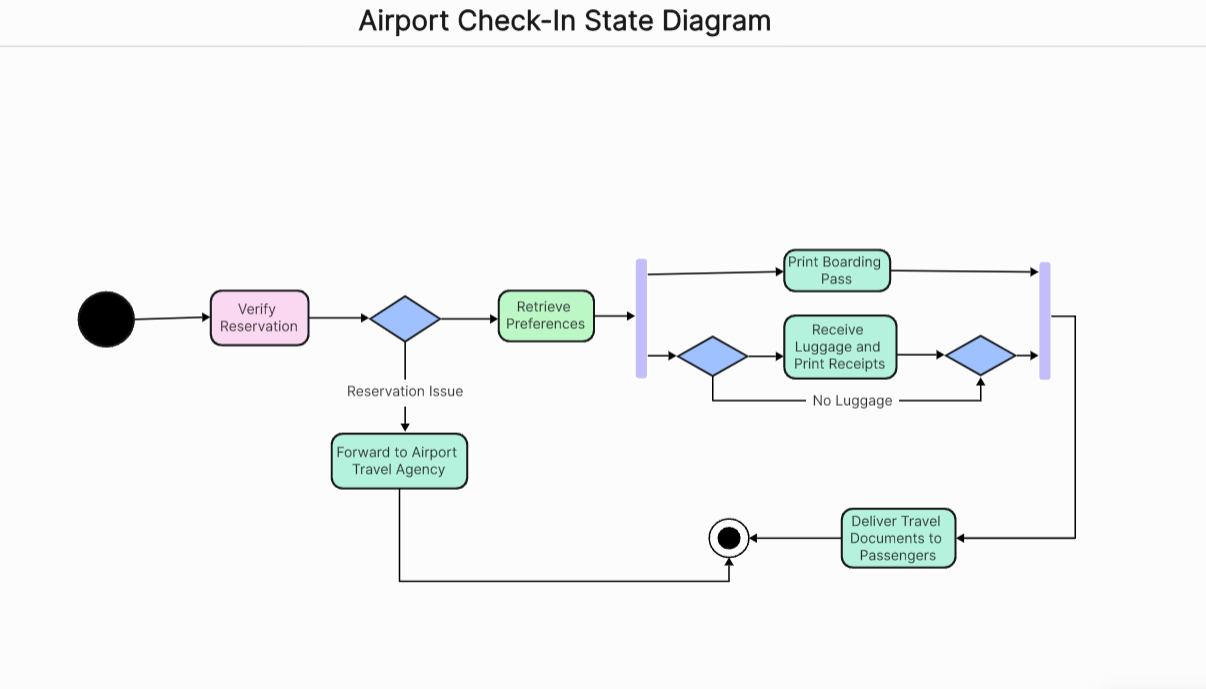
This diagram could represent the different states a passenger goes through during the check-in process at an airport, from arrival to boarding the plane. States could include, for example, "Check Reservation," "Print Boarding Pass," "Get Preferences," etc. The transitions between these states would be the actions that allow the passenger to move from one state to another.
Example 6: Butterfly Life Cycle State Diagram
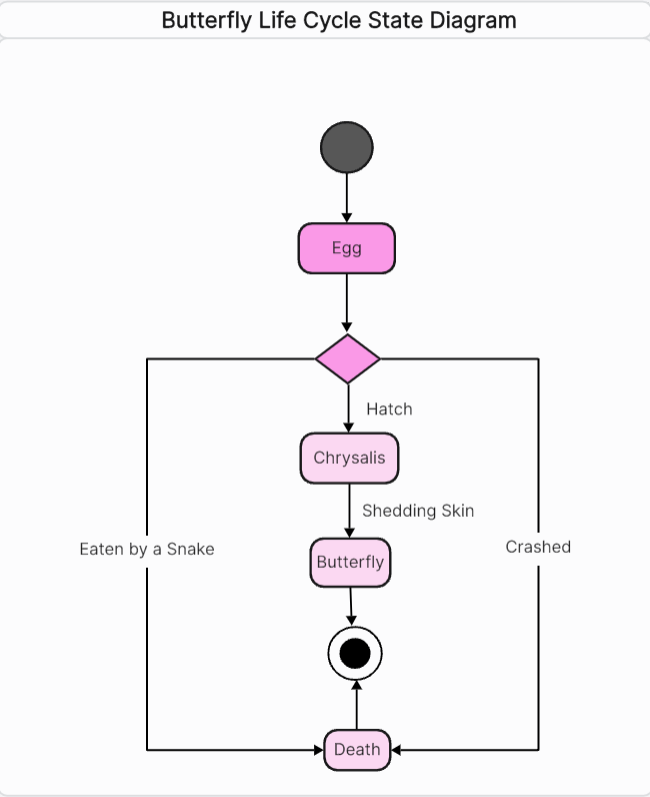
This diagram would illustrate the distinctive stages a butterfly goes through during its life, from egg, larva, pupa to becoming a butterfly. Each state represents a different phase in the butterfly's life and the changes between these states represent the transition from one phase to another.
How to Create a State Diagram Online Effectively?
Boardmix is an incredibly versatile and effective online tool for creating state diagrams. Its interface is intuitive, making it easy to use for both beginners and experienced professionals.
- Sign up
To start creating a state diagram with Boardmix, you must first register on their platform. It's a quick and easy process - you just need to provide your email and set a password.

- New Board
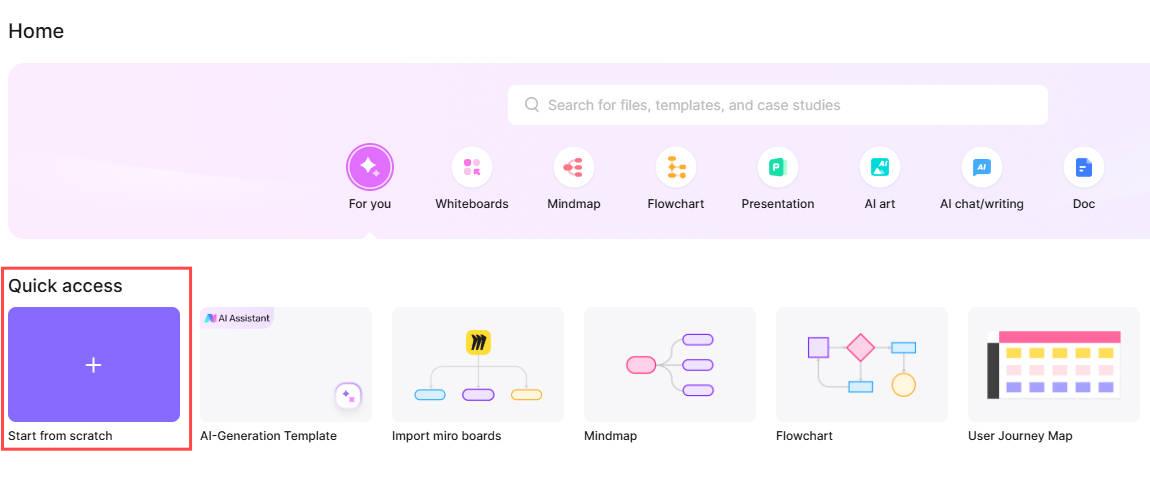
Once you've logged into your Boardmix account, you'll see a number of options on the main screen. Find the "New Board" option and click on it. A new blank board will then open.
- Add Shape
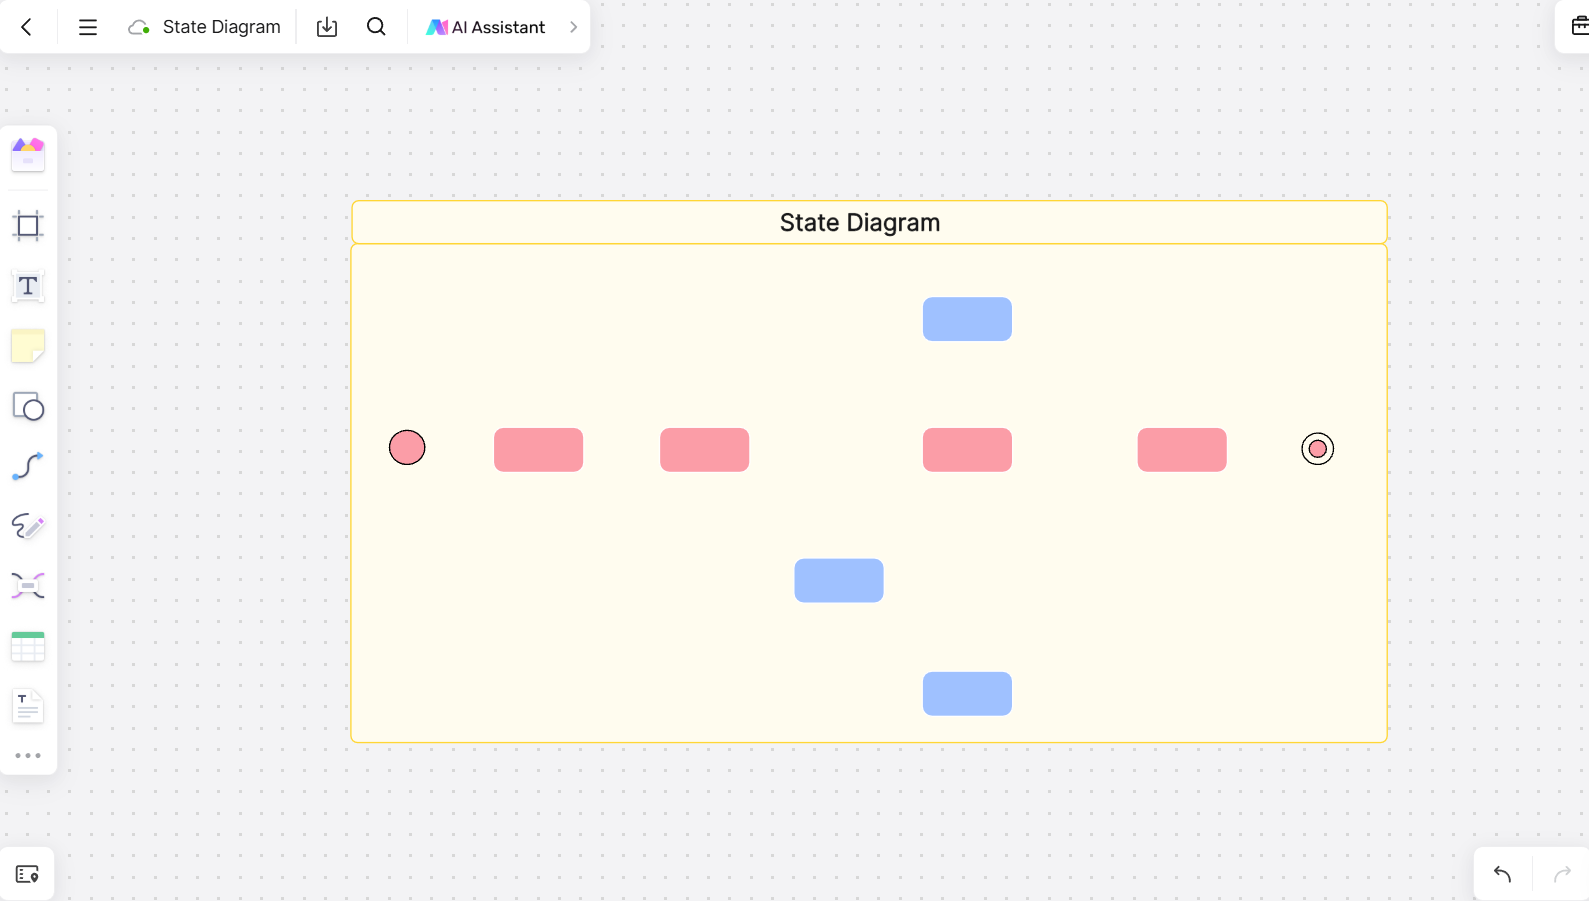
Now start creating. Boardmix allows you to draw the states and transitions directly on your virtual canvas. Click on “Shape” from the menu and select the shapes needed for your diagram. Simply click and drag to create the diagram’s state shapes on the canvas. You can also customize the colors and size of the elements to suit your needs.
- Connection Line
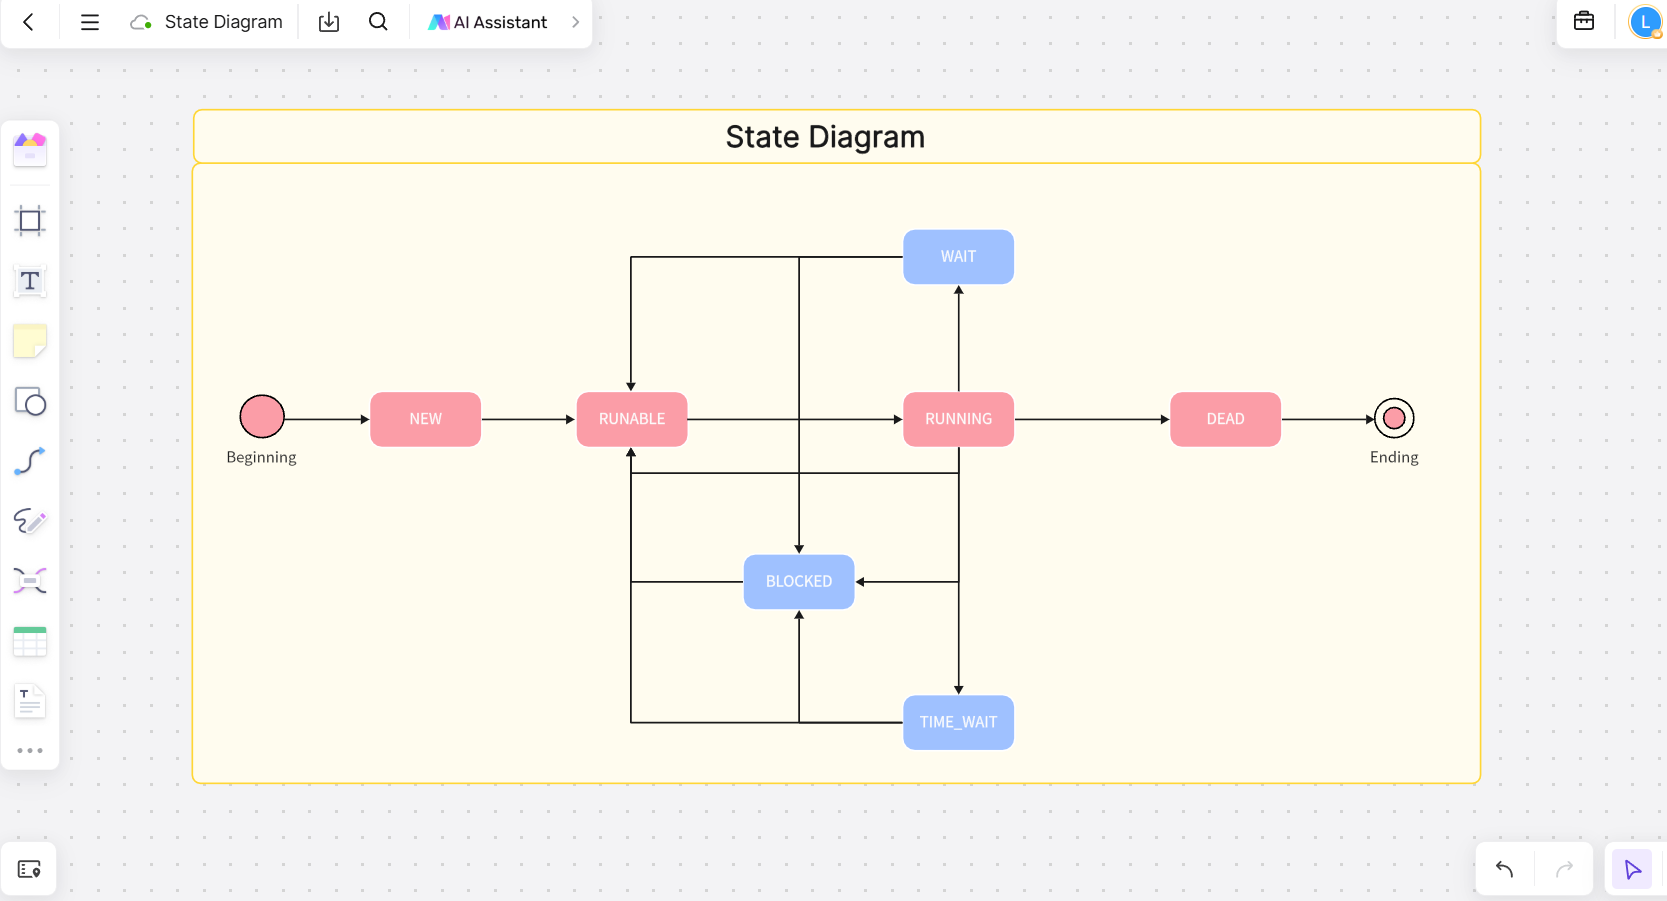
You can then use “Connection Line” to indicate transitions between states.
- Share Online
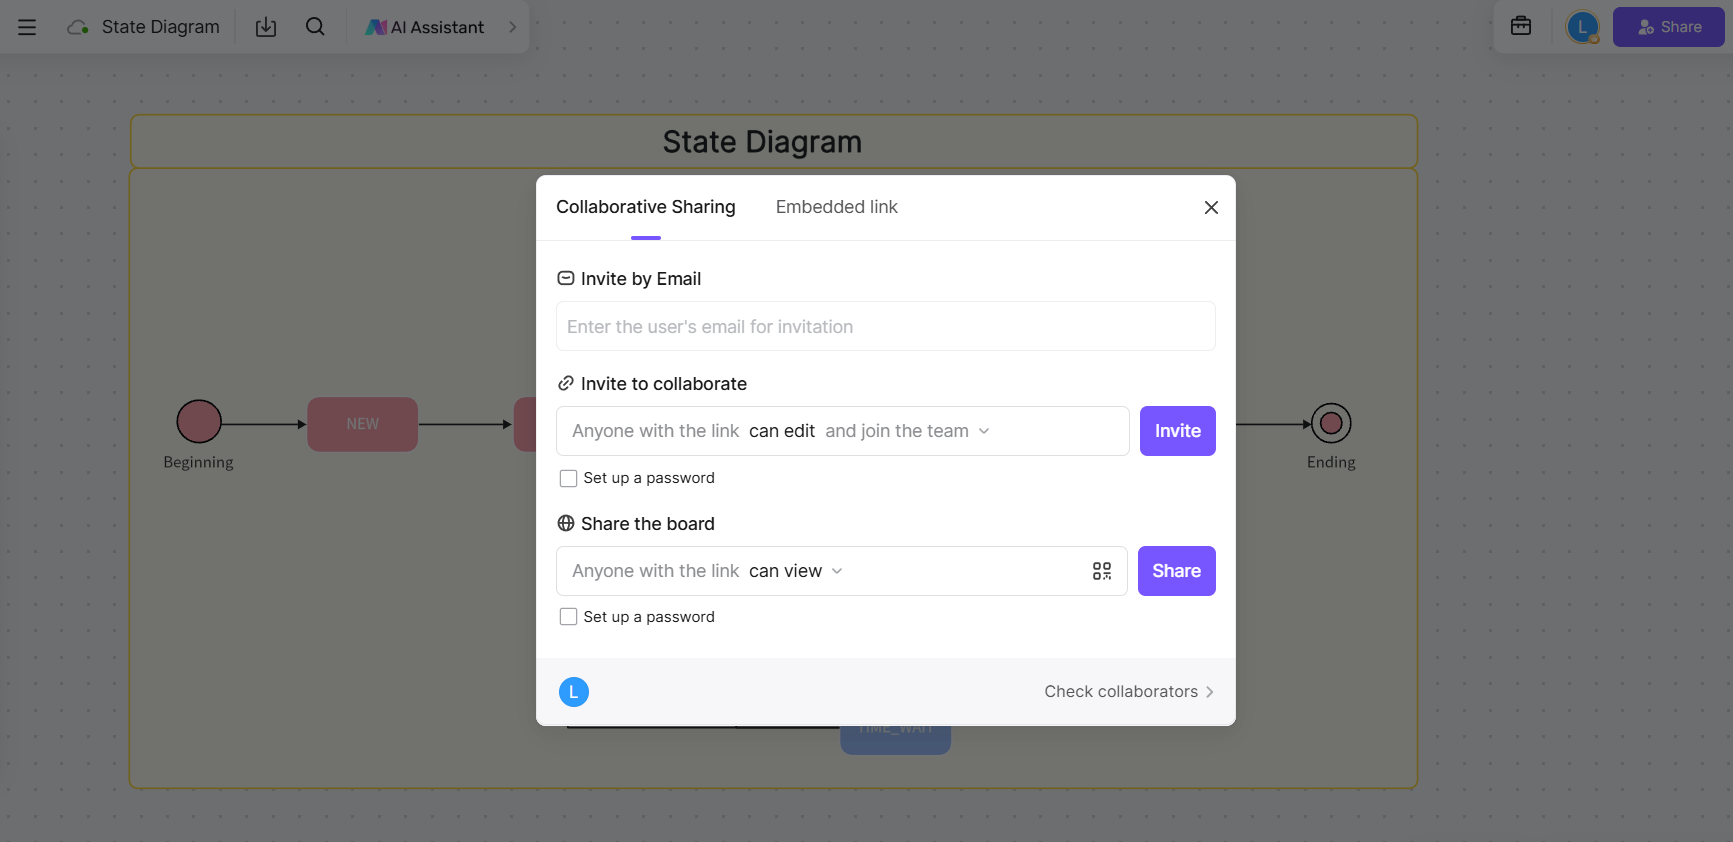
Once you have finished designing your state diagram, you can save it to your Boardmix account to access it later or share it with other users. You also have the option to export it as an image or PDF for use outside the platform.
Tips on Drawing State Diagram
Creating a clear and effective state diagram requires careful planning and attention to detail. Here are some useful tips to enhance your workflow:
1. Define Objectives Clearly
Before starting, clarify the purpose of your state diagram. Whether it’s for software development, system design, or process mapping, understanding your objectives will help you organize your diagram effectively.
2. Keep It Simple
Avoid overcrowding your diagram with too many states or transitions. Focus on key elements and use additional diagrams if necessary to cover complex systems.
3. Use Consistent Shapes and Labels
Maintain uniformity in the shapes and labels used for states and transitions. For example, use ovals for states and arrows for transitions, and ensure labels are concise and easily readable.
4. Color Code for Clarity
Utilize different colors to differentiate between states, transitions, or types of states (e.g., active, idle, error). This enhances visual clarity and helps stakeholders understand the flow quickly.
5. Test Your Diagram
Once complete, walk through the diagram step by step to ensure all transitions are logical and no key states are missing. Share it with team members for feedback and validation.
By following these tips, you can create a state diagram that is not only visually appealing but also functional and easy to interpret.
Conclusion
State diagrams are a valuable visualization tool that offer a clear and concise approach to understanding and modeling complex systems. By properly understanding and using state diagrams, it is possible to design and analyze more efficient and effective systems.
No matter your field of activity, state diagrams can be a powerful tool in your arsenal. We hope that the examples and tips presented in this article will help you discover new ways to use this valuable tool. If you want to create a statechart to delve deeper into state diagrams, try Boardmix for an easy and fun creation experience. Not only does it help you visualize your ideas effectively, but it also allows you to share your creations with others in a simple way.


