

Thinking map is a visualization tool based on cognitive schemata, which transforms abstract thinking processes into actionable information topology through standardized graphic structures. In this article, we will introduce 8 types of thinking maps and how to use thinking map templates for free.
What are the 8 Types of Thinking Map?
The Thinking Maps system includes eight mutually exclusive cognitive architecture tools, which are classified according to the core cognitive goals of information processing. Each tool requires the user to match the corresponding logical operation mode and supports tool chain combination application in complex problem solving scenarios. Here are the 8 thinking maps:
✨Circle Map
✨Bubble Map
✨Double Bubble Map
✨ Multi-Flow Map
✨Brace Map
✨Bridge map
1. Circle Map Thinking Map
A circle diagram is a visualization tool consisting of two concentric circles. The inner circle is used to mark the core topic, while the outer circle is used to record extended information related to the topic.
Its main function is to integrate fragmented information. When users need to systematically sort out a topic, they can first write the core concept into the inner circle, and then freely list all related content on the outer circle.
Taking the formulation of social media operation strategies as an example, the inner circle can be marked with "improving user engagement", and the outer circle extends related elements such as "short video content optimization", "hot topic tracking", and "user comment interaction mechanism". In this way, operators can quickly identify key action directions and provide an information basis for subsequent in-depth analysis.
Compared with other thinking tools, the advantage of the circle diagram lies in its low-threshold information storage ability. It does not require users to establish a logical framework in advance, but instead achieves preliminary information classification through differences in spatial layout, which has significant auxiliary value for initial exploratory thinking.
2. Bubble Map Thinking Map
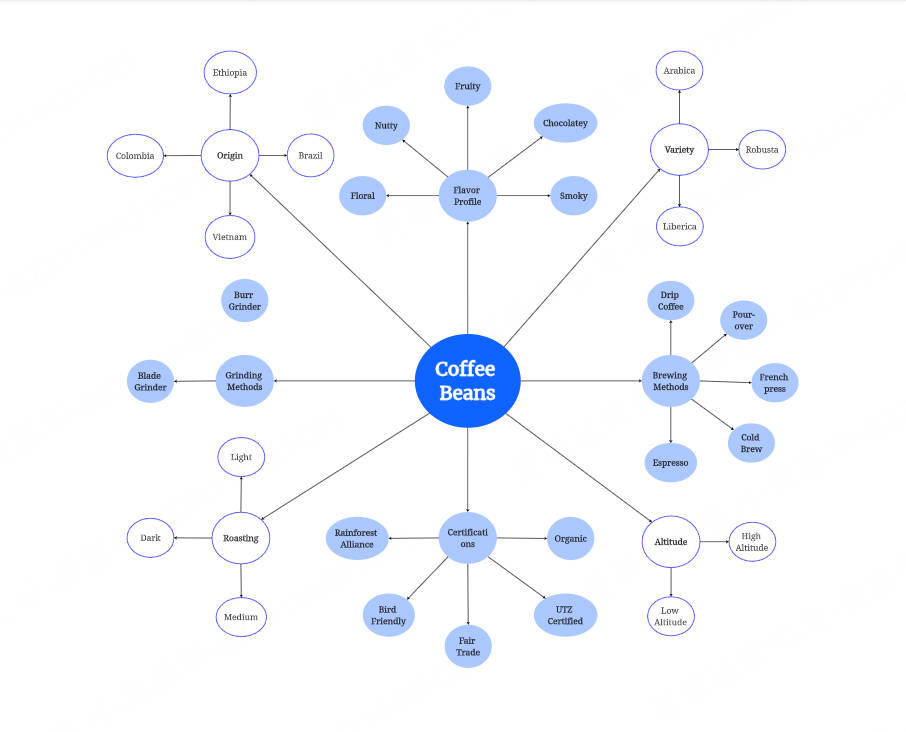
Bubble Map consists of a central bubble and multiple secondary bubbles distributed around it. The central bubble is used to mark the main object to be analyzed, and the secondary bubbles are used to systematically record the attribute characteristics of the object. This method is widely used in product design document preparation, business analysis framework construction, and user behavior research.
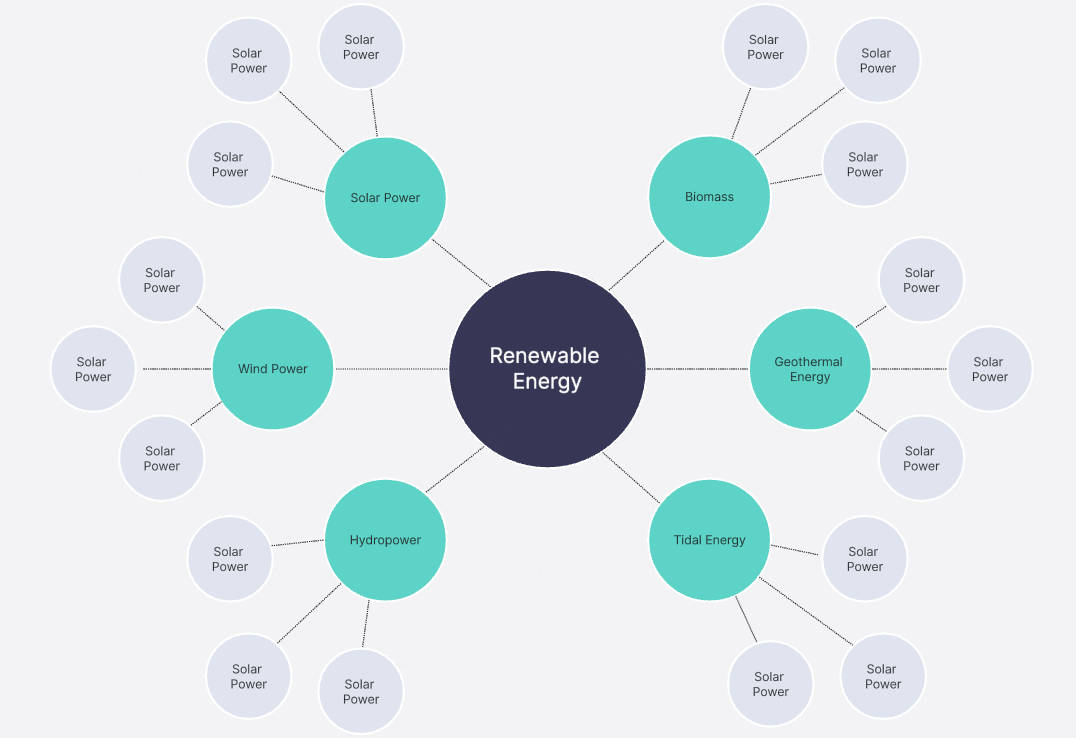
Taking computer equipment analysis as an example, the central bubble can be marked with "high-performance computer", and the secondary bubbles can extend characteristic parameters such as "parallel computing capability", "modular hardware architecture", and "multi-threaded processing mechanism".
In general, compared with open feature description, the advantage of Bubble Map lies in its mandatory feature classification mechanism.
3. Double Bubble Map Thinking Map
Double Bubble Map consists of two independent central bubbles and a shared middle area. The central bubbles mark the main objects to be compared and analyzed, the outer bubbles are used to record the unique attributes of each subject, and the middle overlapping area is used to systematically present the common characteristics of the two.
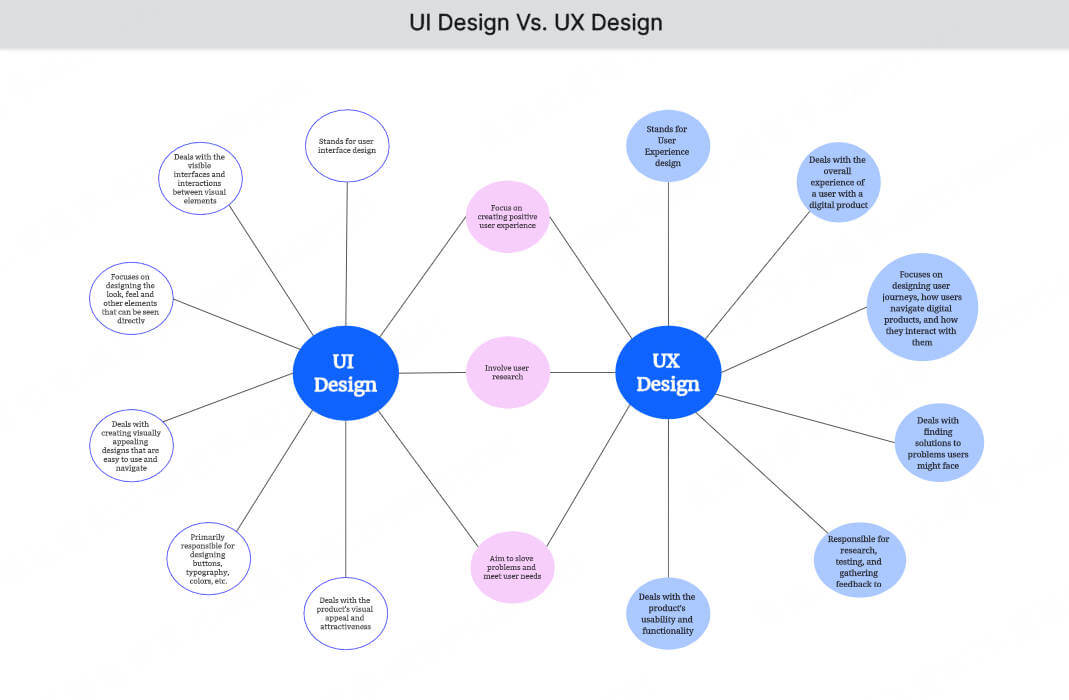
Double Bubble Map is mainly used to systematically compare and analyze the differences and relevance of two entities. This method is often used in the preparation of competitive product analysis reports, technical solution evaluation and academic theory comparison research.
Take the comparison of collaborative tools as an example. The central bubble on the left is marked with "online whiteboard", and the outer bubbles can be extended to "cross-regional collaborative editing" and "version history tracing"; the central bubble on the right is marked with "physical whiteboard", and the outer bubbles can present attributes such as "real-time interaction in physical space" and "zero network dependence"; the shared area in the middle summarizes common functions such as "visual information presentation" and "team discussion support".
In general, compared with traditional table comparison, the advantage of Double Bubble Map lies in its spatial feature isolation mechanism. By forcibly distinguishing unique attributes from shared features through physical partitioning, information confusion can be effectively avoided.
4. Flow Map Thinking Map
Flow Map consists of linearly arranged nodes and connecting arrows. Nodes are used to mark process stages, and the direction of arrows indicates the process sequence. This tool is defined as a visual tool for displaying linear sequences, and its structure usually adopts a horizontal or vertical extension layout.
When it is necessary to clarify the execution order of multi-link operations, key steps can be marked by nodes, and stage associations can be established through arrows.
Taking the birthday event planning process as an example, the node sequence can be marked as "venue booking → guest list confirmation → material procurement → event process arrangement → emergency plan formulation". Each node can extend the secondary sub-process, such as the material procurement link can be refined into "decoration material procurement list formulation → supplier price comparison → acceptance standard confirmation", so as to build a complete planning and execution framework.
Compared with textual process descriptions, the advantage of flow map lies in its mandatory timing constraint mechanism. Through the coordination of spatial arrangement and directional symbols, cognitive bias in stage order can be effectively avoided.
5. Multi-Flow Map Thinking Map
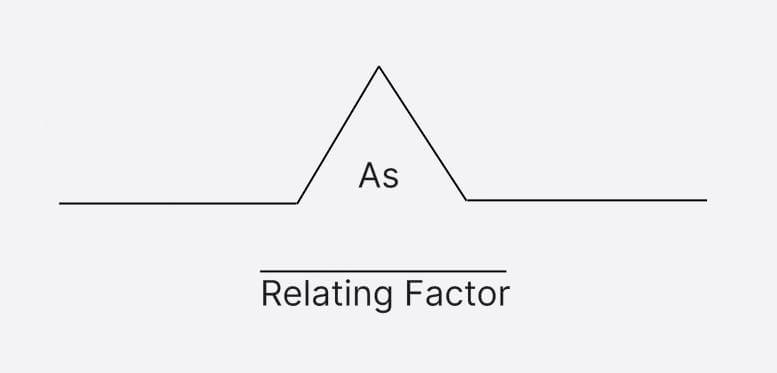
Multi-Flow Map is used to analyze "cause and effect". Its structure is: the cause is listed on the left, the result is listed on the right, and the event itself is in the middle. Multi-Flow Map can help analyze the cause and consequence of a problem and is suitable for decision analysis. At the same time, Multi-Flow Map is used in project review or problem analysis.
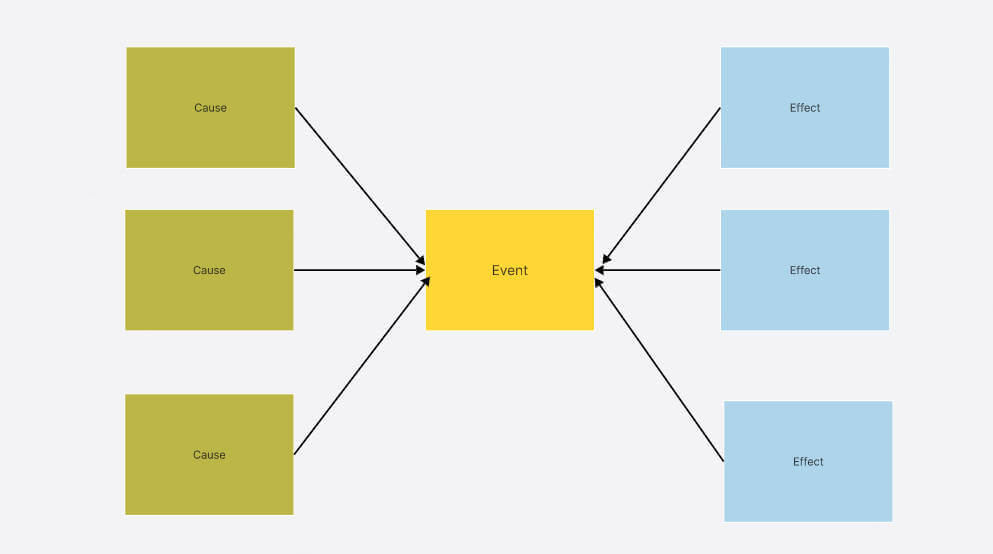
For example, if you want to analyze the "air pollution problem", you can list the causes such as "industrial waste gas", "car exhaust gas" and "deforestation" on the left, and the consequences such as "global warming", "increase in respiratory diseases" and "deterioration of the ecological environment" on the right.
6. Brace Map Thinking Map
Brace Map is mainly used to "decompose the whole". Its structure is similar to curly brackets, which are expanded from left to right. The left side is the whole and the right side is the component. Brace Map is suitable for decomposing structures, such as human body, equipment, system, etc. It can also be used to help students learn knowledge of subjects such as biology, engineering, physics, etc.
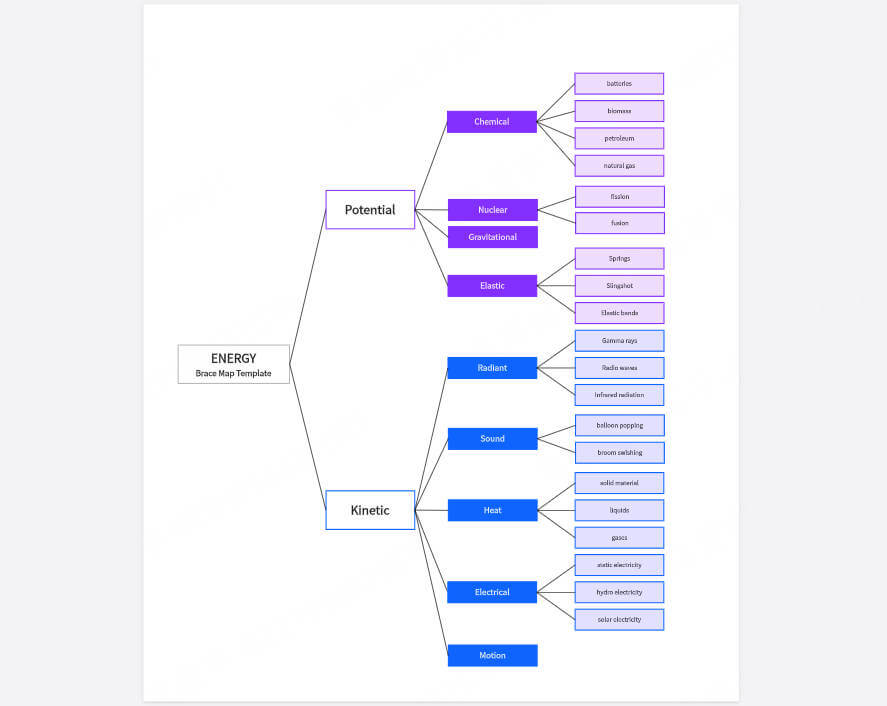
If you want to analyze the "composition of a car", you can write "car" on the left and then expand it on the right side in sequence: "body" → "engine" → "tire" → "seat" → "steering wheel", etc. This method can help people understand the relationship between the whole and the parts of things.
7. Tree Map Thinking Map
Tree Map is mainly used to classify and organize information. It is similar to a tree, with the top level being the big category and the lower levels being subdivided. Tree Map can help classify knowledge and is suitable for organizing information and knowledge management. At the same time, Tree Map is also suitable for business analysis, market segmentation, organizational structure display, etc. In teaching, Tree Map can help students understand subject classification.
If you want to classify "animals", you can write "animals" at the top level of the Tree Map, and then subdivide it downwards: "mammals", "reptiles", "birds", "fish", etc., and each category can be further subdivided. For example, "mammals" can be "lions", "elephants", and "dogs" under "mammals".
8. Bridge Map Thinking Map
Bridge Map is mainly used to establish analogy relationships and help understand the similarities between two groups of things. Its structure is like a bridge, on the left is a group of concepts, on the right is the corresponding concept, and the bridge in the middle connects the relationship between the two.
Bridge Map can be used to learn metaphors and analogies. It is suitable for subjects such as language learning, mathematics, and science, because Bridge Map can help understand new knowledge and establish connections between new and old concepts.
For example, if you want to express "The king is to the crown as the president is to ______?" You can use Bridge Map to draw:
"King: Crown = President: (scepter/national emblem)". In this way, it can help students better understand analogy relationships.
How to use Thinking Map Template in Boardmix?
Boardmix is a powerful online whiteboard tool that provides a rich template library, including thinking map templates, which help users easily create thinking visualization diagrams. Whether it is used for teaching, team collaboration or personal thinking, Boardmix allows you to quickly build professional thinking maps and improve work and learning efficiency. The following are the specific steps to use thinking map template.
1. Enter Boardmix and select a thinking map template
Log in to Boardmix (if you don’t have an account, you can register for free).
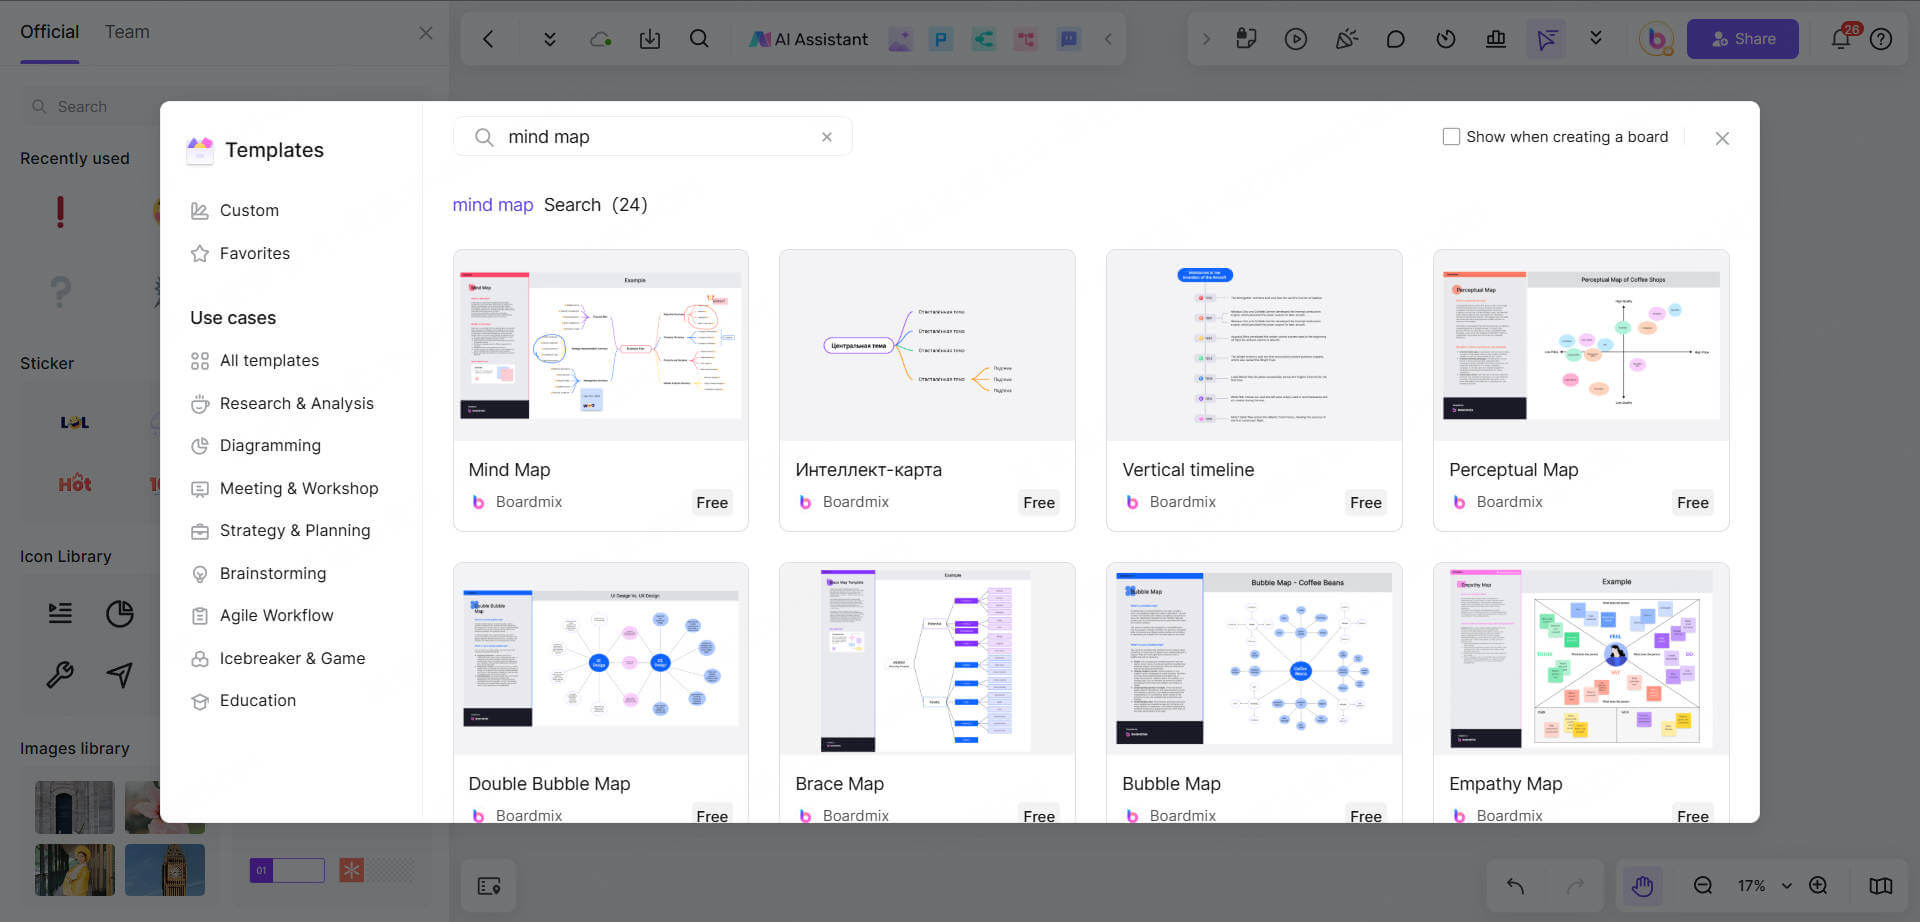
Select “Template Library” on the main interface, then search “Thinking Map” or browse Mind Map/Chart Category directly.
Select Thinking Map that suits your needs (such as Circle Map, Flow Map, etc.), and then click “Use Template” to enter the editing page.
2. Edit and customize your thinking maps
Modify text: Click any element and enter your topic, keywords or description content.
Adjust layout: Drag the graphics and adjust the node size to make the structure more suitable for your needs.
Add elements: You can insert pictures, connecting lines, and color annotations to make the information expression more intuitive.
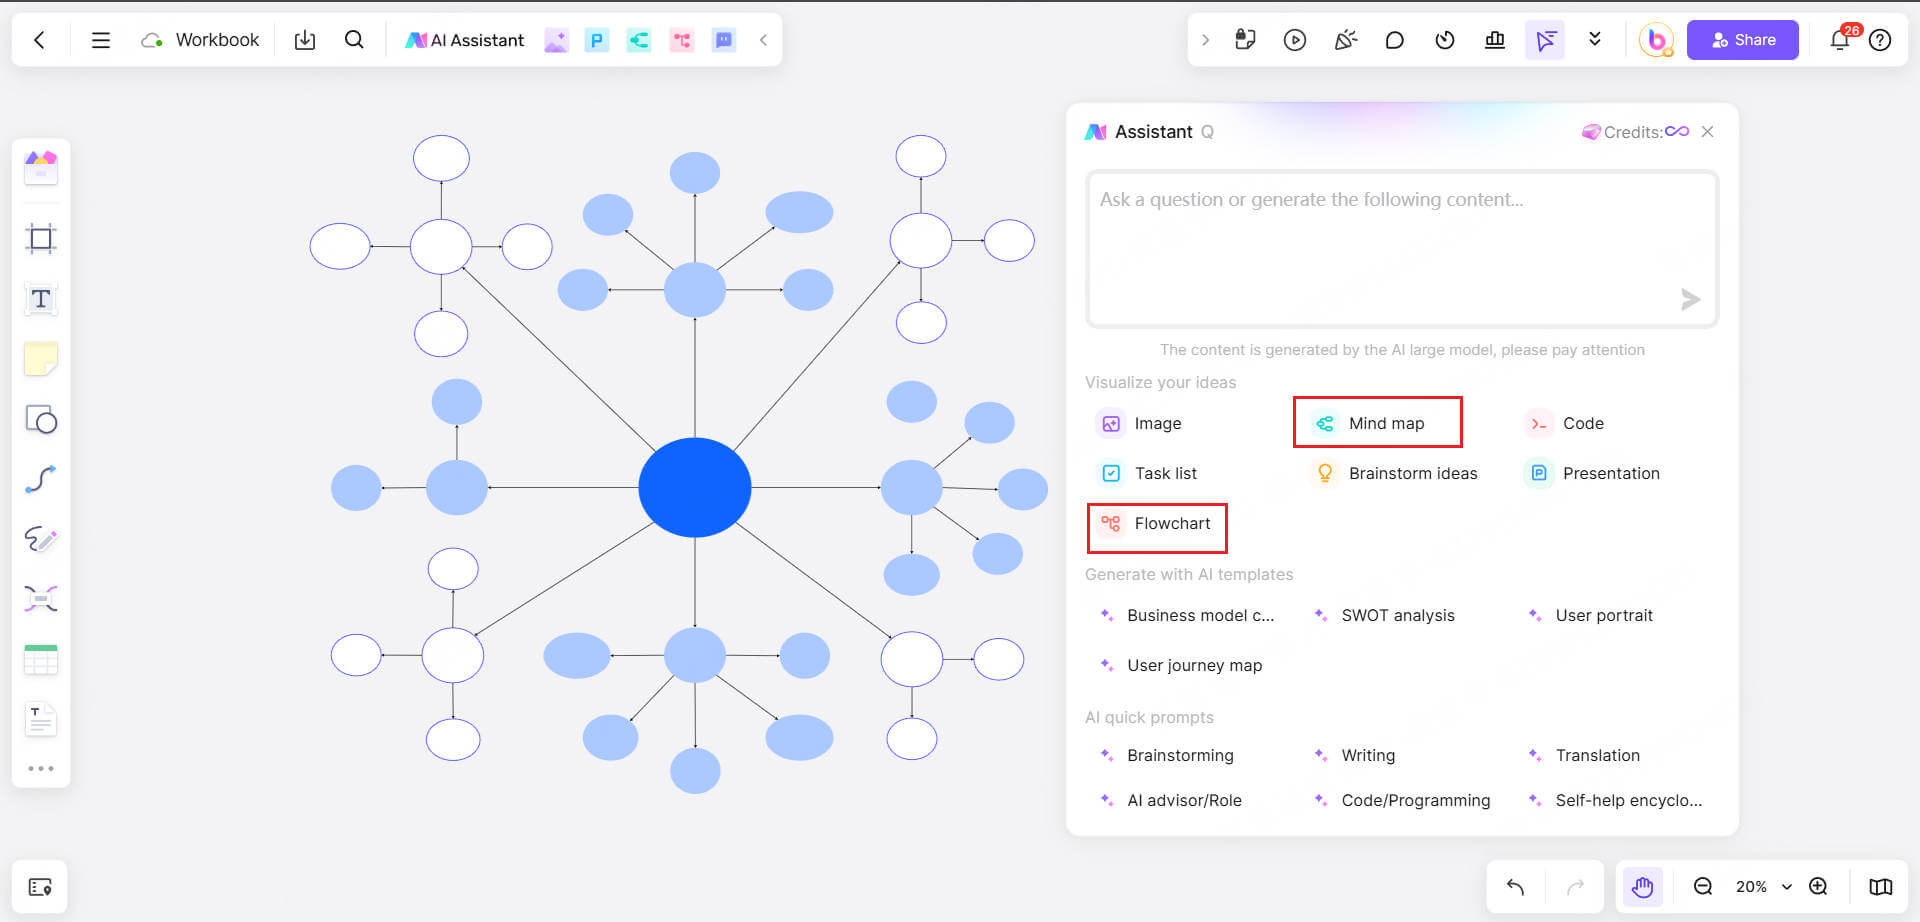
Apply AI assistance: If you need to quickly organize your thoughts, you can use Boardmix AI to generate content suggestions and optimize the thinking process.
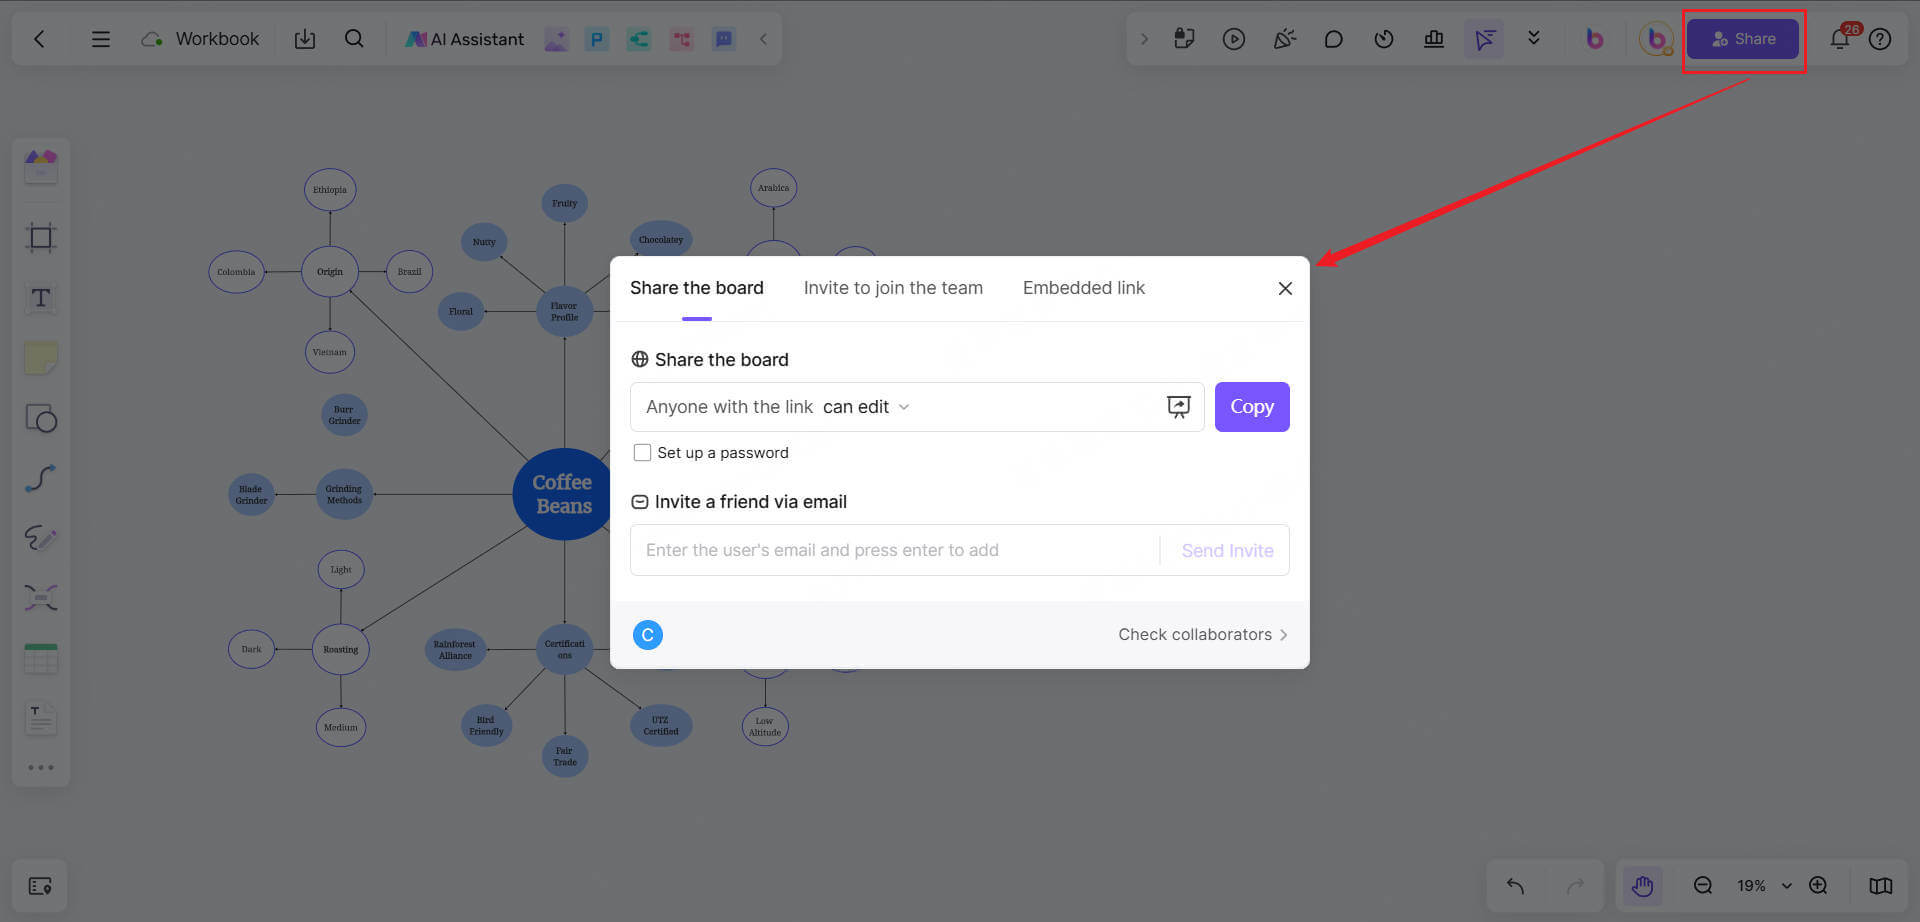
3. Sharing and collaborationyour thinking map
Team collaboration: Invite team members to edit together and view the changes simultaneously, which is suitable for brainstorming, teaching discussions, project planning and other scenarios.
Export and share: After completion, you can export the thinking map to PNG, PDF, SVG and other formats, or directly share the link to colleagues or students.
Now you’re there! Let’s start exploring thinking map template in Boardmix to make your thinking clearer and more organized!
The Bottom Line
The differentiated design of each graphic framework of Thinking Maps can solve specific types of cognitive challenges in a targeted manner. From the Circle Map of concept definition to the Multi-Flow Map of causal reasoning, its combined application can systematically optimize the knowledge construction path. Visualize your thinking with Boardmix now!


