

A use case diagram is a fundamental tool in systems engineering and software development that illustrates how users interact with a system. By mapping out various use cases, these diagrams offer a clear visual representation of functional requirements and user behaviors.
This ultimate guide delves into the essentials of use case diagrams, explaining their purpose, components, examples, and a step-by-step guide on how to make one. Whether you're a seasoned developer or a project manager, understanding these diagrams is crucial for effective system planning and communication. Ready? Let's explore how to use case diagrams can streamline your workflow and improve project outcomes.
What is Use Case Diagram?
A Use Case Diagram is a type of behavioral diagram defined by the Unified Modeling Language (UML). It provides a graphical representation of how a system interacts with external entities known as actors. In simple terms, it is a diagram that illustrates the system's functionality from a user's perspective.
What are the Components of Use Case Diagram?
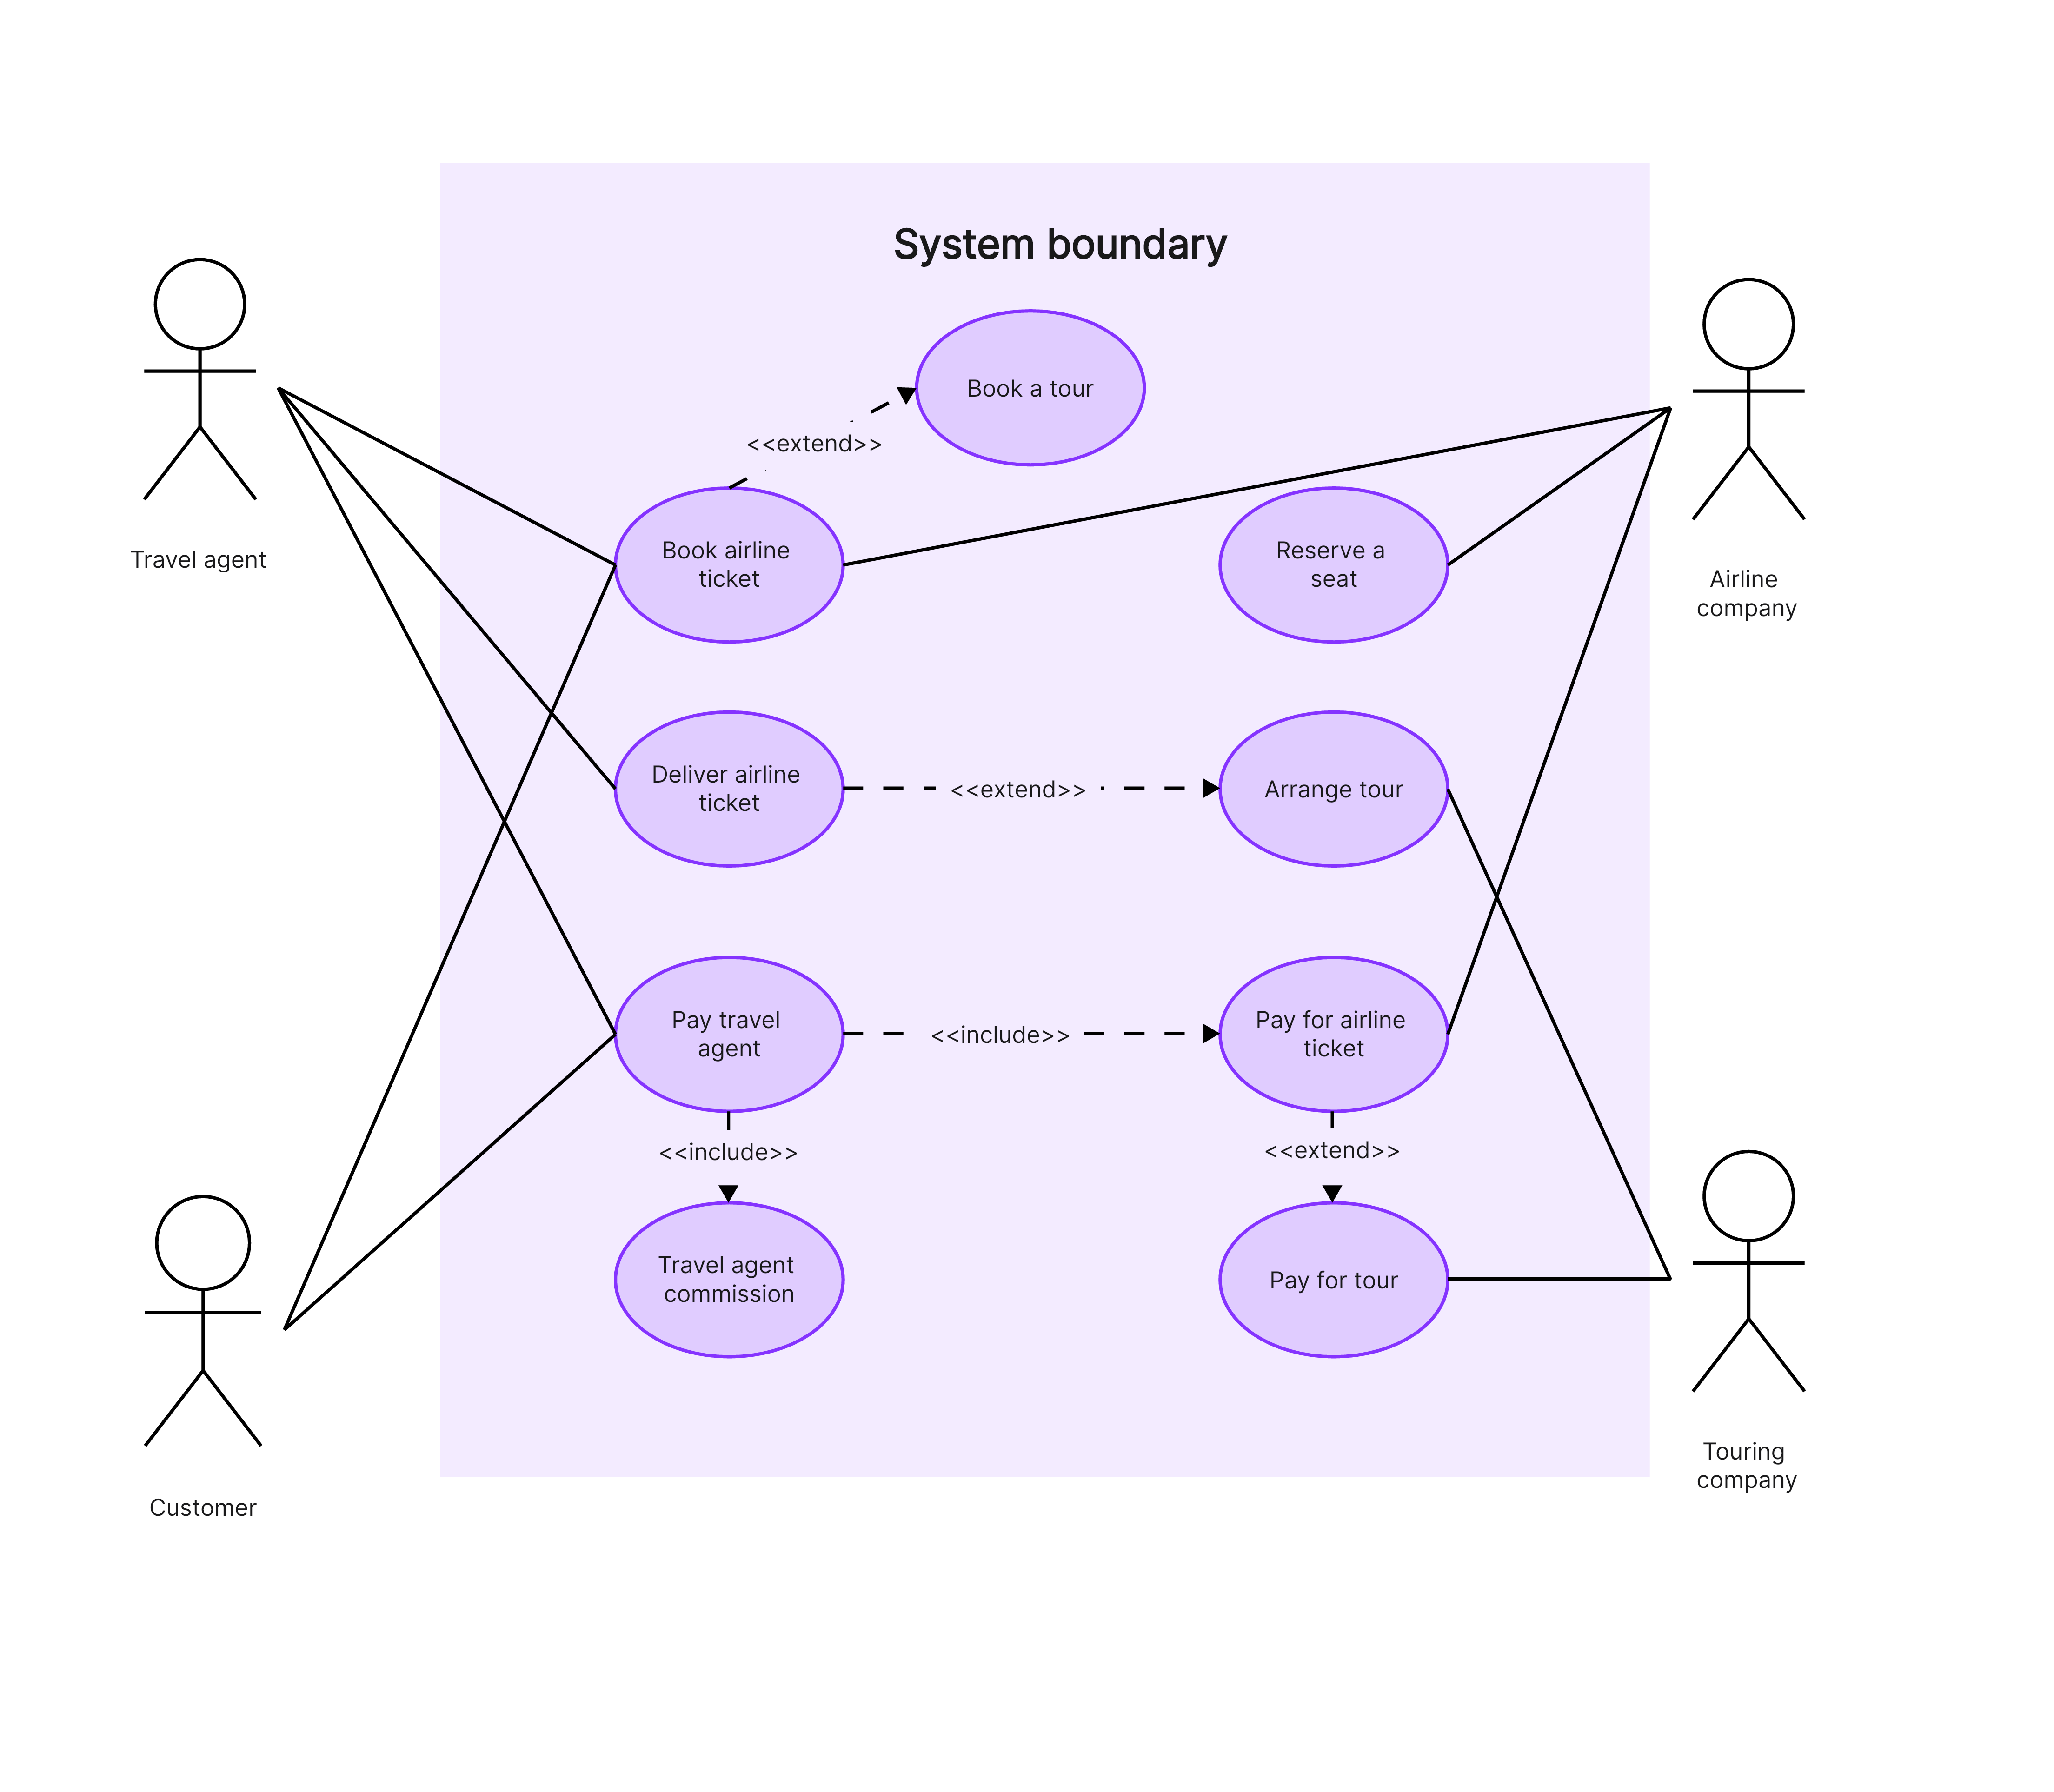
1. Actors
These are the external entities (often end-users) that interact with the system. Actors are depicted as stick figures.
2. Use Cases
These are actions or sequences of events that a system performs to deliver an expected outcome. Use cases are depicted as ovals.
3. System
This is the boundary that defines the scope of what the system will do. The system is shown as a rectangle enclosing use cases.
4. Relationships
These are lines showing the interaction between actors and use cases. They can be of different types, such as "association" (used to describe an interaction), "include" (one use case must invoke another), and "extend" (one use case conditionally adds steps to another).
The Use of a Use Case Diagram
The Use Case Diagram illustrates the interaction between a system and its external entities (actors), which often are end-users, from a user's perspective. The diagram serves several essential purposes:
1. Capturing System Requirements:
Use Case Diagrams help capture the functional requirements of a system. Each use case represents a set of actions the system can perform, providing a clear view of what the system should be capable of doing.
2. Facilitating Communication and Understanding:
One of the significant benefits of Use Case Diagrams is their simplicity and visual nature. They present complex system interactions in a way that's easy for both technical and non-technical stakeholders to understand. This clarity promotes effective communication within the project team and with clients, helping ensure everyone has a shared understanding of the system's goals.
3. Guiding Development and Testing:
Use Case Diagrams can guide the software development process. Developers use them to understand what functionality needs to be built. Similarly, during the testing phase, use cases can inform the creation of test cases. Each use case can be checked to ensure the system performs as expected.
4. Identifying System Interfaces:
Use Case Diagrams can help identify the necessary interfaces between the system and its actors. For example, it could help determine what user interface elements (like buttons or screens) are needed for a user to interact with the system.
5. Enabling System Refinement:
As the system development progresses, Use Case Diagrams can be updated to reflect changes or enhancements, ensuring they continue to provide an accurate overview of the system.
Why Use Case Diagrams in System Design is Crucial?
1. User-Centric Approach
Use Case Diagrams provide a user-focused approach to system design, promoting understanding of the user's needs and requirements.
2. Clarity and Simplification
By visualizing the functionality of the system, these diagrams can make complex processes easier to understand, promoting clear communication among stakeholders.
3. Identify Errors Early
Use Case Diagrams can help identify errors or inconsistencies in the initial stages of system design, saving time and resources down the line.
4. Basis for Test Cases
They can serve as a starting point for devising test cases during the testing phase of the software development lifecycle.
In essence, a Use Case Diagram is a powerful tool that aids in understanding, designing, and improving a system while ensuring it aligns with user requirements.
What are Include and Extend in Use Case Diagrams?
"Include" and "Extend" are two kinds of relationships in Use Case Diagrams. They are used to depict interactions between different use cases, enabling the reuse of common functionality.
Include Relationship
An "include" relationship is used when one use case (the base use case) incorporates the behavior of another use case (the included use case). This is represented by a dashed arrow labeled "<
For example, consider a "Make Online Purchase" use case for an e-commerce application. This base use case would include other use cases like "Select Product", "Add Product to Cart", and "Checkout".
Extend Relationship
An "extend" relationship is used when the behavior of a use case (the extension use case) extends the behavior of another use case (the base use case). This relationship is represented by a dashed arrow labeled "<
For example, consider a "Checkout" use case in our e-commerce scenario. This base use case might be extended by optional use cases like "Apply Coupon Code" or "Choose Gift Wrapping". These extensions only occur if the user chooses to apply a coupon or select gift wrapping during checkout.
In summary, both "include" and "extend" relationships in Use Case Diagrams allow for modularity and reuse of functionality, promoting better organization and understanding of complex systems. However, it's crucial to remember that an "include" relationship indicates mandatory behavior, while an "extend" relationship depicts optional, conditional behavior.
Exploring Use Case Diagram Maker: Create One Easily and Effectively
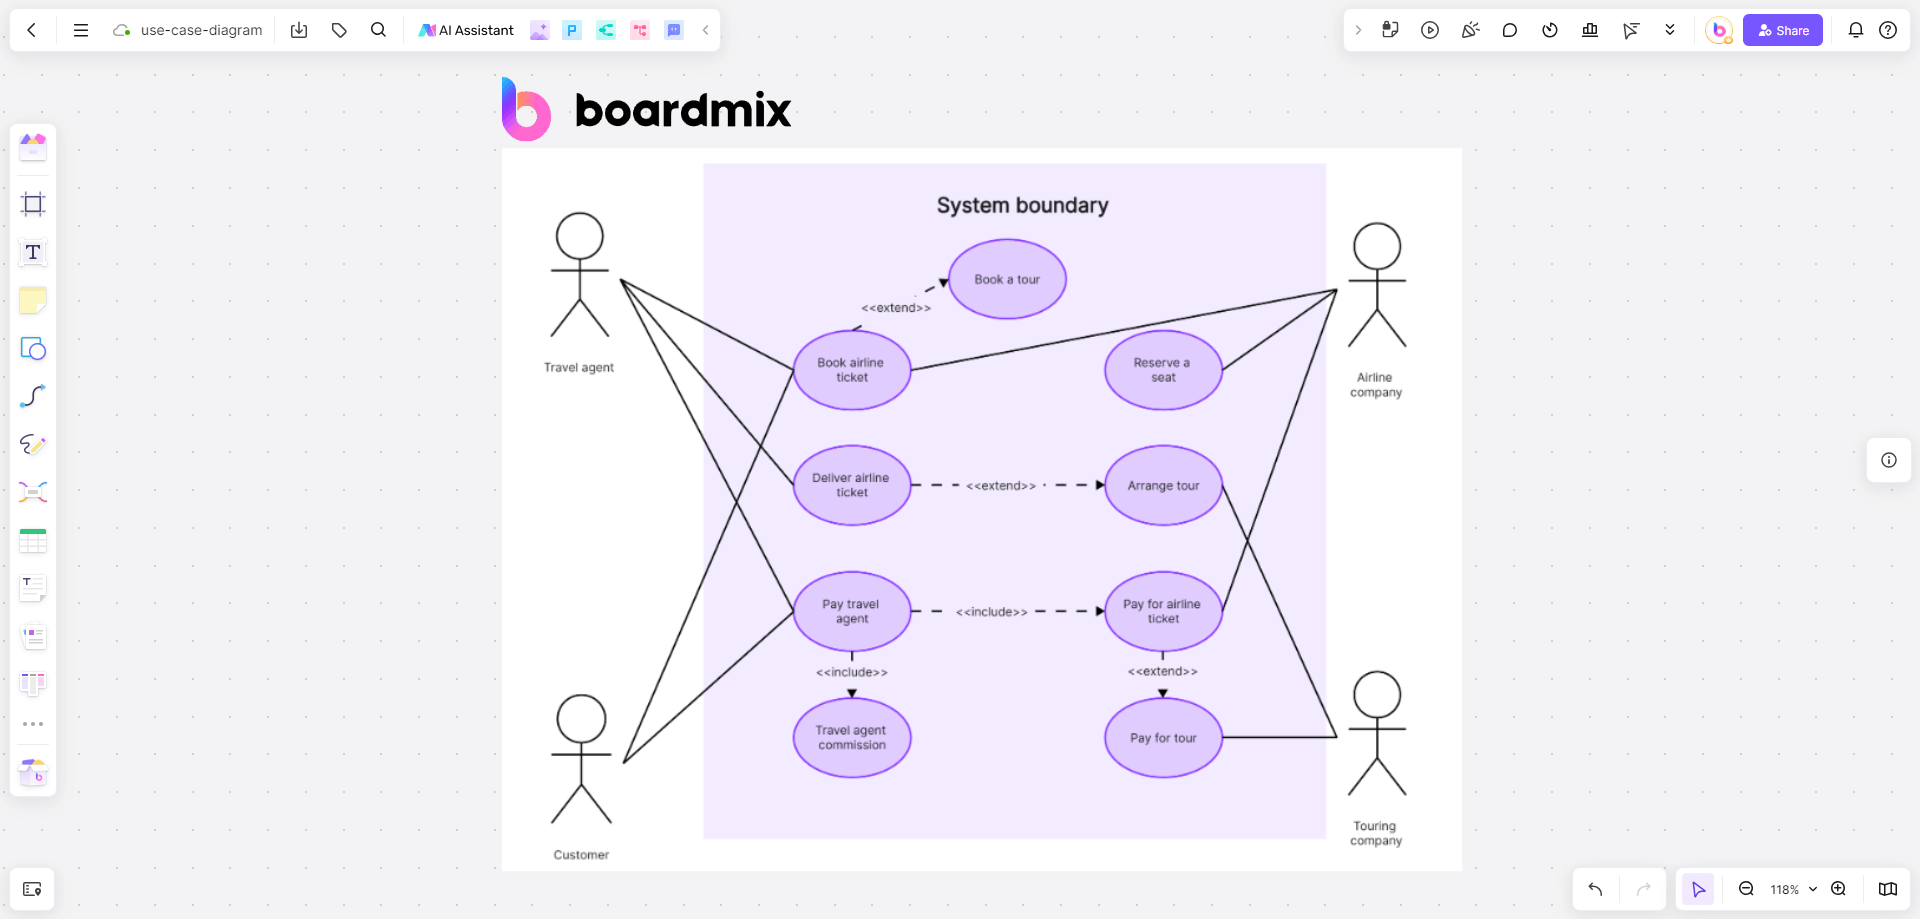
Boardmix is an online diagram maker that offers the features and tools needed to create clear, understandable Use Case Diagrams effectively and efficiently. It helps bridge communication gaps between technical and non-technical stakeholders, ensuring everyone understands the system's functionality from a user's perspective.
How to Make Use Case Diagram with Boardmix
Creating a Use Case Diagram in Boardmix is a straightforward process that helps visualize the interactions between different users (or actors) and your system. Here is a step-by-step guide:
Step 1: Open Boardmix
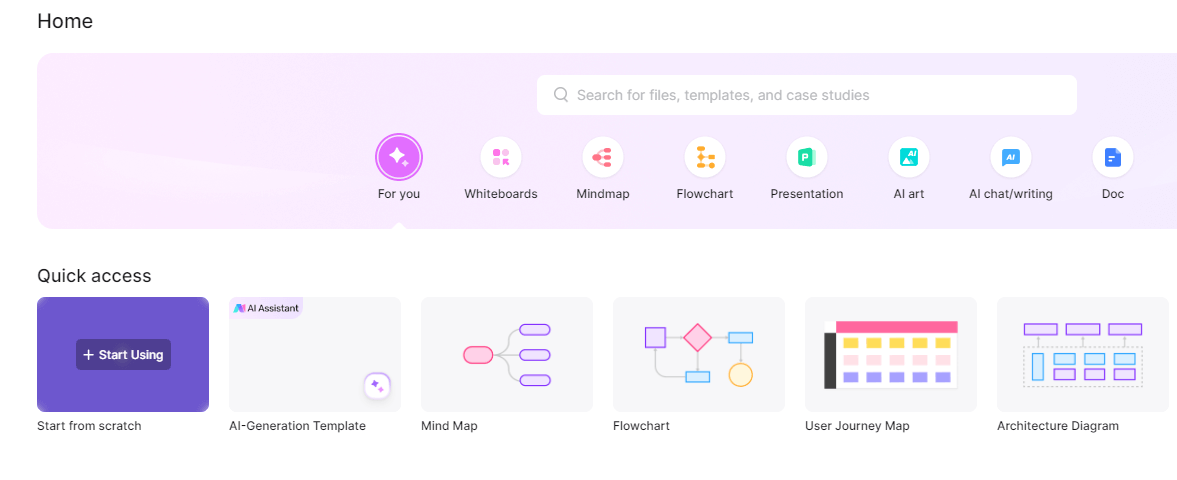
Launch Boardmix on your device and select the 'New board' option to start a new project.
Step 2: Choose Use Case Diagram Temple
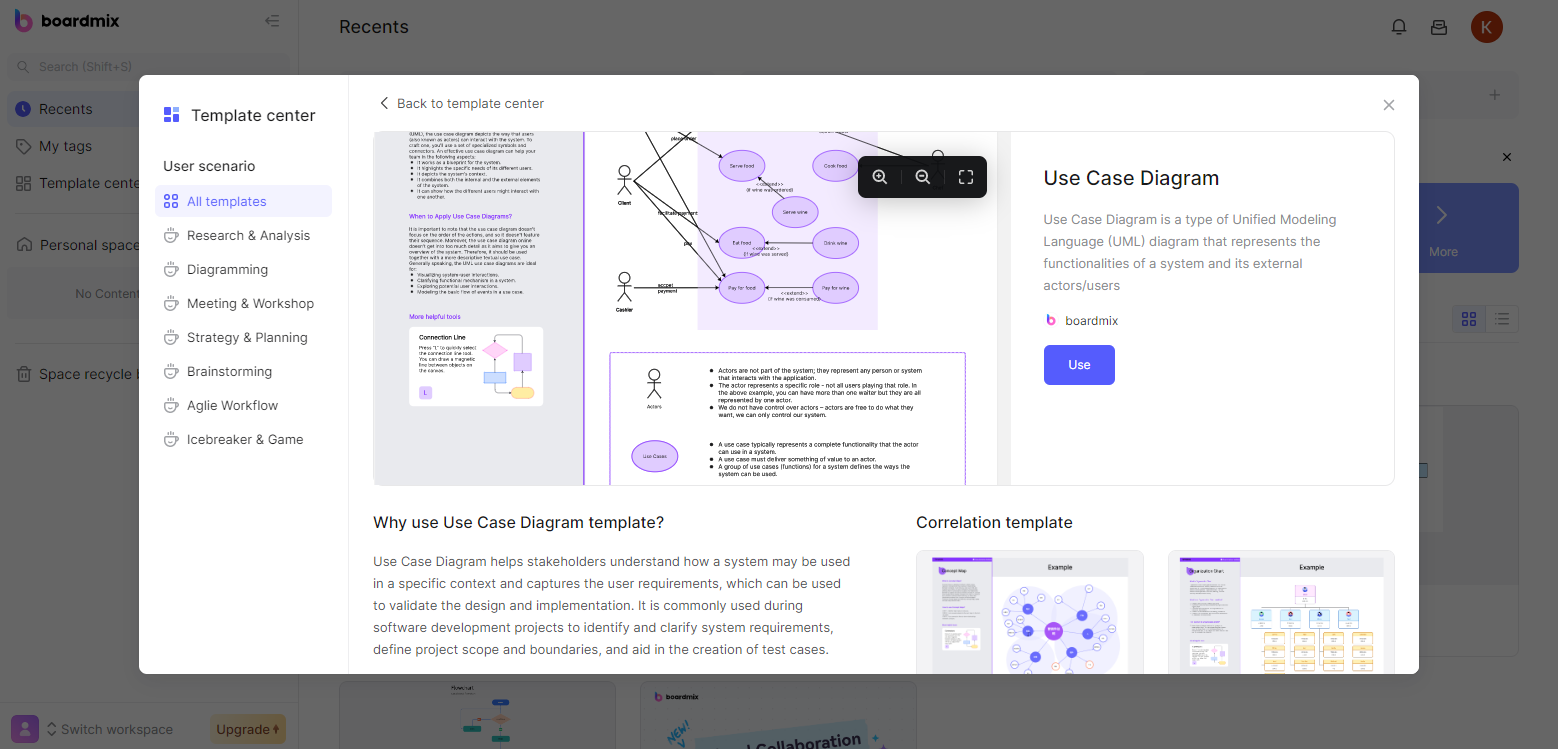
You can also start with a ready-made 'Use Case Diagram' on the template library, saving a lot of time.
Step 3: Define the System
Identify the system for which you are creating the diagram. This could be any product, service, or application that requires user interaction. Enter its name in the 'System Name' field.
Step 4: Identify the Actors
Determine the external entities, or actors, that will interact with your system. These could be end users, other systems, roles, etc. You can add an actor by clicking on the 'Actor' button and dragging it to the work area. Name each actor appropriately.
Step 5: Identify the Use Cases
Decide the tasks or functions (use cases) that your system should perform in response to user interactions. For each use case, click on the 'Use Case' button and drag it to the work area. Be sure to give each use case a descriptive name.
Step 6: Establish Relationships
Now, determine how each actor interacts with the use cases. Draw lines between actors and use cases to represent these relationships.
Step 7: Refine and Review
Once you've mapped out all actors and use cases, review the diagram to ensure it accurately represents all user-system interactions. Make any necessary adjustments.
Step 8: Save and Share
Finally, save your Use Case Diagram. Boardmix allows you to share it with your team or export it in various formats for further analysis or documentation.
Tips for Making Effective Use Case Diagrams
1. Simplicity is keyAvoid unnecessary complexity in your diagrams. They should be easy to understand at a glance.
2. Focus on the userAlways keep in mind that Use Case Diagrams are about capturing functionality from a user's perspective.
3. Be clear and descriptiveWhen naming your actors and use cases, use clear, descriptive language that summarizes their role or function.
4. Avoid overcrowdingDon't clutter your diagram with too many elements or relationships. If it starts looking too complex, consider breaking it down into multiple diagrams for clarity.
5. Collaborate and reviewInvolve all relevant stakeholders in the creation and review of your Use Case Diagrams to ensure everyone has the same understanding.
Why Use Boardmix to Make Use Case Diagrams?
Boardmix is a highly effective tool for creating Use Case Diagrams due to several reasons.
1. User-Friendly Interface
Boardmix offers an intuitive and easy-to-use interface, making it suitable even for those without much technical expertise.
2. Extensive Template Library
Boardmix provides a library of templates for different types of diagrams, including Use Case Diagrams. These templates can be a great starting point, especially if you're new to creating these diagrams.
3. Collaborative Features
One of the key strengths of Boardmix is its collaboration features. You can easily share your diagrams with team members, clients, or other stakeholders and get their feedback in real-time. This ensures everyone has the same understanding and agreement on the system's requirements.
4. Customization Options
With Boardmix, you can customize your Use Case Diagrams with different colors, text formats, and more to make them more clear and attractive.
5. Cross-Platform Compatibility
Boardmix is accessible across various devices and platforms, so you can create and edit your diagrams whether you're on a PC, a smartphone, or a tablet.
6. Saving and Exporting Flexibility
Boardmix allows you to save your diagrams directly to your device or cloud storage. Plus, you have the flexibility to export your diagrams in several formats like PDF, PNG, or JPG for easy sharing or documentation purposes.
Boardmix offers the features and tools needed to create clear, understandable Use Case Diagrams effectively and efficiently. It helps bridge communication gaps between technical and non-technical stakeholders, ensuring everyone understands the system's functionality from a user's perspective.
10 Examples of Use Case Diagrams
In this section, let's discover the power of use case diagrams with our curated list of 10 compelling Use Case Diagram examples. These diagrams, showcasing various business use cases, serve as indispensable tools for visualizing system functionalities and interactions. Each example of a diagram provides clear, practical insights into real-world applications across diverse industries.
Online ticket booking system use case diagram
The use case diagram of the online ticket booking system is a type of chart used to display the functions of the online ticket booking system and user interaction. In the online ticket booking system, use case diagrams usually include users (such as passengers, administrators), and the main functions of the system, such as ticket price enquiries, ticket reservations, and order cancellations.
The online ticket booking system is a product of the development of the Internet and network business. The emergence and application of such systems have expanded the business area of ticket sales and enriched the methods and means of bill business marketing. The online ticket booking system diagram helps to analyze and understand the system's functional requirements. By identifying participants and use cases, you can clearly understand the interaction between the system and external entities.
Remote network teaching system use case diagram
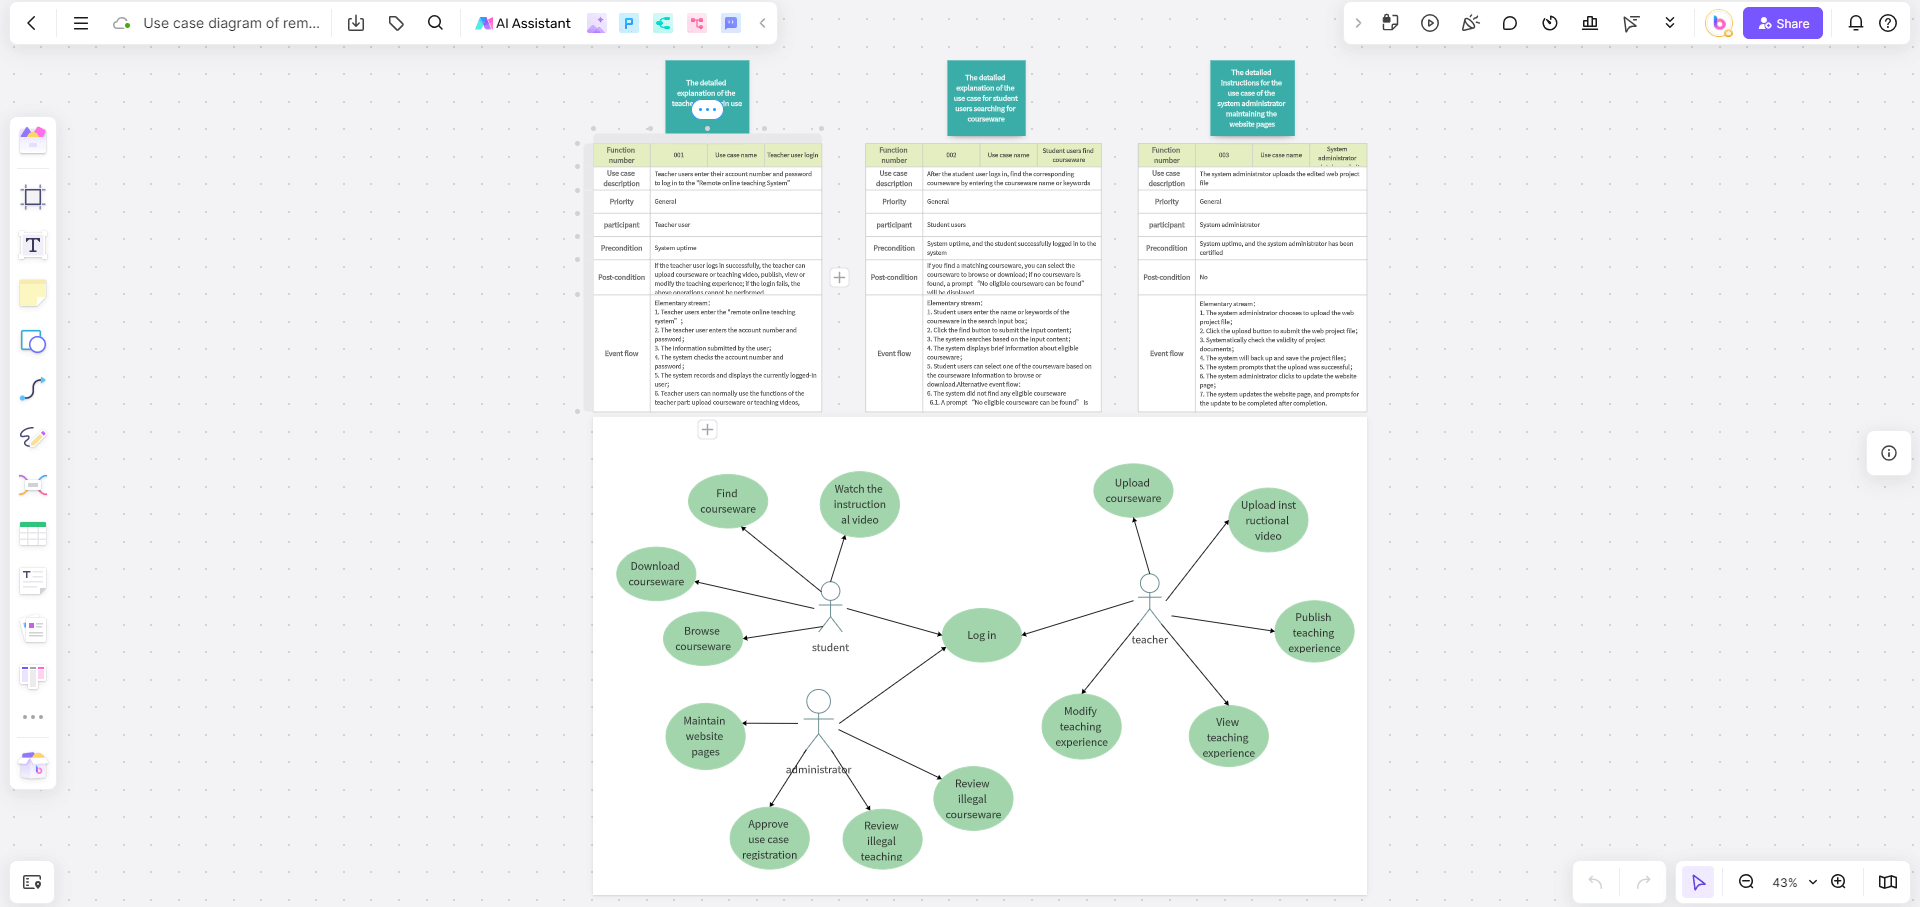
The use case diagram of the remote network teaching system is a visual tool that showcases the functions and user behaviors of the remote network teaching system. This diagram typically consists of three elements: use cases, actors, and system boundaries, which are used to describe the functional requirements of the system and the needs of users.
In a remote network teaching system, the use case diagram can display the interactive relationship between students, teachers, administrators, and other participants with the system, and the functions of the system. It aids in understanding the usage scenarios and business processes of the system, supporting the analysis and design of system requirements. The use case diagram for the remote network teaching system, provides a foundation for system design, assisting teams in better organizing and planning the functional modules and interactive processes of the system.
Online shopping use case diagram
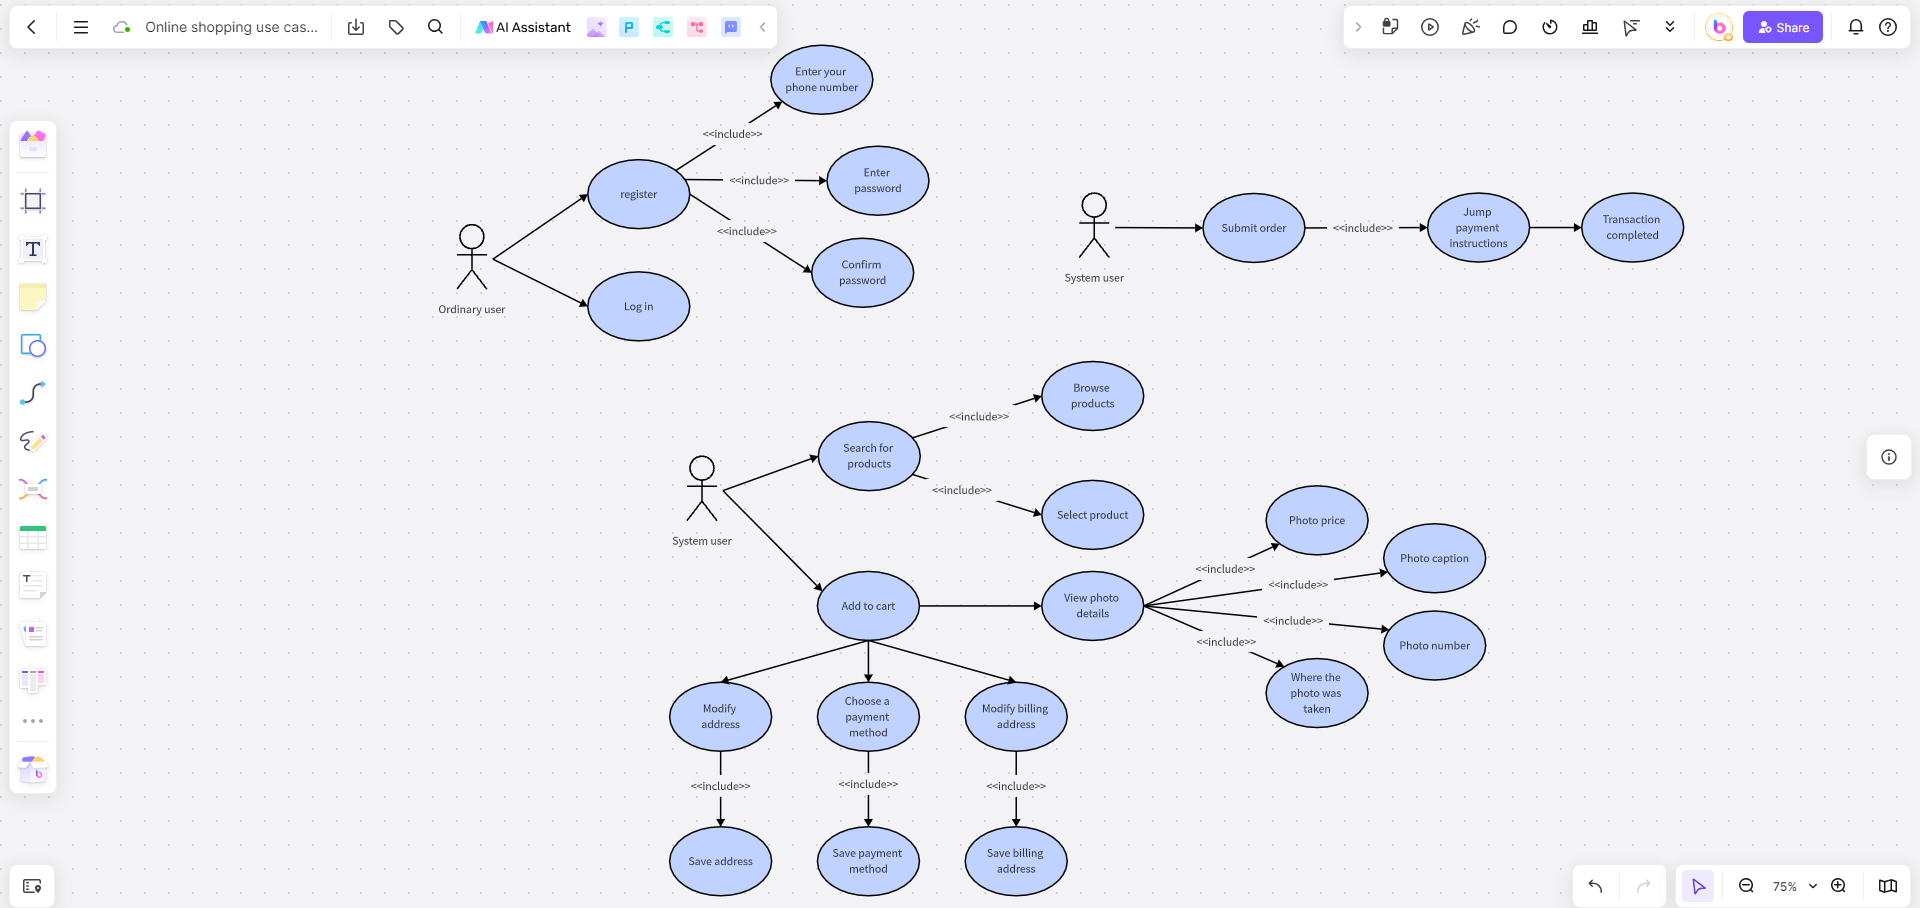
The use case diagram for online shopping is a graphical tool used to describe the functionalities within an online shopping system and the interactions between the users and the system. It represents system functionalities (use cases) in ellipse shapes and the interactions between users and the system with arrows, showcasing the relationships among different functional modules within the system and the user scenarios. As the basis for requirement analysis, the online shopping use case diagram can assist the system design and development team in determining the functions and interaction flow of the system. It can guide the system design and development process, ensuring the integrity and consistency of system functionalities.
Student management system use case diagram
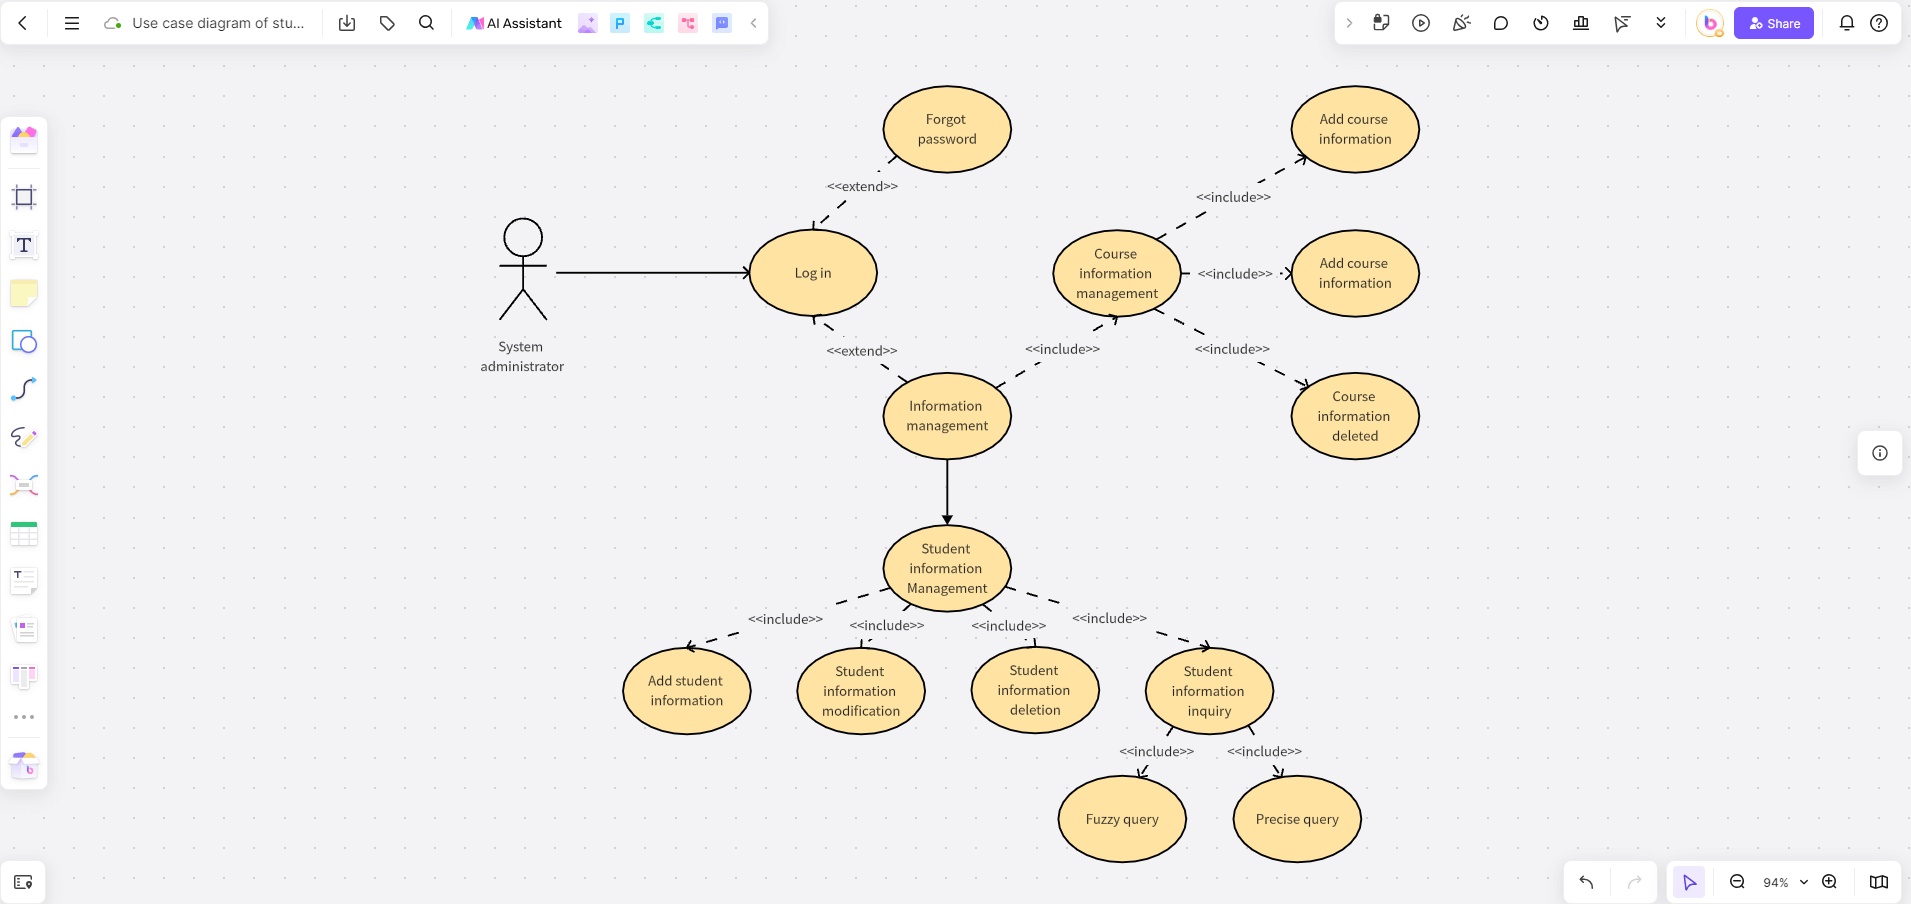
The use case diagram of the student registration management system is a graphical tool used to describe the interaction between the features of the system and users. The use case diagram clearly illustrates the various functions within the student registration management system, including student information management, course management, and grade management, among others. By using the use case diagram, one can intuitively understand the range of system capabilities and the relationship between each function. The use case diagram is beneficial for planning and managing the system's functions in the early stages of a project. Through this diagram, it is possible to identify and manage the key features of the system, which facilitates the formulation of project plans and priorities. The graphical representation contributes to a clearer communication of the system's capabilities and user requirements, promoting understanding and consensus among all parties.
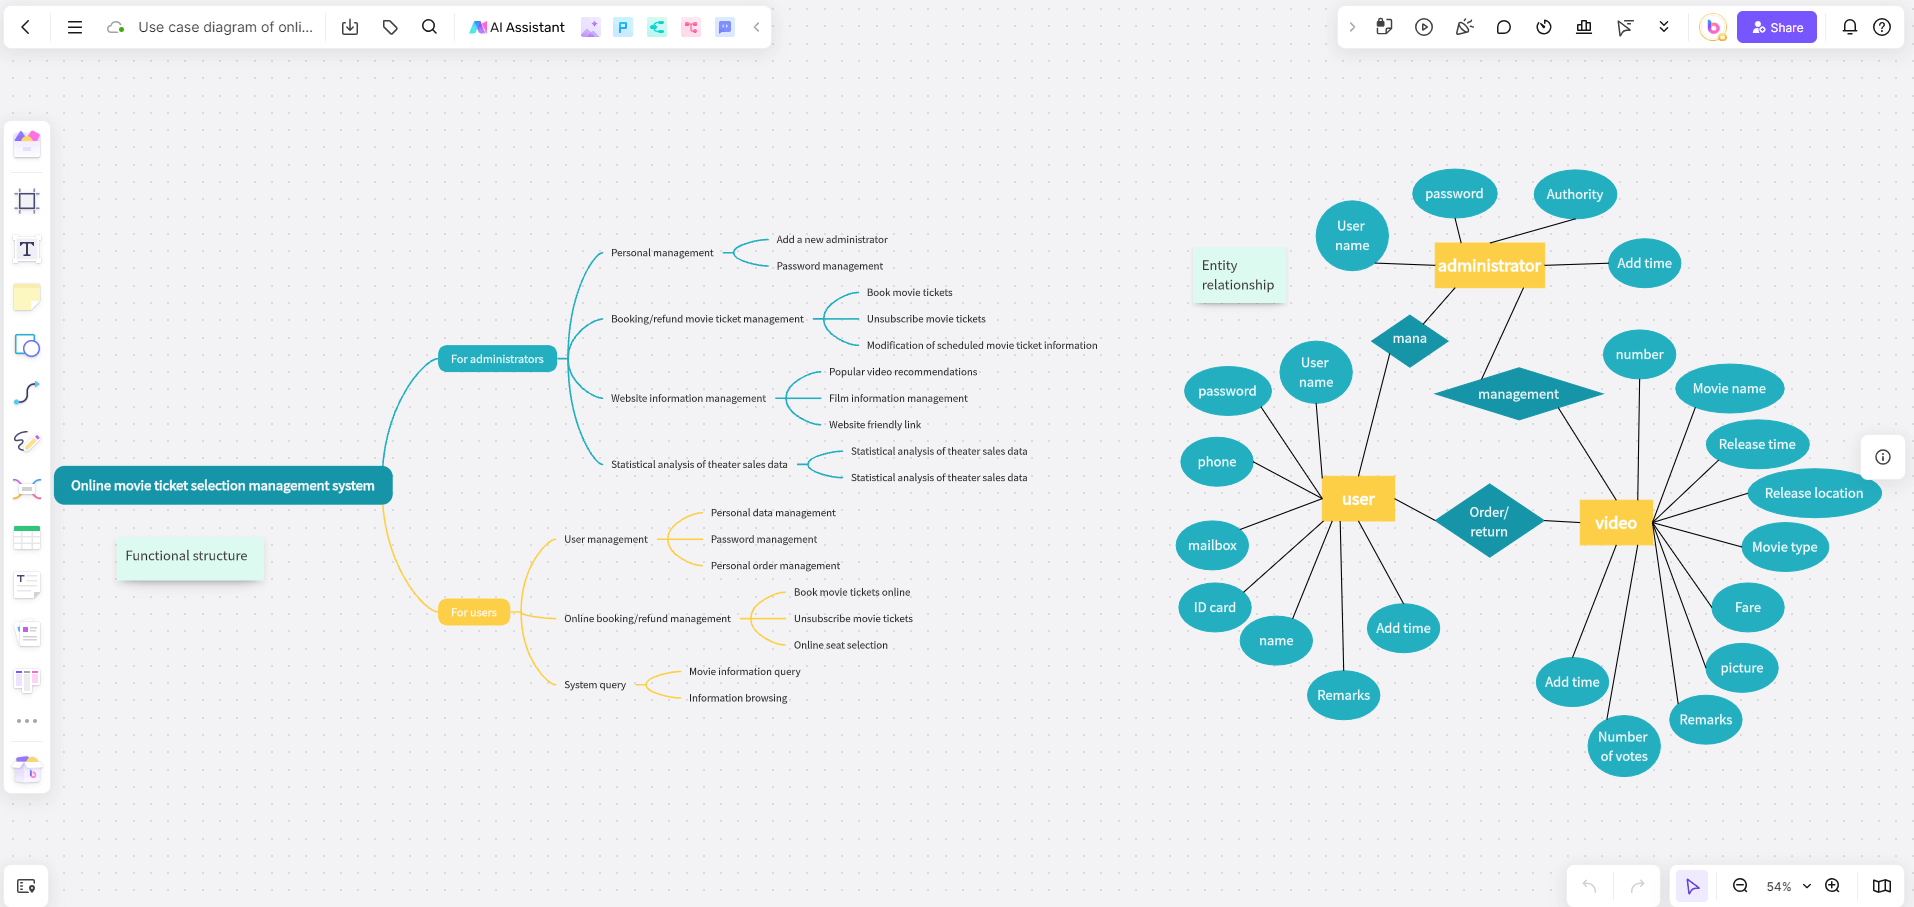
Cinema management use case diagram
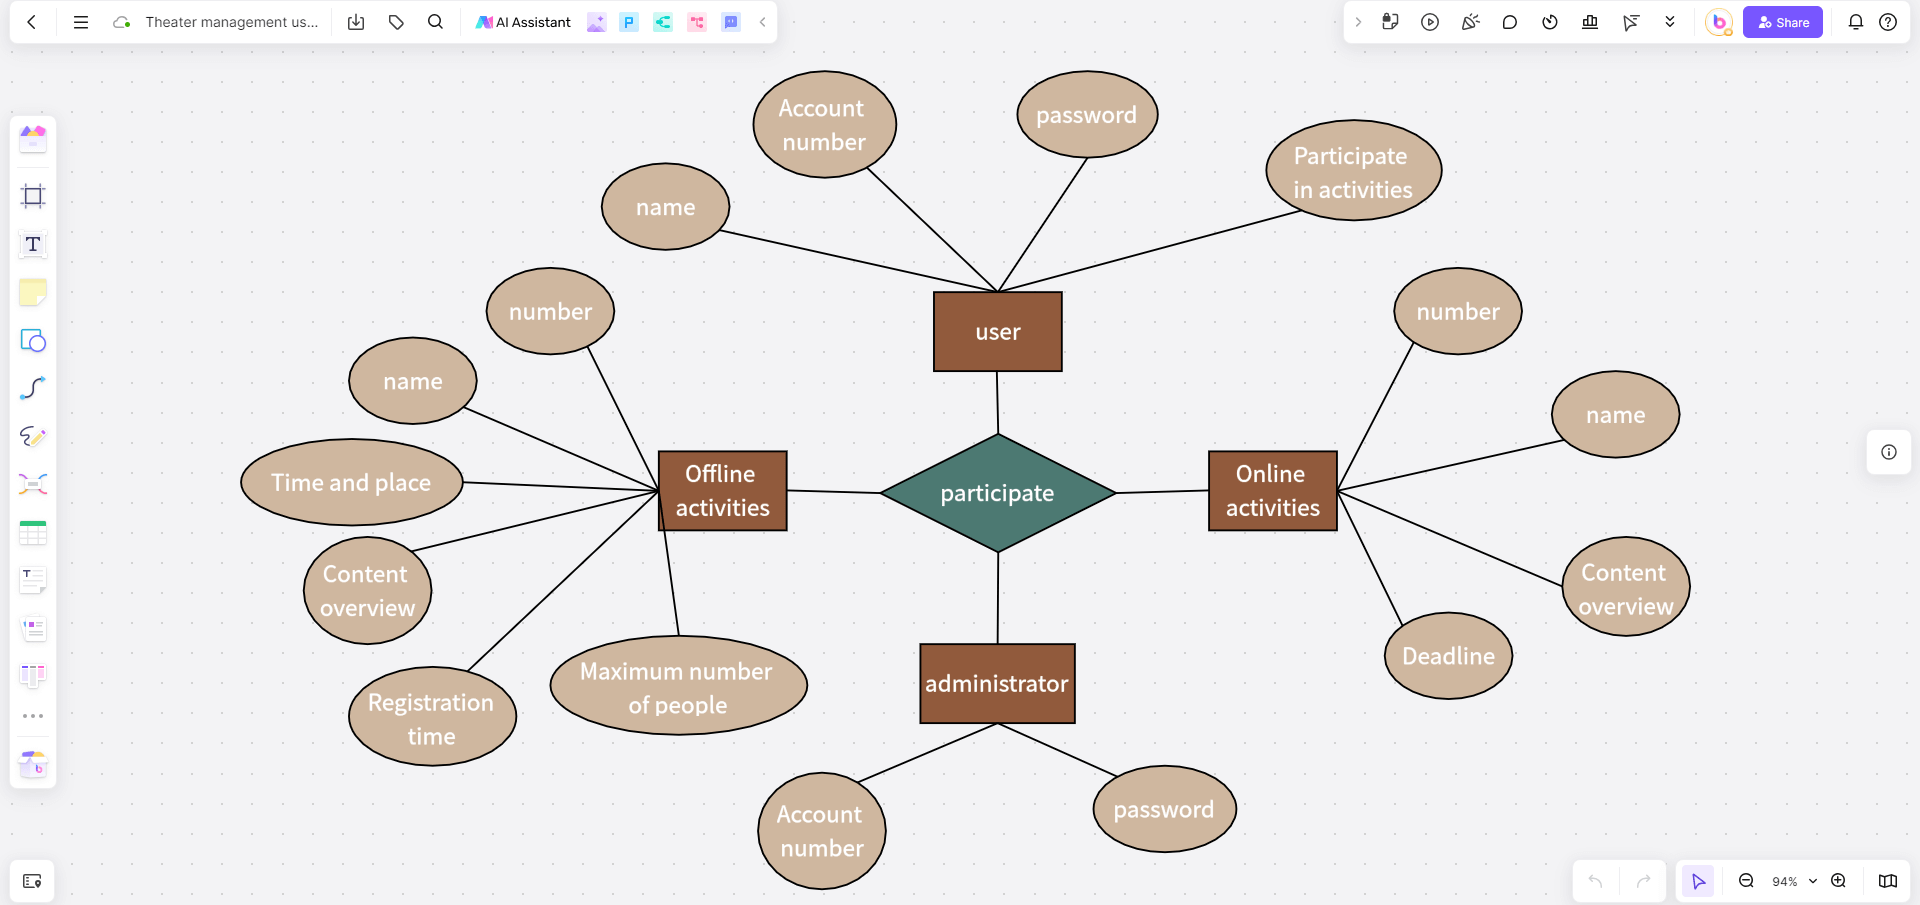
The cinema management use case diagram is a chart used to describe the interaction between various functional modules of the cinema management system and the users. It primarily includes various user operations and system responses. The cinema management use case diagram can be used in aspects such as requirement analysis and system design. The use case diagram provides a basis for system design, helping designers to better understand user requirements, thereby improving the architecture and design of the system.
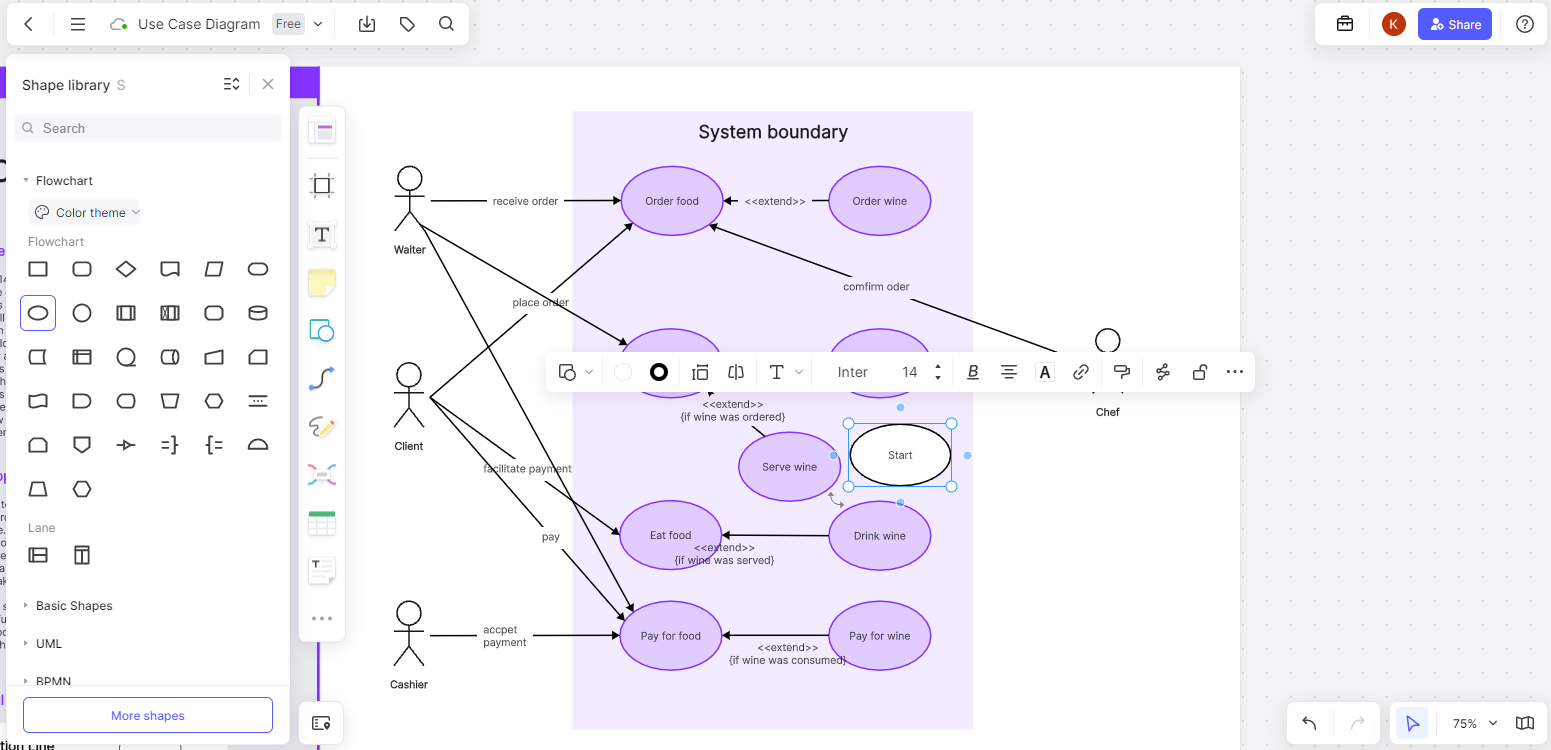
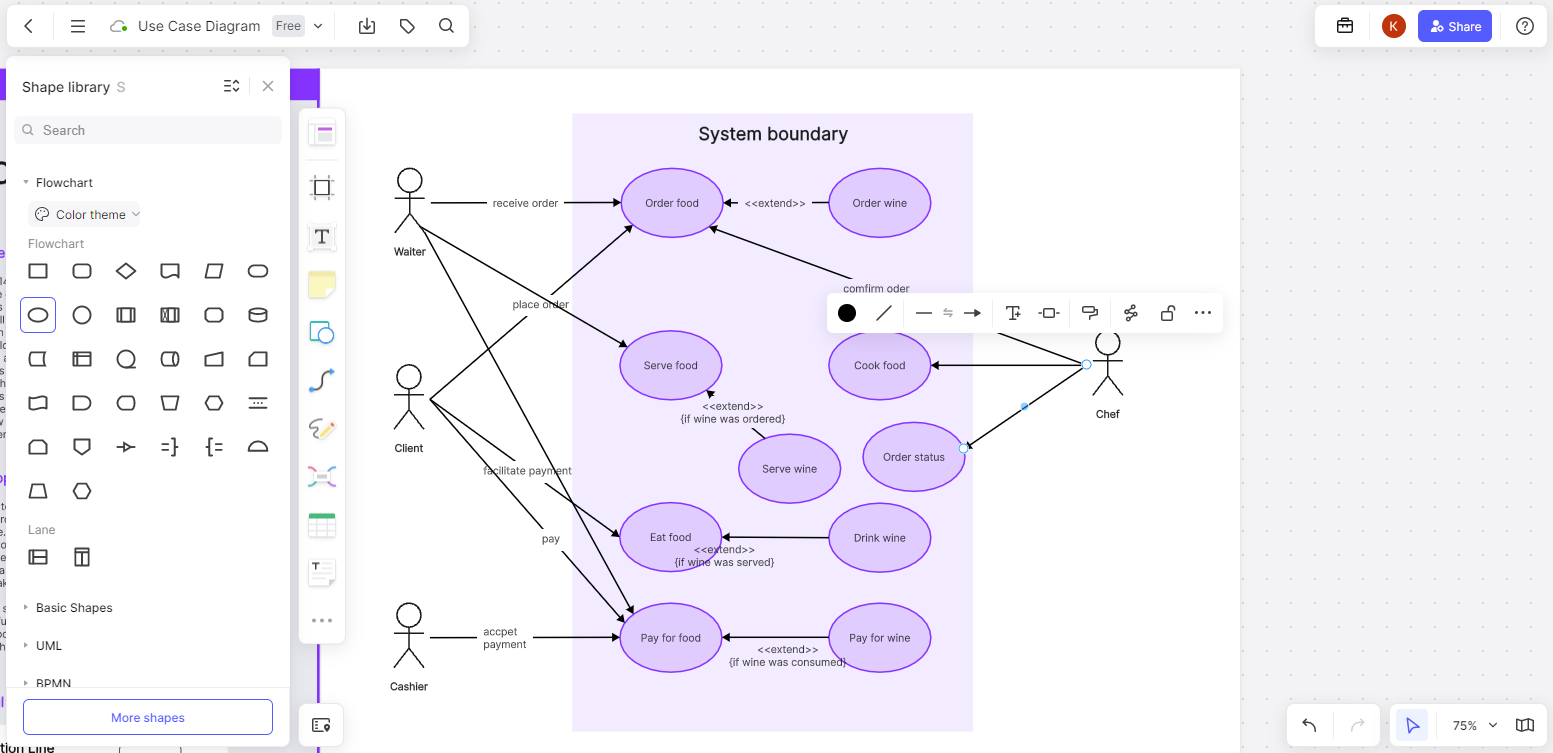
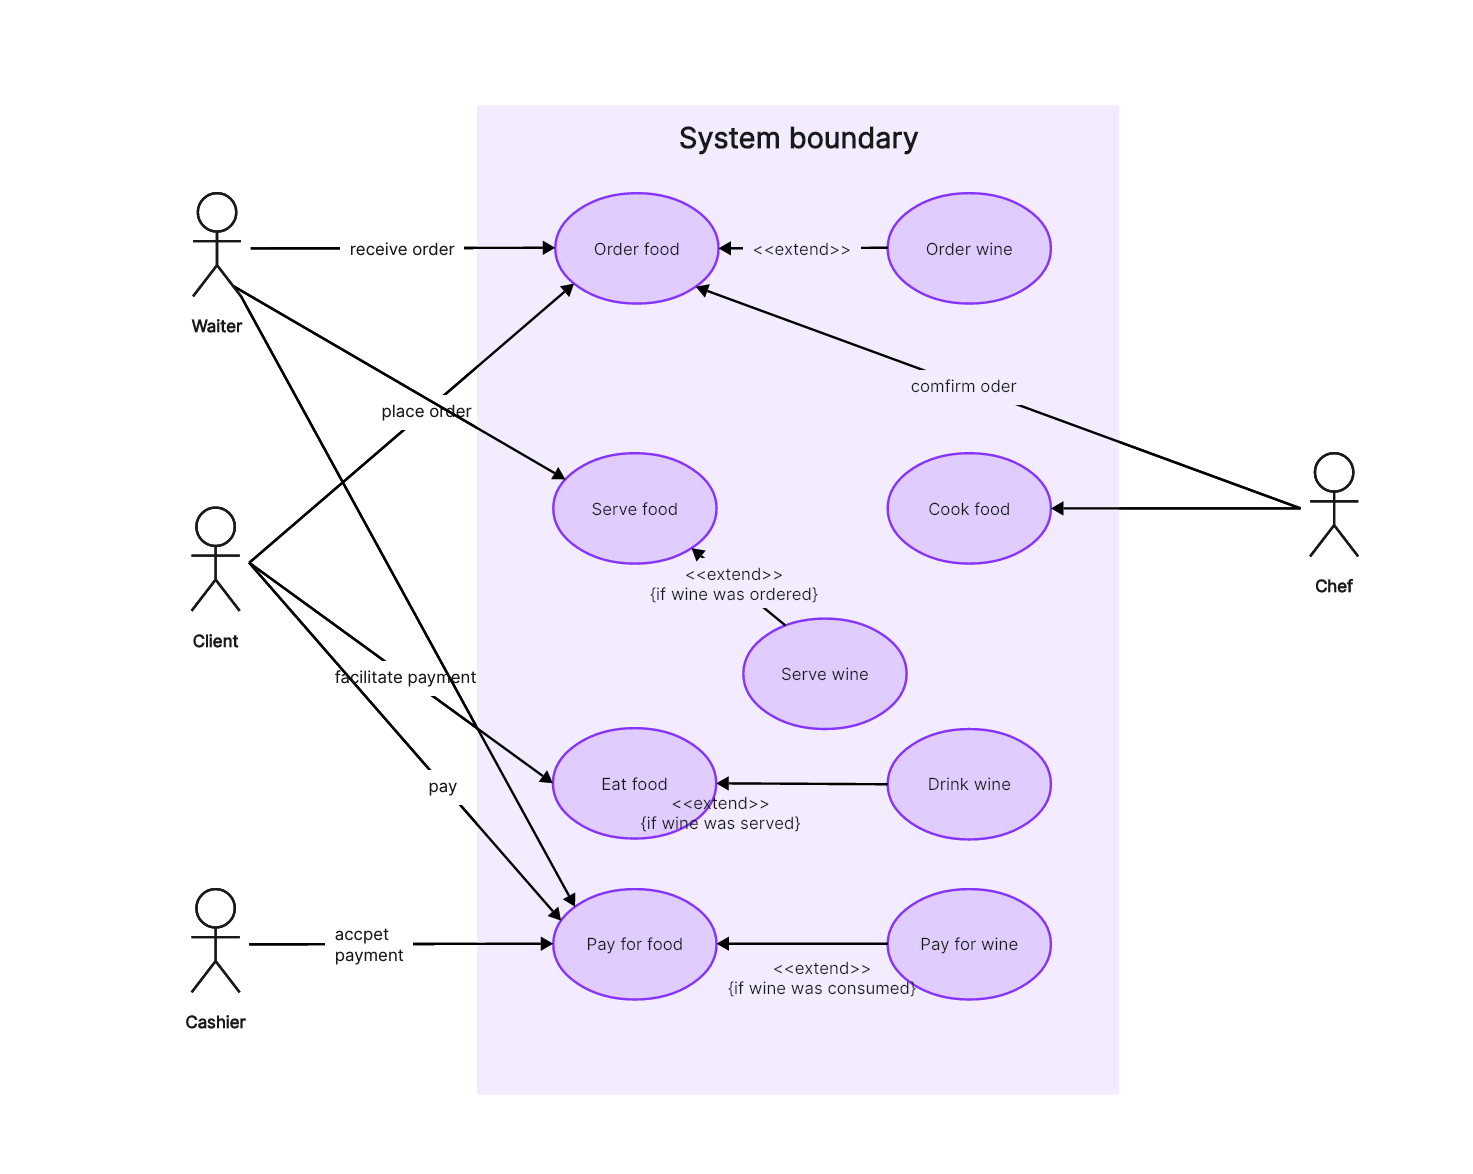
Restaurant management system use case diagram
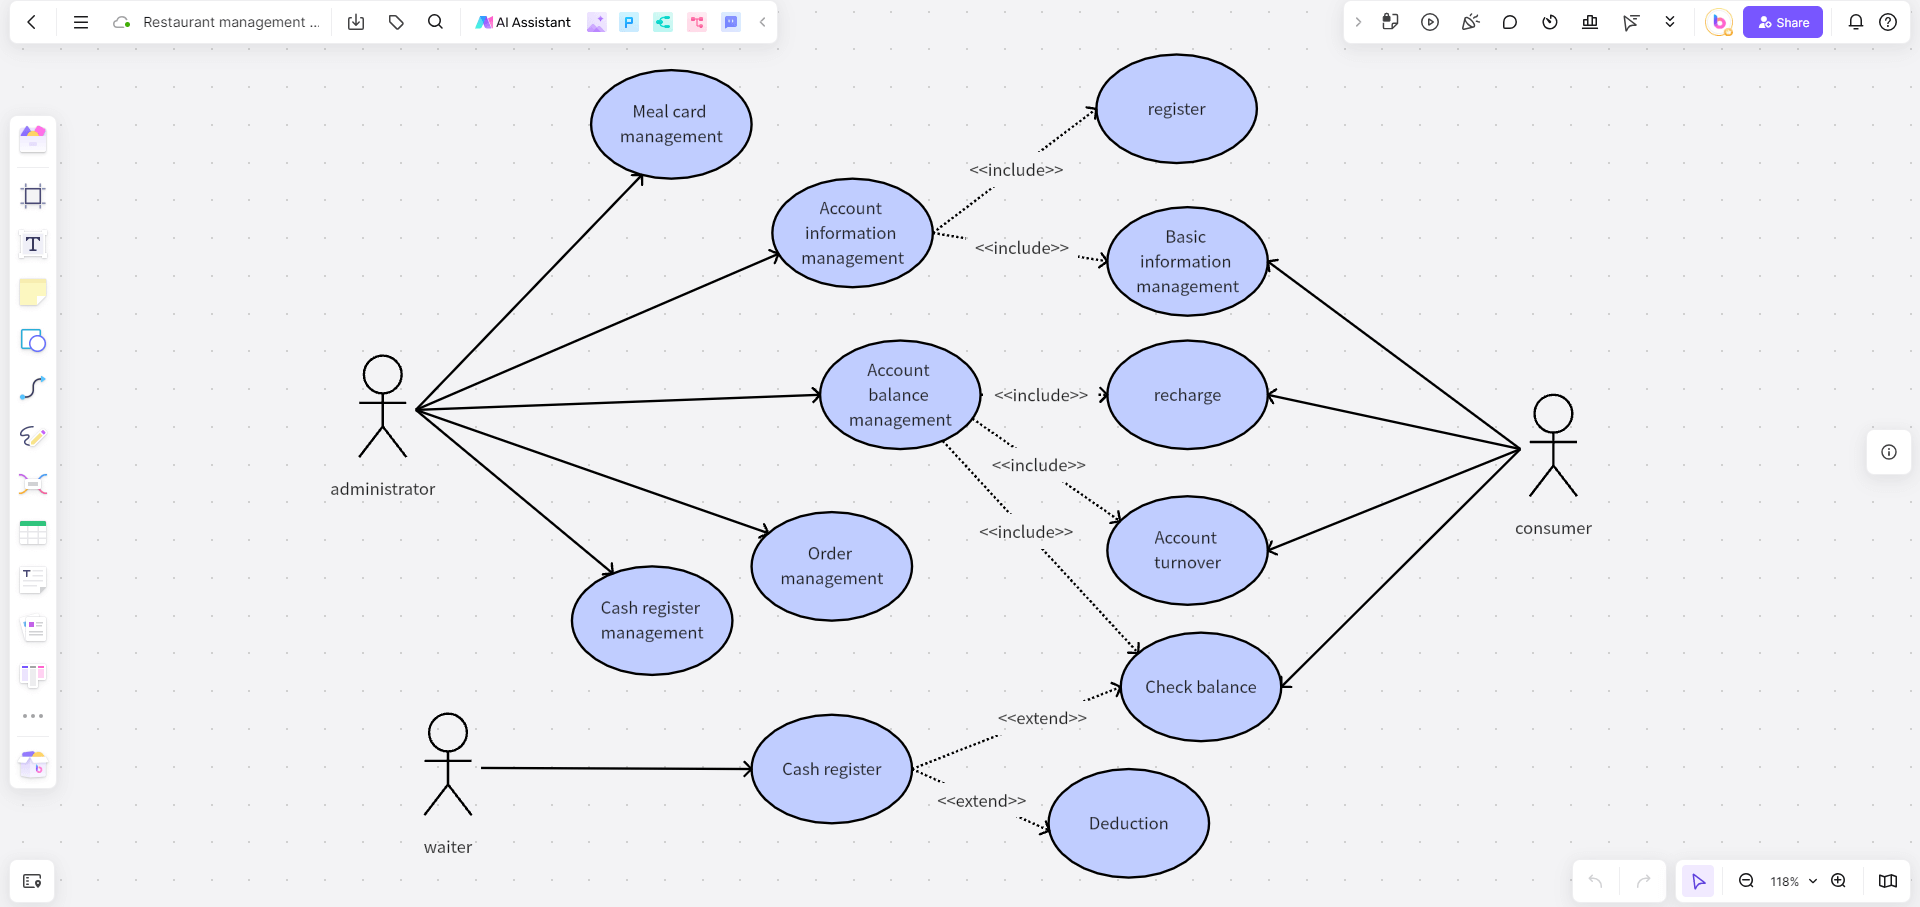
The use case diagram of a restaurant management system usually consists of four basic elements: actors, use cases, system boundaries, and relationships. Actors represent system user roles, Use cases represent functional requirements within the system, System boundaries indicate the boundary between the system and the outside world, and Relationships describe the interaction between actors and use cases.
The use case diagram of the restaurant management system plays an important role in the system design, development, and requirement validation process. It visually demonstrates the functional requirements and interaction process of the system, helping team members better understand the system, define actor roles and system boundaries, optimize the relationship between use cases, ensure the system meets user requirements, and provide an efficient and convenient management service for the restaurant.
Library management system use case diagram
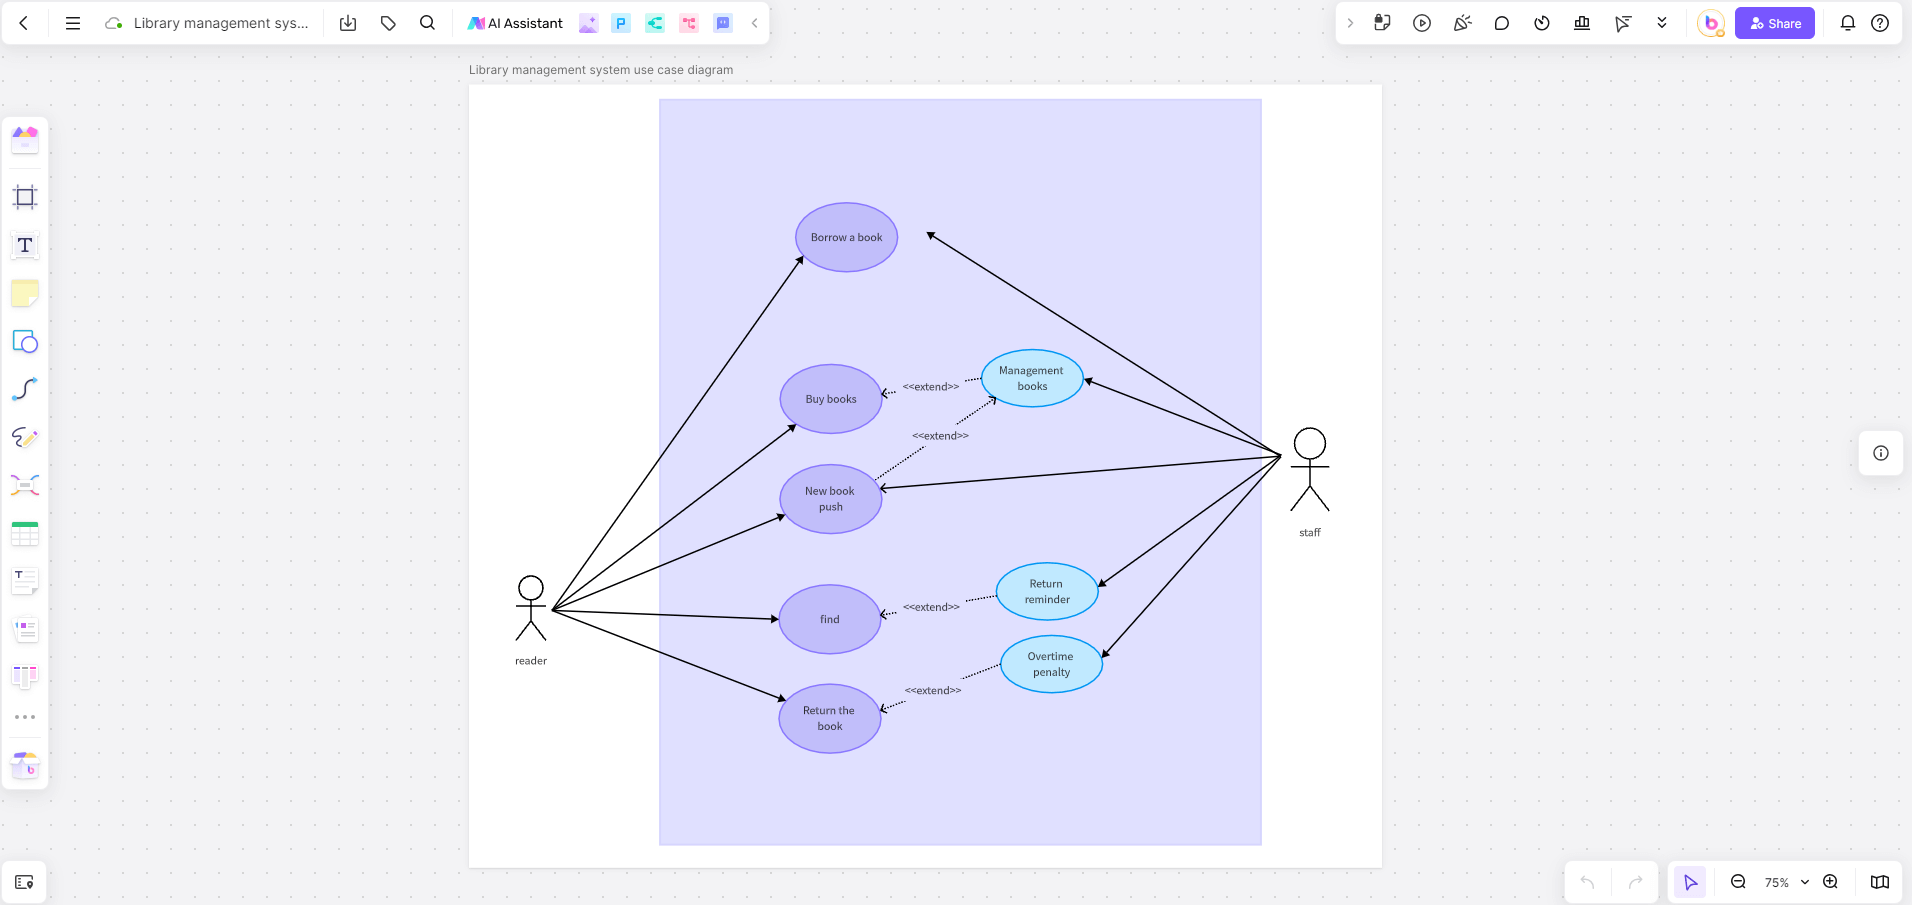
The use case diagram of a library management system is a graphical tool for describing the interaction between system functions and users. It shows the various use cases (user scenarios or functional requirements) and their relationship with internal and external participants in the system. The use case diagram is a powerful tool for visualizing system functions, facilitating a comprehensive understanding of the system's overall structure and the interaction between users and the system.
A use case is an entity that describes system functions, representing various services or responses that the system provides to external participants. In a library management system, use cases may include borrowing books, returning books, querying book information, etc. Through use case diagrams, we can better understand system requirements, ensuring comprehensive consideration of system functionality and user interaction.
Data management system use case diagram
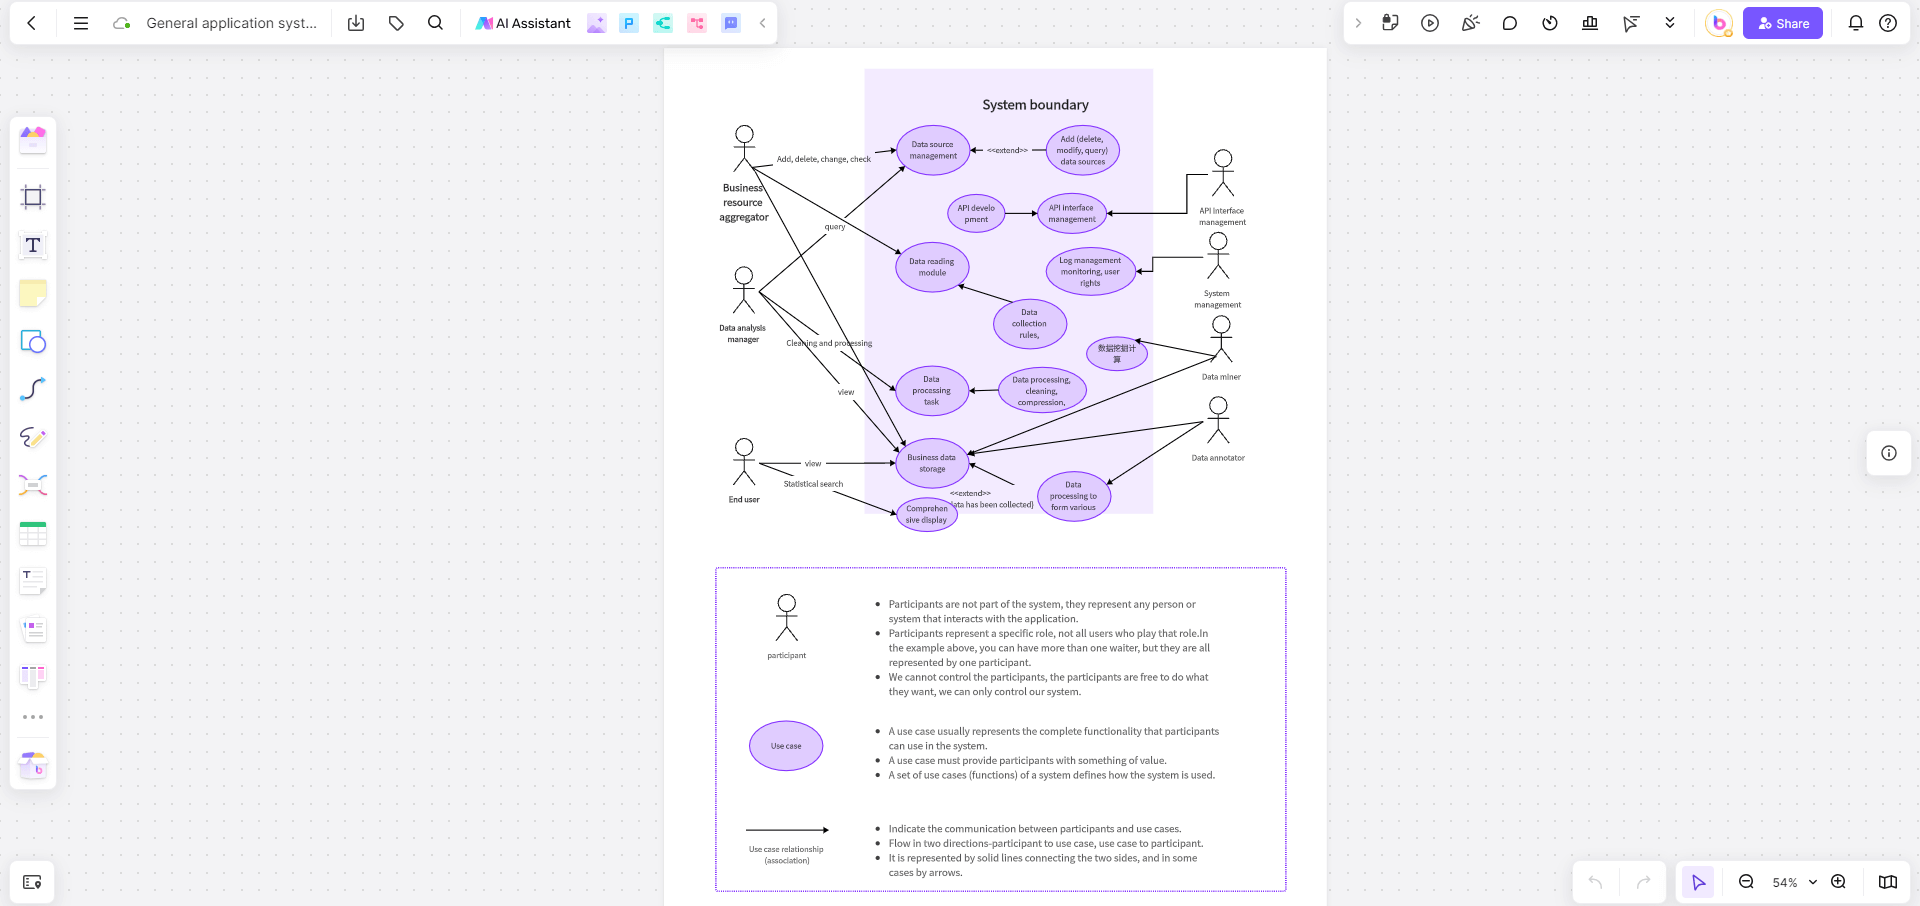
A use-case diagram for data management systems is a chart used to describe the interactive features between the system and its users. It shows the various roles (users) in the system and their interactive behaviors with it. The use-case diagram clearly describes the functions and features of the data management system.
Through the use-case diagram, we can understand all the functional modules within the system and their relationships and interactions. It can serve as the basis for testing and validating system functions. By testing each use case in the diagram, we can verify whether the system meets the users' needs and expectations.
News publishing system use case diagram
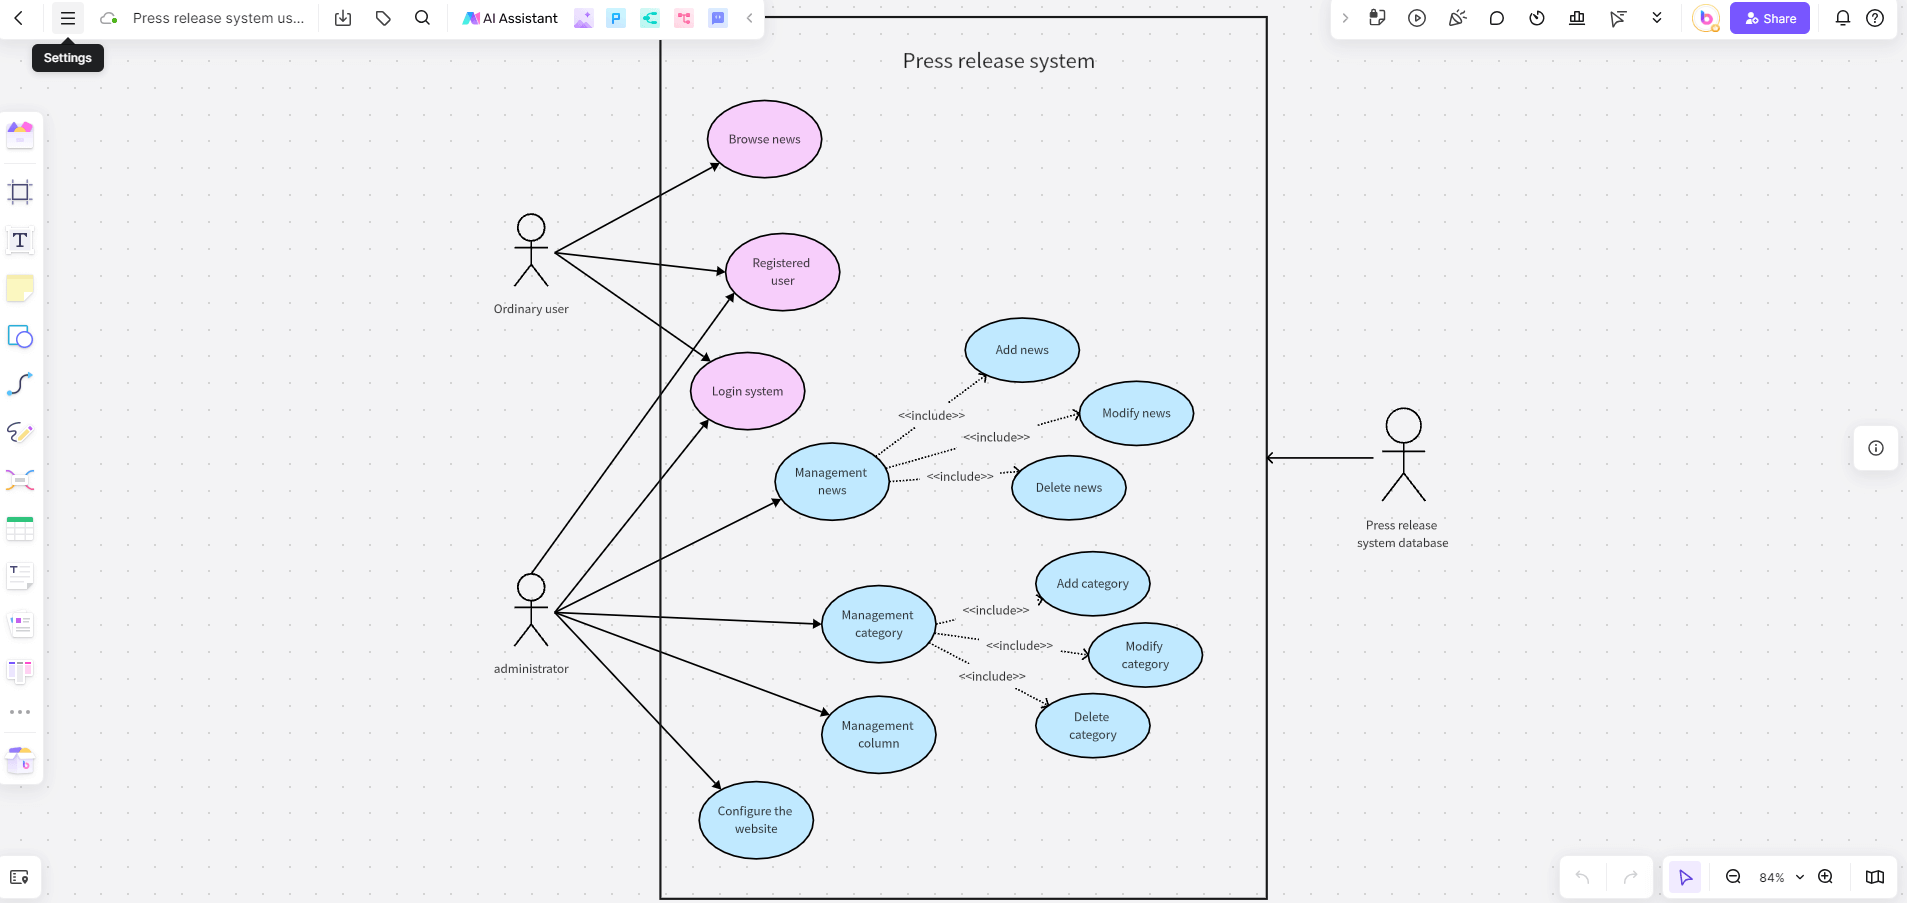
The use case diagram of the news publishing system is a graphical tool used to describe the interaction between the functions of the news publishing system and its users. As a basis for requirement analysis, it can help system design and development teams to determine the functions and interaction process of the system. It can guide the system design and development process, ensuring the completeness and consistency of the system's functions.
The use case diagram of the news publishing system, used to describe the features and user interactions of the news publishing system, can be applied to feature descriptions, user needs analysis, system design and development. Furthermore, it serves as a communication tool, more clearly conveying the system's functions, and user requirements, thus promoting understanding and consensus among all parties.
Bank ATM system use case diagram
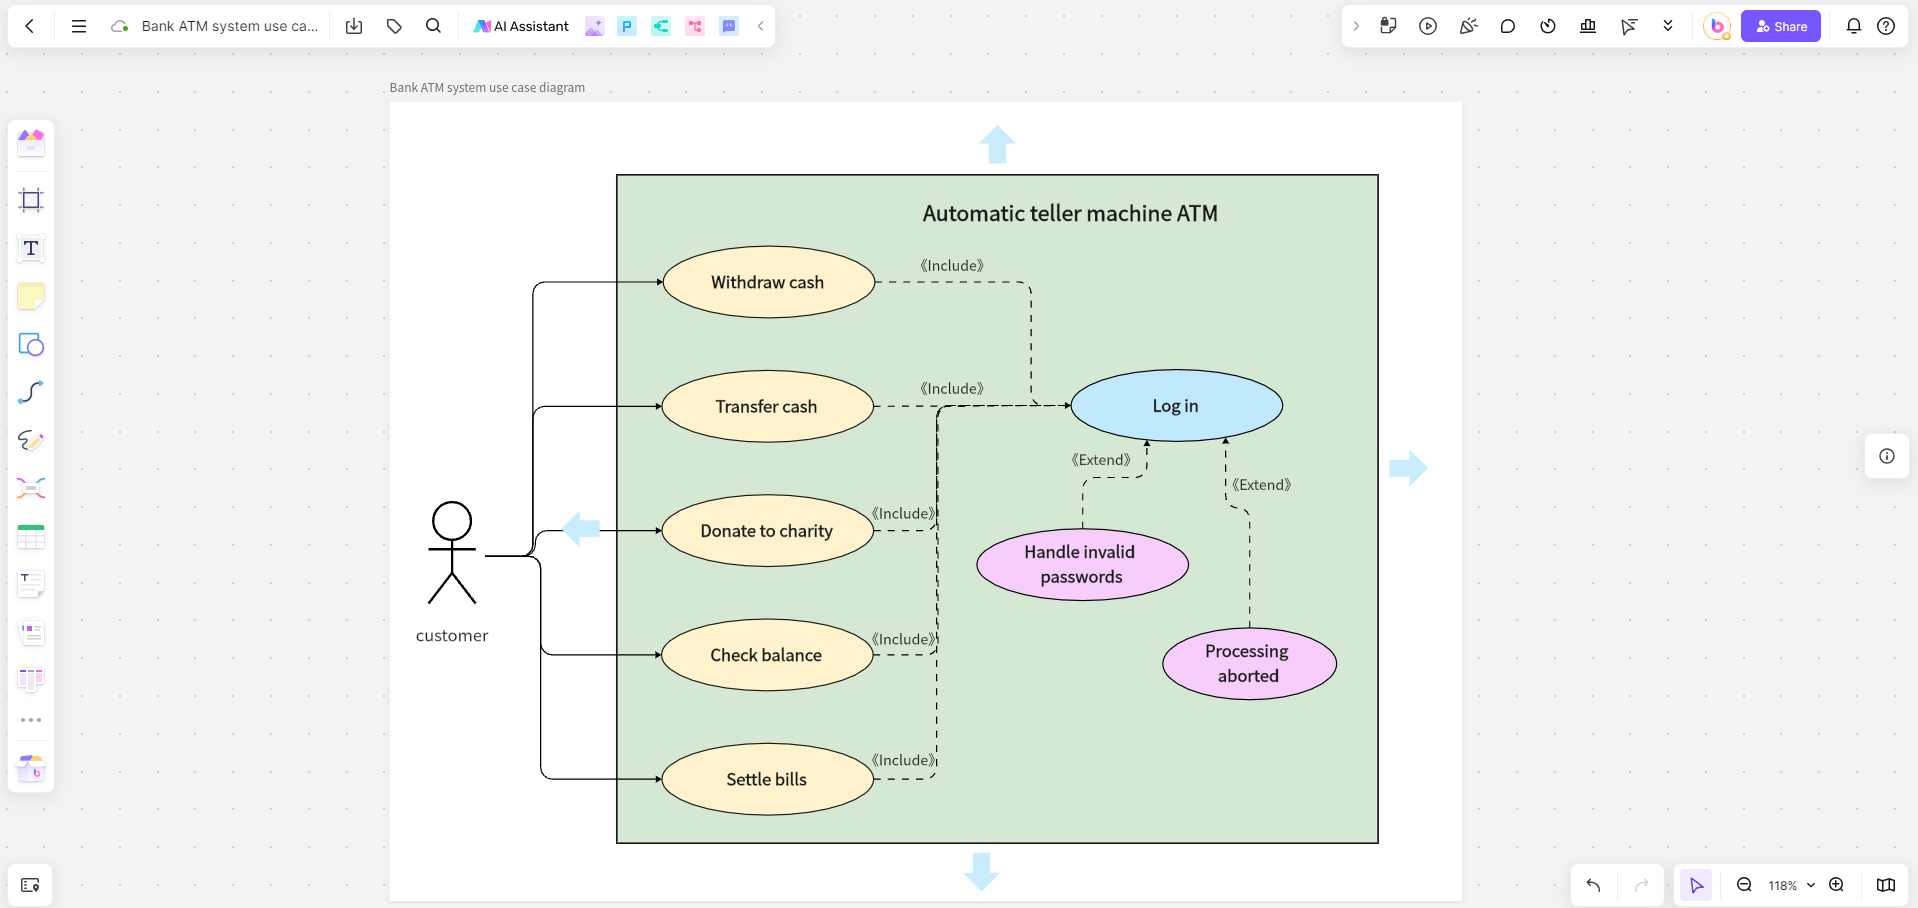
The use case diagram of a bank's ATM system is a graphical modeling tool used to describe the functions and interactions between various users and the system within the bank's ATM framework. It demonstrates how the system responds to the demands of external customers or other systems, as well as the interaction relationships among the internal functional modules of the system, through the graphical representation of use cases and actors. This use case diagram template can be found and used for free in the Boardmix community center. Start creating it online right away!
Conclusion
In this guide, we have delved into the intricacies of use case diagrams, understanding their essential role in visualizing system interactions. Moreover, we explored Boardmix, a powerful tool for creating use case diagrams effortlessly and efficiently. With its user-friendly interface and robust features, Boardmix stands out as a valuable resource for professionals looking to streamline their diagramming process.
We examined ten examples of use case diagrams, showcasing their diverse applications across various domains. All in all, mastering use case diagrams is essential for anyone involved in system design and analysis. Whether you're a seasoned professional or a newcomer, utilizing tools like Boardmix can significantly improve your workflow and ensure clear, effective visualizations of your system's interactions. Start now and make a use case diagram online!


