

In the dynamic landscape of strategic management, where complex objectives, cross-departmental dependencies, and long-term vision often collide with day-to-day operational chaos, having a tool that distills abstract strategic logic into a clear, actionable visual is not just a luxury—it’s a necessity. Enter the Strategy Map: a powerful framework that transcends the role of a mere blueprint to become the backbone of strategic communication, execution, and tracking. Unlike dense strategy documents that gather dust on executive shelves, a well-crafted strategy map turns vague goals into a visual story, ensuring every member of the organization—from frontline employees to C-suite leaders and even external stakeholders like investors—understands how their work connects to the bigger picture. In this comprehensive guide, we’ll dive deep into the essentials of strategy maps: what they are, their core components, a step-by-step guide to building one (with a focus on leveraging AI and collaborative tools), their symbiotic relationship with the Balanced Scorecard, and real-world applications that drive tangible business results. By the end, you’ll have the knowledge and confidence to integrate this tool into your organization’s strategic management toolkit.
What Is a Strategy Map, and Why Does It Matter?
At its core, a strategy map is a visual management tool designed to communicate an organization’s strategic objectives and the cause-and-effect relationships that link them. Think of it as a “strategic roadmap” that answers the critical question: How do our day-to-day actions lead to long-term success? Unlike traditional strategic plans—often lengthy, text-heavy, and prone to misinterpretation—a strategy map uses simple graphics, arrows, and categorized objectives to create a shared language around strategy.
The value of a strategy map lies in its ability to solve four common strategic management pain points:
Aligning Strategic Understanding: One of the biggest barriers to strategy execution is misalignment. A 2023 study by McKinsey found that only 23% of employees fully understand their organization’s strategy—a gap that leads to disjointed efforts and wasted resources. A strategy map eliminates this gap by translating complex strategic jargon into a visual format that’s easy to digest. When every team member can see how their role fits into the broader strategy, they’re more likely to make decisions that support organizational goals.
Focusing Resource Allocation: In today’s resource-constrained business environment, spreading resources too thin is a death knell for strategy. A strategy map highlights key priorities by emphasizing which objectives are most critical to driving success. For example, if a company’s top financial goal is “increase recurring revenue,” the map will show which customer (e.g., “improve customer retention”) and internal process (e.g., “streamline subscription management”) objectives directly support that goal—guiding leaders to allocate budget, time, and talent to high-impact areas.
Enabling Cross-Department Collaboration: Siloed departments are a major obstacle to strategic execution. Marketing might focus on acquiring new customers, while operations struggles to fulfill orders—creating a disconnect that harms the customer experience. A strategy map makes these interdependencies visible. For instance, it might show that marketing’s goal of “expanding into new markets” relies on operations’ ability to “scale supply chain capacity” and HR’s objective to “hire regional sales talent.” This visibility fosters coordinated action and breaks down departmental barriers.
Linking Execution with Evaluation: A common mistake in strategic management is creating a plan without a way to measure progress. A strategy map bridges this gap by connecting strategic objectives to measurable outcomes. It ensures that performance evaluations aren’t just about hitting operational targets (e.g., “process 100 orders per day”) but about contributing to strategic goals (e.g., “improve order fulfillment speed to boost customer loyalty”). This creates accountability and enables organizations to adjust their strategy when objectives aren’t being met.
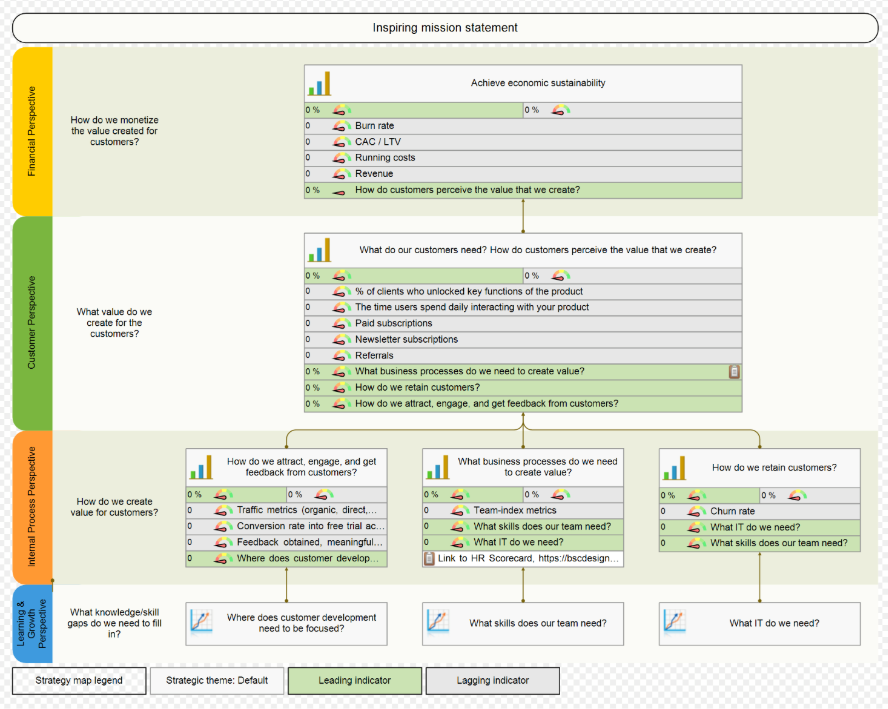
The Four Perspectives of a Strategy Map: Building Blocks of Strategic Logic
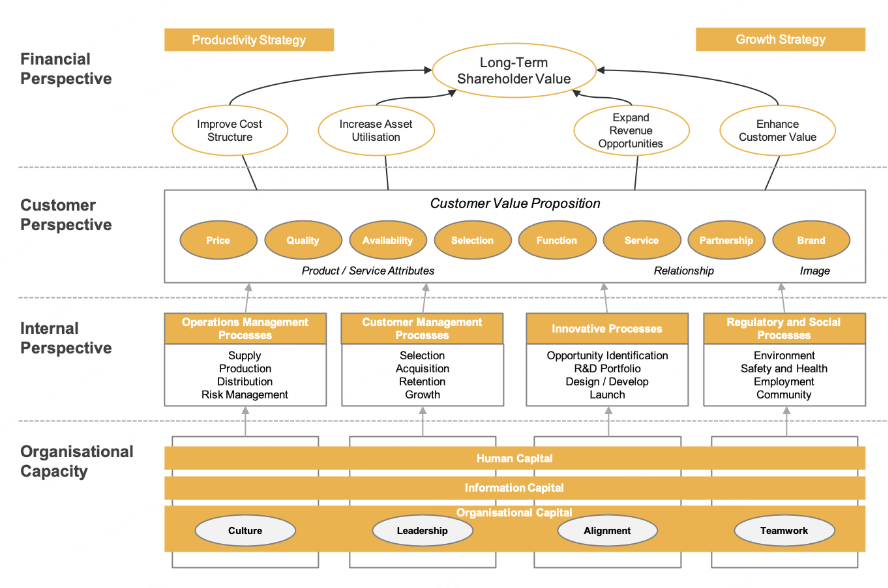
The structure of a strategy map is rooted in the Balanced Scorecard (BSC) framework, developed by Robert Kaplan and David Norton in the early 1990s. The BSC revolutionized strategic management by moving beyond purely financial metrics to include non-financial factors critical to long-term success. A strategy map builds on this by organizing strategic objectives into four interconnected perspectives, each linked by cause-and-effect relationships. Together, these perspectives form a cohesive loop: investments in learning and growth drive improvements in internal processes, which enhance customer satisfaction, ultimately leading to stronger financial performance.
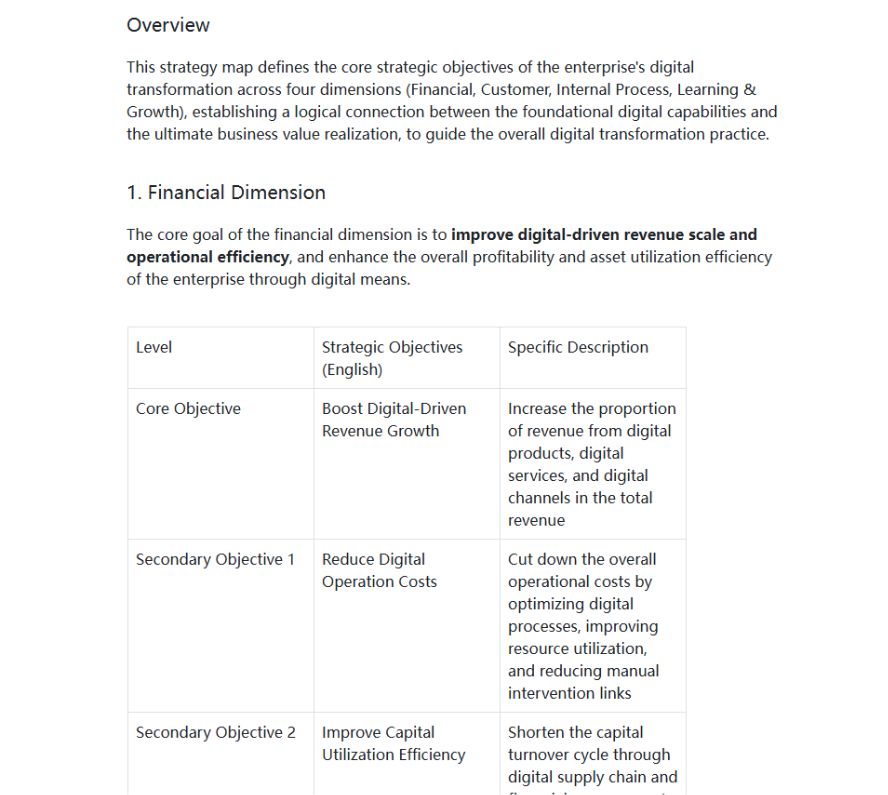
Financial Perspective: The Ultimate Outcome
The financial perspective is the “north star” of the strategy map, focusing on the ultimate financial outcomes that matter to shareholders and stakeholders. For profit-driven organizations, this includes goals like revenue growth, profit margin improvement, cost reduction, and return on investment (ROI). For nonprofits, it might center on financial sustainability, fundraise efficiency, or cost per program delivery.
The core question guiding this perspective is: How does our strategy create value for shareholders (or stakeholders)? Examples of financial objectives include “increase annual recurring revenue by 20%,” “reduce operational costs by 15%,” or “improve ROI on digital transformation investments.” Importantly, the financial perspective is not the starting point of strategy—it’s the result of success in the other three perspectives. A strategy map makes this clear by showing that financial goals are supported by customer, internal process, and learning & growth objectives.
Customer Perspective: The Driver of Financial Success
In today’s customer-centric business world, financial success is impossible without satisfied, loyal customers. The customer perspective focuses on how an organization attracts, retains, and grows its customer base. Key areas include customer satisfaction, loyalty, market share, brand reputation, and customer lifetime value (CLV).
The core question here is: How do we attract and retain customers in our target markets? Examples of customer objectives include “increase customer satisfaction scores from 85% to 95%,” “grow market share in the small business segment by 10%,” or “enhance brand awareness through targeted digital marketing.” The customer perspective acts as a bridge between internal operations and financial results—by delivering value to customers, organizations drive revenue and profitability.
Internal Process Perspective: The Engine of Customer Value
To deliver on customer promises, organizations must excel at key internal processes. The internal process perspective focuses on the operational, innovation, and administrative processes that drive customer satisfaction and financial success. This includes areas like operational efficiency, product/service quality, innovation capability, supply chain management, and customer service delivery.
The core question guiding this perspective is: Which key processes must we excel at to fulfill customer and financial objectives? Examples of internal process objectives include “reduce order fulfillment time from 3 days to 1 day,” “launch 2 new products per year,” “improve supply chain resilience to reduce stockouts,” or “streamline customer onboarding to reduce churn.” By optimizing these processes, organizations can deliver better customer experiences and achieve their financial goals.
Learning & Growth Perspective: The Foundation of Long-Term Success
The learning & growth perspective is the foundation of the strategy map, focusing on the capabilities an organization needs to sustain long-term success. This includes employee skills and development, information system optimization, organizational culture, and leadership capabilities. Without investments in these areas, organizations cannot improve internal processes, deliver customer value, or achieve financial goals.
The core question here is: How do we strengthen the organization’s long-term competitiveness and sustainability? Examples of learning & growth objectives include “train 100% of sales staff on new CRM software,” “improve employee engagement scores from 60% to 80%,” “implement a data analytics platform to support decision-making,” or “develop a leadership pipeline for key roles.” These investments build the organizational capacity needed to execute strategy over time.
How to Create a Strategy Map: A Step-by-Step Guide with AI and Boardmix?
Creating a strategy map doesn’t have to be a time-consuming, manual process. By leveraging the power of AI tools like Doubao AI and collaborative platforms like Boardmix, you can streamline the process, ensure alignment with the four-perspective framework, and create a visual map that’s easy to edit, share, and update. Here’s a step-by-step guide to building an effective strategy map:
Define Your Strategic Objectives (with AI Support)
Start by clarifying your organization’s overarching strategic goals. If you’re stuck, use Doubao AI to generate a draft set of objectives aligned with the four perspectives. For example, input a command like: “Please create a strategy map framework for a mid-sized e-commerce company focused on digital transformation, including financial, customer, internal process, and learning & growth objectives. Ensure the objectives include cause-and-effect relationships and are actionable.”
Doubao AI will output a structured list of objectives tailored to your industry and strategic focus. This saves time and ensures you don’t miss key areas—for example, it might suggest financial objectives like “increase online revenue by 25%,” customer objectives like “reduce cart abandonment rate by 15%,” internal process objectives like “optimize website load time to under 2 seconds,” and learning & growth objectives like “train marketing team on AI-driven personalization tools.”
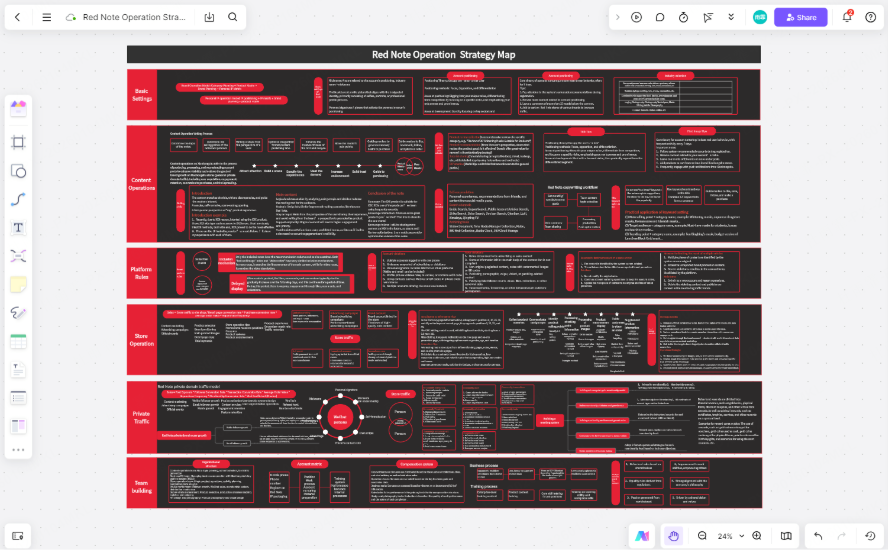
Open Boardmix and Activate the AI Assistant
Once you have a draft of your objectives, navigate to Boardmix—a collaborative whiteboarding platform designed for strategic planning. Create a new workspace and activate the AI Assistant (found in the toolbar). For the best results, select the Deepseek R1 model and enable internet search mode—this allows the AI to pull in industry-specific context and best practices to refine your strategy map. Try Boardmixfor free!

Paste and Refine the AI-Generated Content
Copy the structured objectives generated by Doubao AI and paste them into the Boardmix AI dialog box. Add a follow-up command like: “Convert these objectives into a visual strategy map that highlights cause-and-effect relationships between the four perspectives. Use a clear layout with color-coding for each perspective.” The AI will interpret the text and generate a preliminary strategy map, complete with arrows indicating how objectives connect (e.g., “train marketing team on AI tools” → “optimize personalized marketing” → “reduce cart abandonment” → “increase online revenue”).
Customize and Visualize for Clarity
The AI-generated map is a starting point—now it’s time to customize it to your organization’s needs. Replace generic objectives with specific, measurable goals (e.g., change “increase revenue” to “increase online revenue by 25% in 2024”). Use Boardmix’s editing tools to adjust the layout, color-code each perspective (e.g., green for learning & growth, blue for internal processes, orange for customers, red for financial), and refine the arrows to accurately reflect cause-and-effect relationships. Add notes or comments to explain complex dependencies—for example, “Supply chain optimization relies on new inventory management software (learning & growth objective).”
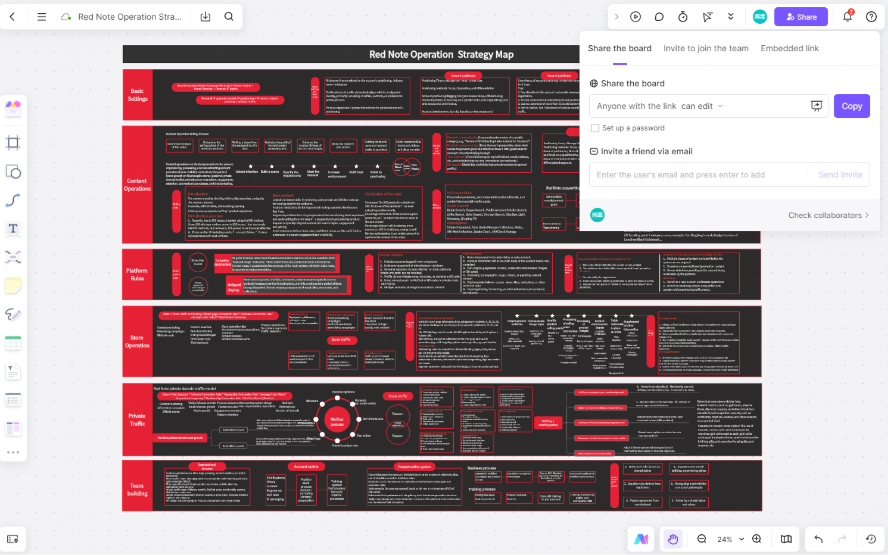
Collaborate and Gather Feedback
A strategy map should be a collaborative tool, not a top-down edict. Share the Boardmix workspace link with key stakeholders—department heads, team leaders, and even frontline employees—and invite them to provide feedback. Use Boardmix’s real-time collaboration features to discuss adjustments: for example, the sales team might point out that a customer objective needs to be adjusted to reflect current market trends, or the IT team might note that a learning & growth objective requires additional budget. This collaboration ensures the map is realistic, actionable, and supported by the entire organization.
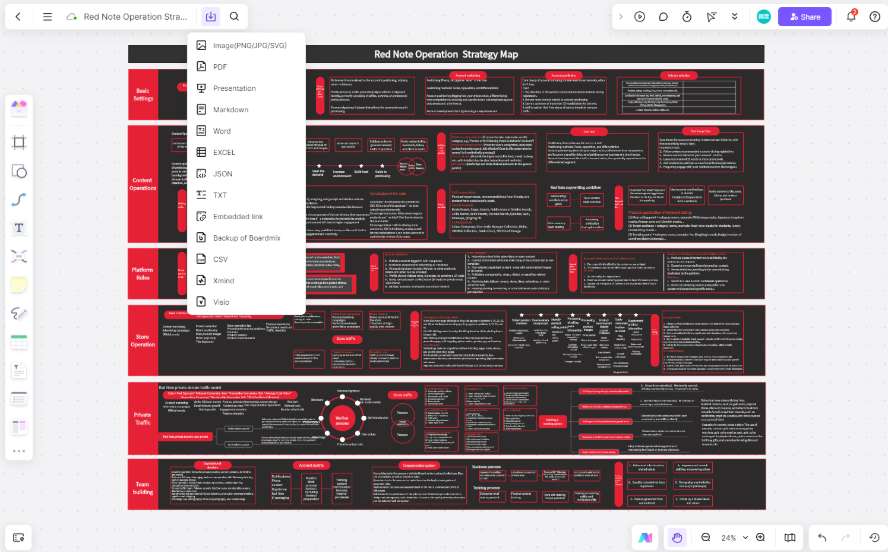
Export and Integrate with Execution Tools
Once the map is finalized, export it as a high-quality PNG or PDF for presentations, meetings, or internal documents. For ongoing execution, integrate the map with your performance management tools: add a table to the Boardmix canvas that links each objective to key performance indicators (KPIs), responsible teams, and timelines. This bridges the gap between strategy and execution, making it easy to track progress and adjust goals as needed.
The Symbiotic Relationship Between Strategy Maps and the Balanced Scorecard
Strategy maps and Balanced Scorecards are often confused, but they are complementary tools that serve distinct (yet interconnected) roles in strategic management. Understanding their relationship is key to maximizing their value.
- A strategy map is a visual tool that focuses on how strategic objectives interact and drive one another. It establishes the logical chain of cause and effect (e.g., learning & growth → internal processes → customers → financials) and serves as the foundation for selecting measurable indicators. Think of it as the “why” and “how” of strategy—it explains the logic behind your goals.
- A Balanced Scorecard, on the other hand, is an execution tool that focuses on what to measure. It translates the objectives from the strategy map into specific, quantifiable KPIs, targets, and initiatives. For example, if the strategy map includes the customer objective “improve satisfaction scores,” the Balanced Scorecard will define the KPI (e.g., Net Promoter Score), the target (e.g., NPS of 60+), and the initiatives to achieve it (e.g., launch a customer feedback program).
In practice, the two tools work together seamlessly—especially in platforms like Boardmix. You can start by creating a strategy map to visualize your strategic logic, then add a Balanced Scorecard table to the same canvas. This integration ensures that every KPI and initiative is directly tied to a strategic objective, eliminating the risk of measuring activities that don’t drive success. For example, a retail company might use its strategy map to show that “employee product knowledge” (learning & growth) drives “improved customer service” (internal process), which boosts “customer loyalty” (customer), leading to “higher average order value” (financial). The Balanced Scorecard would then define KPIs like “employee product knowledge test scores” (target: 90%+), “customer service response time” (target: 2 minutes or less), “customer retention rate” (target: 85%+), and “average order value” (target: $150+).
Practical Applications of Strategy Maps: Driving Results Across Industries
Strategy maps are versatile tools that can be applied to organizations of all sizes and industries—from startups to Fortune 500 companies, and from profit-driven businesses to nonprofits. Their ability to translate abstract strategy into actionable visuals makes them invaluable in a range of scenarios:
Corporate Strategic Management
For large organizations with complex hierarchies, strategy maps simplify strategic execution by ensuring alignment across departments. For example, a multinational manufacturing company might use a strategy map to communicate its digital transformation strategy. The map would show how investments in AI training for engineers (learning & growth) lead to improved production process automation (internal process), which reduces manufacturing costs and improves product quality (customer), ultimately increasing profit margins (financial). By sharing this map with all employees, the company ensures that every team—from R&D to production to sales—understands how their work contributes to the transformation goal.
Performance Management
Strategy maps are a cornerstone of effective performance management. They help organizations move beyond “activity-based” KPIs (e.g., “number of meetings held”) to “strategy-based” KPIs (e.g., “number of cross-departmental initiatives completed to support customer retention”). For example, a healthcare provider might use a strategy map to link employee training on patient-centered care (learning & growth) to improved patient wait times (internal process), higher patient satisfaction (customer), and increased reimbursement rates (financial). Performance evaluations for clinical staff would then focus on how well they contribute to these strategic KPIs, ensuring that performance is tied to organizational success.
Organizational Communication and Culture Building
Strategy maps are powerful communication tools that make strategic logic accessible to everyone—even those without a background in strategic management. For startups, this is especially valuable: a young tech company might use a strategy map to communicate its growth strategy to new employees, showing how their work on product development (internal process) leads to better user experience (customer), higher user retention (customer), and ultimately, increased funding (financial). This clarity fosters a culture of ownership and engagement, as employees can see the direct impact of their work.
Project Management and Resource Allocation
In project management, strategy maps help organizations prioritize initiatives and allocate resources effectively. For example, a nonprofit focused on environmental conservation might use a strategy map to evaluate potential projects. The map would show which projects (e.g., “community recycling programs”) directly support key objectives like “increase public awareness of sustainability” (customer) and “reduce local carbon emissions” (internal process), which in turn drive donations (financial) and long-term organizational sustainability (learning & growth). By using the map to assess project alignment with strategic goals, the nonprofit can allocate its limited resources to initiatives that have the greatest impact.
Conclusion: Making Your Strategy Map a Living Tool
A strategy map is more than a visual document—it’s a dynamic tool that should evolve with your organization’s strategy. Creating the map is just the first step; its real value emerges when it’s actively used, updated, and integrated with performance management systems like the Balanced Scorecard. With tools like Boardmix, you can keep your strategy map alive: collaborate with your team in real time, adjust objectives as market conditions change, and track progress against KPIs—all in one platform.
In today’s fast-paced business world, organizations that can translate strategy into action are the ones that thrive. A strategy map provides the clarity, alignment, and focus needed to turn abstract vision into tangible results. By leveraging AI to streamline creation and collaboration tools to drive engagement, you can make the strategy map a cornerstone of your organization’s strategic success.


