Before diving into the supply chain flow chart, let's learn the supply chain. A supply chain is like a "relay race track": from raw material procurement → production and processing → transportation → selling to consumers, each link is passed on like a baton.
For example, when you buy a cup of milk tea, the process behind it may be: tea procurement → factory production of milk tea powder → transportation to the milk tea shop → clerk making → you get the milk tea.
So what is a supply chain flow chart? The flow chart for supply chain is a graph that draws each step of the supply chain, just like drawing a "relay race map", so that everyone can understand at a glance: who is involved (suppliers, factories, warehouses, stores), what to do (procurement, production, transportation, sales), and how to connect (which link is in front and which is behind).
Now you know what is a supply chain flow chart look like, let's take the example of a milk tea shop to see how the flow chart work.
Suppose you opened a milk tea shop, the supply chain flow chart can be drawn like this:
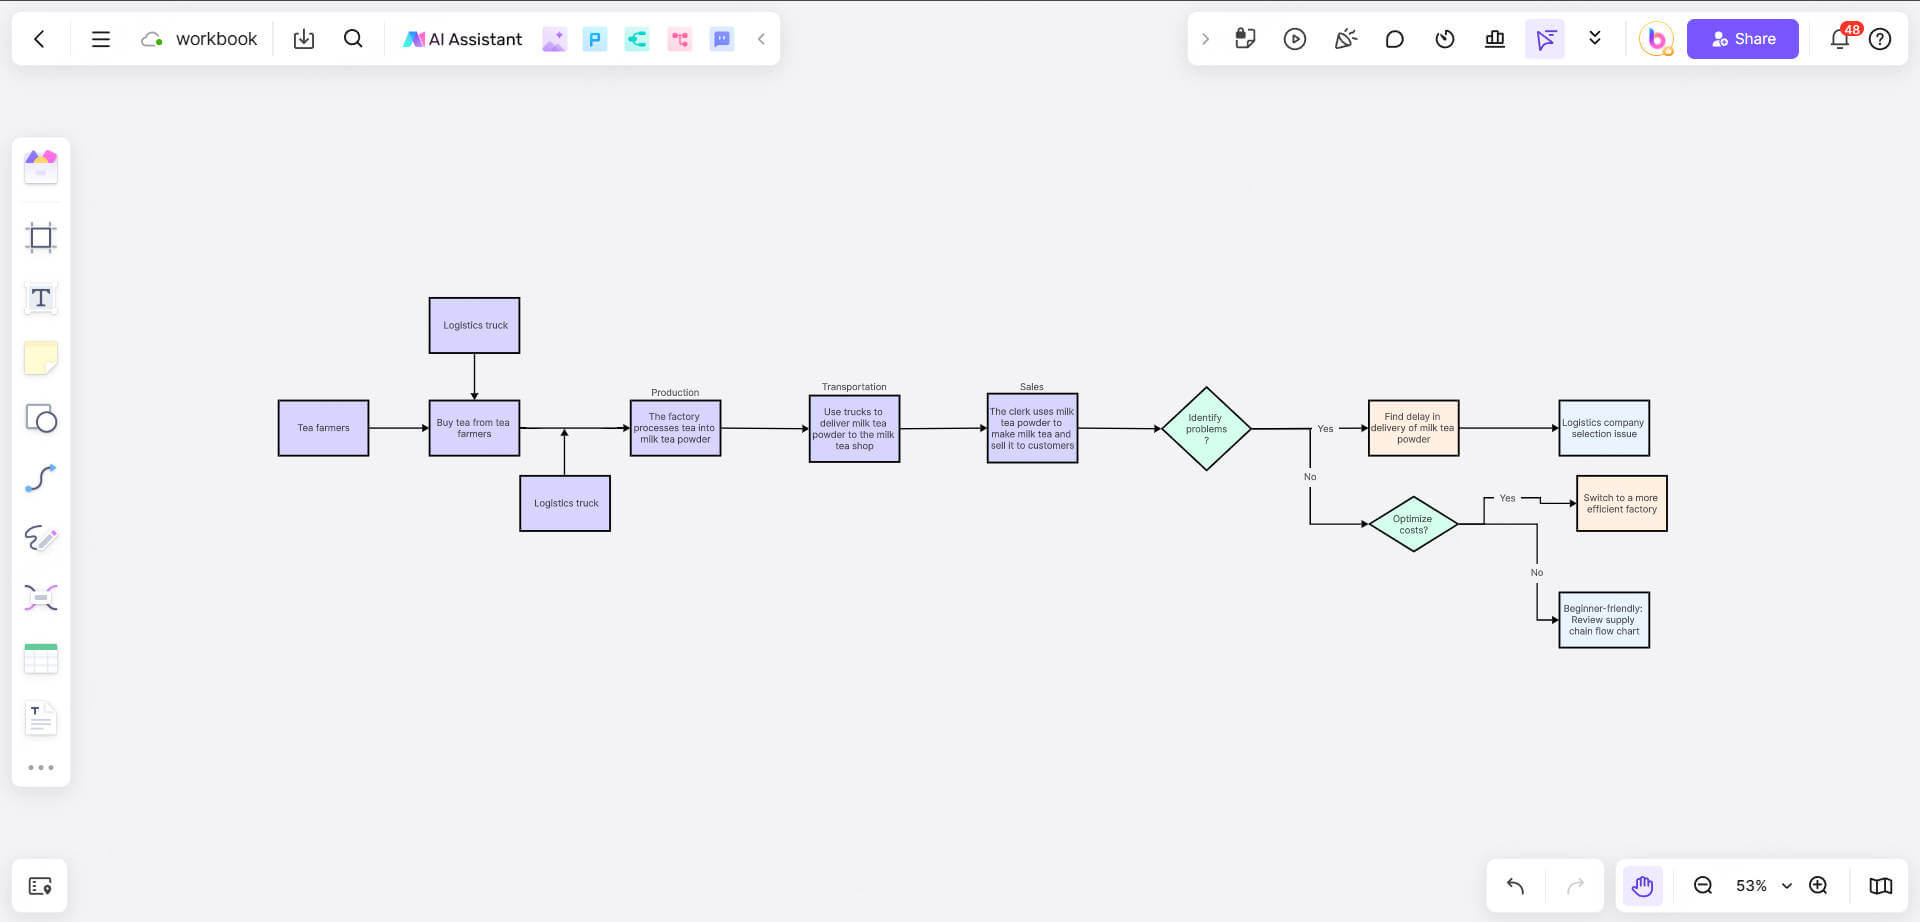
🎈Here are the detail flows for the supply chain:
- Purchase: Buy tea from tea farmers
- Production: The factory processes tea into milk tea powder
- Transportation: Use trucks to deliver milk tea powder to the milk tea shop
- Sales: The clerk uses milk tea powder to make milk tea and sell it to customers
- With the supply chain flow charts, you can:
- Identify problems: For example, if you find that milk tea powder is always delayed in delivery → it may be that the logistics company is not selected properly.
- Optimize costs: If you find that milk tea powder production takes time → you can switch to a more efficient factory.
- Beginner-friendly: If you don’t understand professional terms, you can know where the problem is by looking at the supply chain flow chart.
In other words, the supply chain flow chart is to simplify the complex process, just like drawing a map, so that ordinary people can also understand how the business works. Let’s continue to learn two cases of using flow charts to simplify the supply chain.
Case 1: Supply Chain Management System Flow Chart
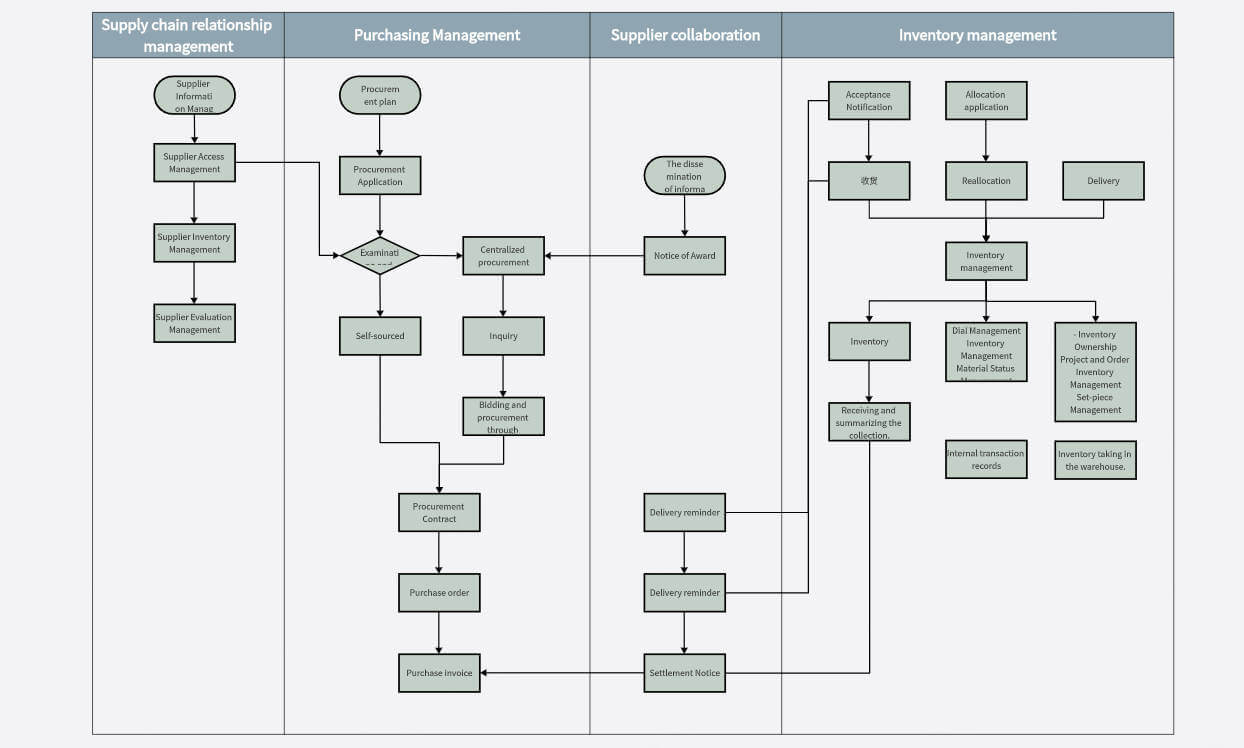
This supply chain management system flow chart is a visual representation of the key processes involved in managing suppliers, procurement, collaboration, and inventory. The flowchart systematically outlines how a supply chain management system operates, ensuring efficiency and coordination between different departments.
Key Sections of the Supply Chain Flow Chart
1. Supplier Relationship Management
Manages supplier information, onboarding, inventory, and performance evaluation.
Ensures that supplier data is updated and suppliers are assessed based on performance metrics.
2. Procurement Management
Includes procurement planning, purchase requests, approvals, and sourcing strategies.
Differentiates between centralized procurement, direct purchasing, and tender-based comparisons.
Covers contract agreements, purchase orders, and invoice processing.
3. Supplier Collaboration
Focuses on communication and coordination with suppliers.
Includes notification of successful bids, order dispatch, and receipt confirmation.
Tracks financial settlement and delivery updates.
4. Inventory Management
Handles stock notifications, transfer requests, and order dispatching.
Manages warehouse operations, stock reception, tracking, and auditing.
Incorporates internal transaction records and periodic warehouse inspections.
This supply chain flow chart illustrates the structured approach to supply chain management, ensuring smooth operations from supplier selection to inventory tracking. By following these systematic steps, businesses can enhance procurement efficiency, improve supplier collaboration, and optimize inventory control.
Case 2: Finance Supply Chain Flow Chart
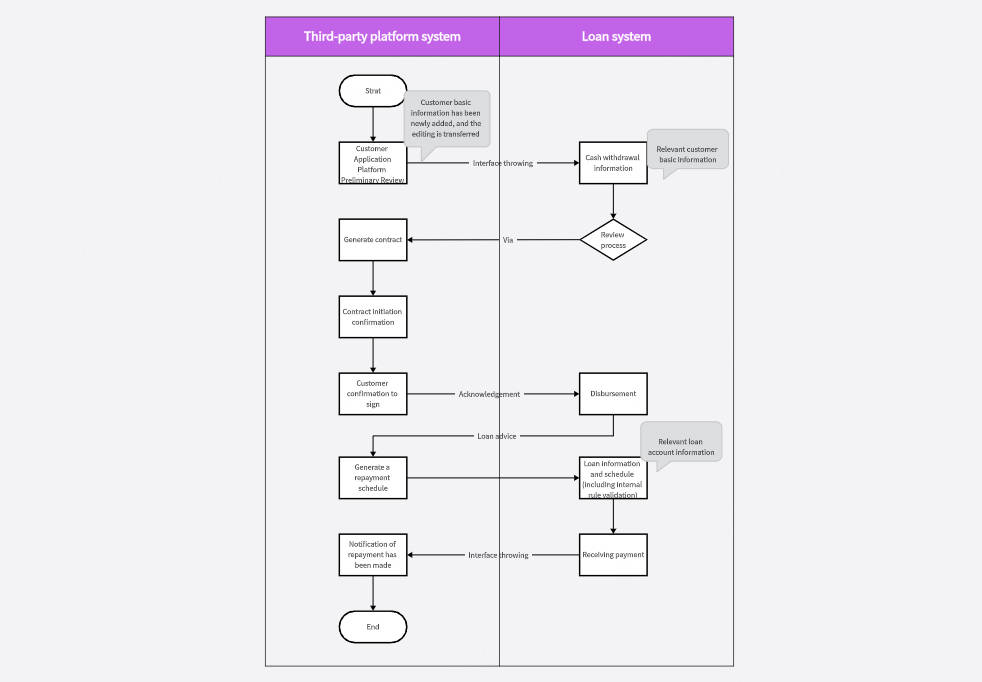
The finance supply chain flow chart is a structured visual representation of financial processes within a supply chain, integrating third-party platforms and lending systems. This chart illustrates how financial transactions and credit approvals work to streamline business operations and improve cash flow efficiency.
Key Sections of the Finance Supply Chain Flow Chart
1. Third-Party Platform System
Starts with a customer application for financial services through the platform.
The platform processes the application and generates a loan contract.
Both parties confirm the contract terms, and the customer proceeds with credit verification.
After credit verification, a financing plan is generated, followed by a notification of successful disbursement.
2. Lending System
Receives customer asset information and reviews the loan application.
The approval process determines whether the loan is granted or rejected.
If approved, funds are disbursed, and the loan repayment plan is recorded.
The system tracks repayments and confirms receipt of funds.
This finance supply chain flow chart outlines a structured financial process, ensuring smooth integration between third-party financing platforms and lending systems. By automating credit assessment, contract verification, and fund disbursement, businesses can enhance financial transparency, reduce risks, and optimize capital flow within the supply chain.
How to use Boardmix to make a supply chain flowchart?
In supply chain management, process visualization is the key to optimizing operational efficiency. Supply chain flowcharts can help teams clearly understand the entire process from suppliers to customers, identify bottlenecks and optimize links. With the help of Boardmix online whiteboard, you can easily create, edit and share supply chain flowcharts for efficient collaboration. Below, we will introduce how to use Boardmix to make a professional supply chain flowchart.
1. Why choose Boardmix for supply chain flowchart drawing?

As a powerful online whiteboard tool, Boardmix provides rich drawing functions and collaboration capabilities, especially suitable for drawing supply chain flowcharts. The reasons are as follows:
Rich flowchart templates: built-in supply chain flowchart templates, out of the box, no need to draw from scratch.
Drag-and-drop operation: supports one-click addition of process nodes, arrows and icons, making the drawing process more intuitive and efficient.
Real-time collaboration: team members can edit and comment online at the same time to ensure efficient communication among all parties in supply chain management.
Data visualization: supports color marking and chart insertion to help analyze key links in the supply chain.
Cloud storage and multi-terminal access: support access and editing at any time on PC, tablet, and mobile phone, facilitating cross-team collaboration.
2. How to create a supply chain flow chart on Boardmix?
2.1 Choose a suitable template or start from scratch
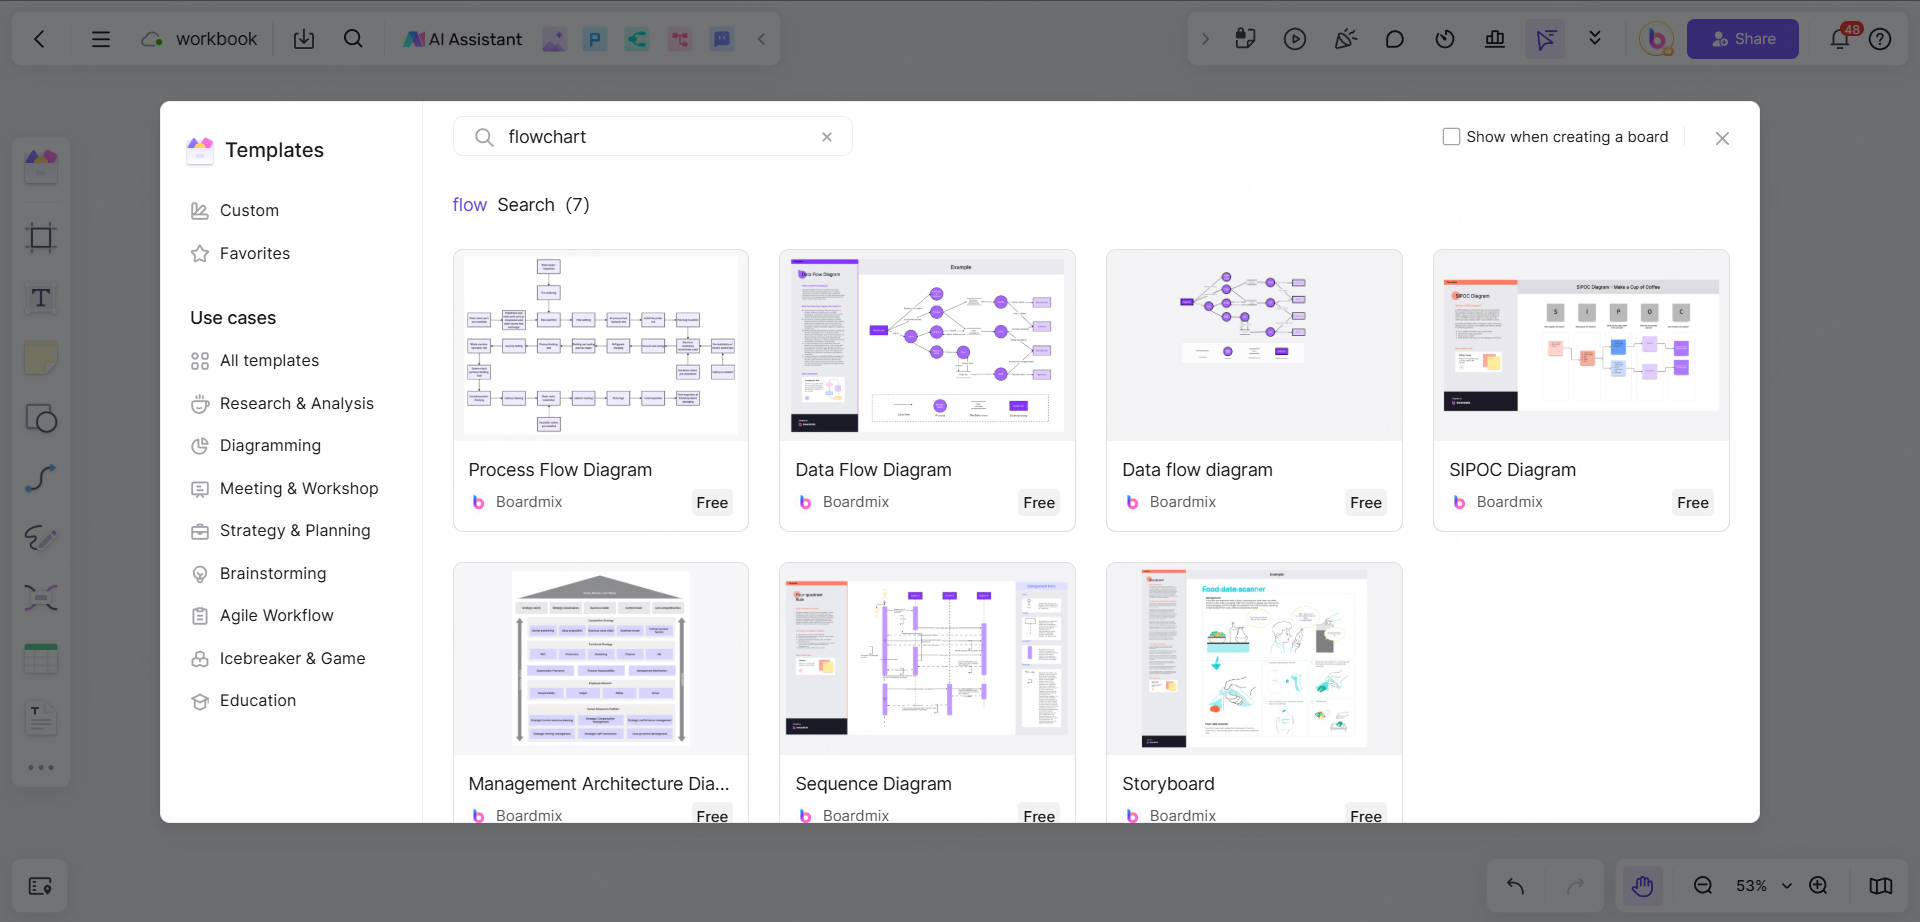
Method 1: Use a preset template
Log in to Boardmix, enter the template library, and search for "supply chain flowchart". Select a suitable template, modify the content directly, and quickly build a flowchart.
Method 2: Customize a flowchart
Create a blank whiteboard and use the flowchart tool to manually add key links in the supply chain (such as suppliers, production, warehousing, distribution, etc.).
2.2 Add key links in the supply chain
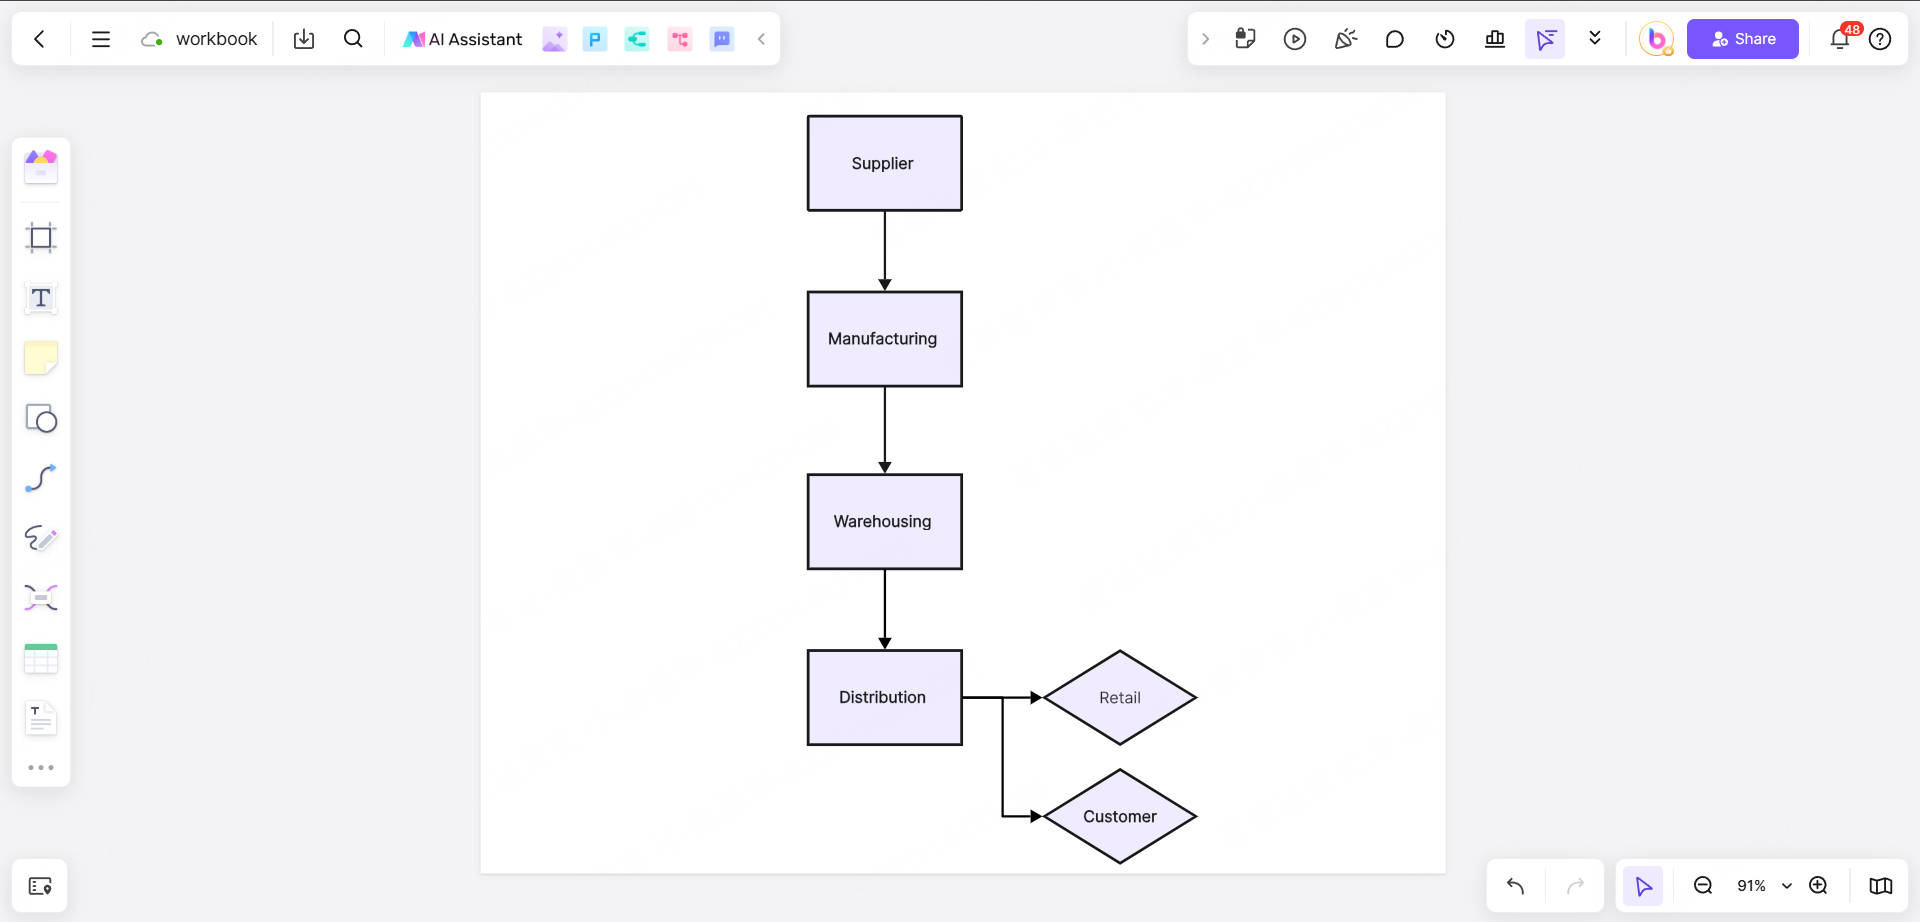
The supply chain process generally includes the following core steps: Supplier → Manufacturing → Warehousing → Distribution → Retail/Customer
In Boardmix, you can use rectangles or swimlanes to represent different links, and use arrows to connect them to clearly show the flow relationship.
2.3 Mark key data and optimization points
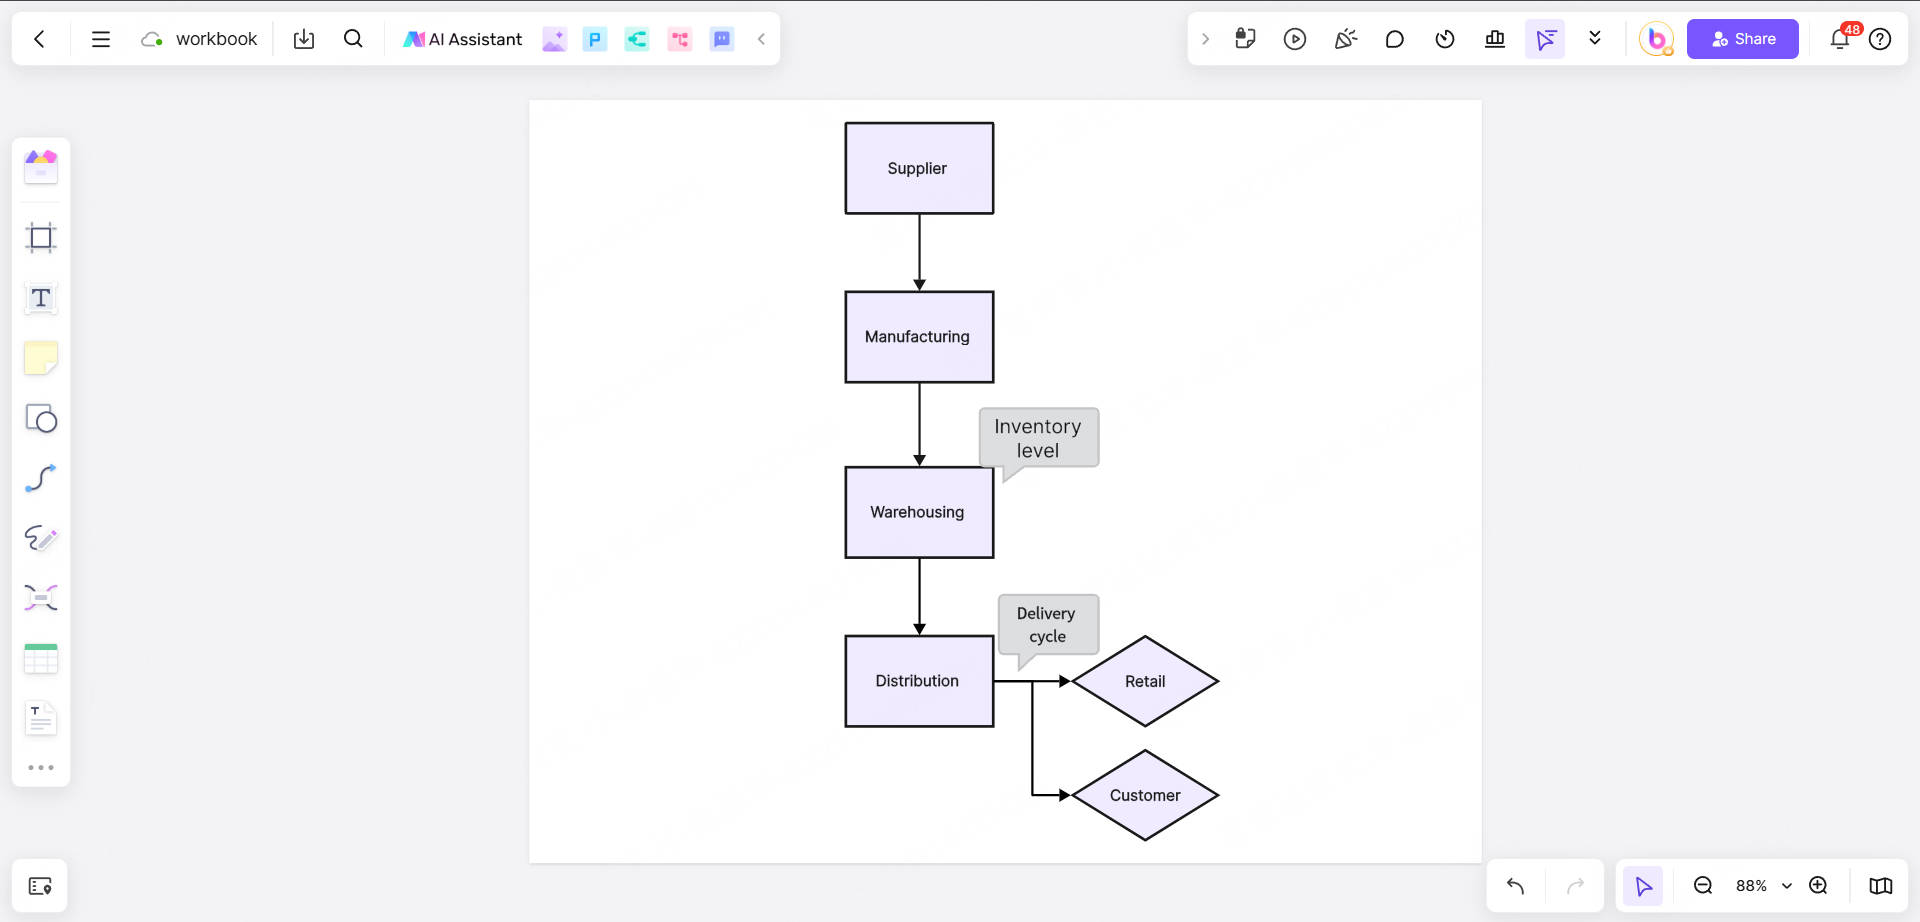
- Use text annotation to add key information of each link, such as delivery cycle, inventory level, etc.
- Use color highlighting to highlight bottlenecks in the process, such as delay points or high-cost links in the supply chain.
- Combined with Boardmix data analysis function, data such as inventory turnover rate and logistics cost can be intuitively displayed in the chart.
2.4 Sharing and collaboration
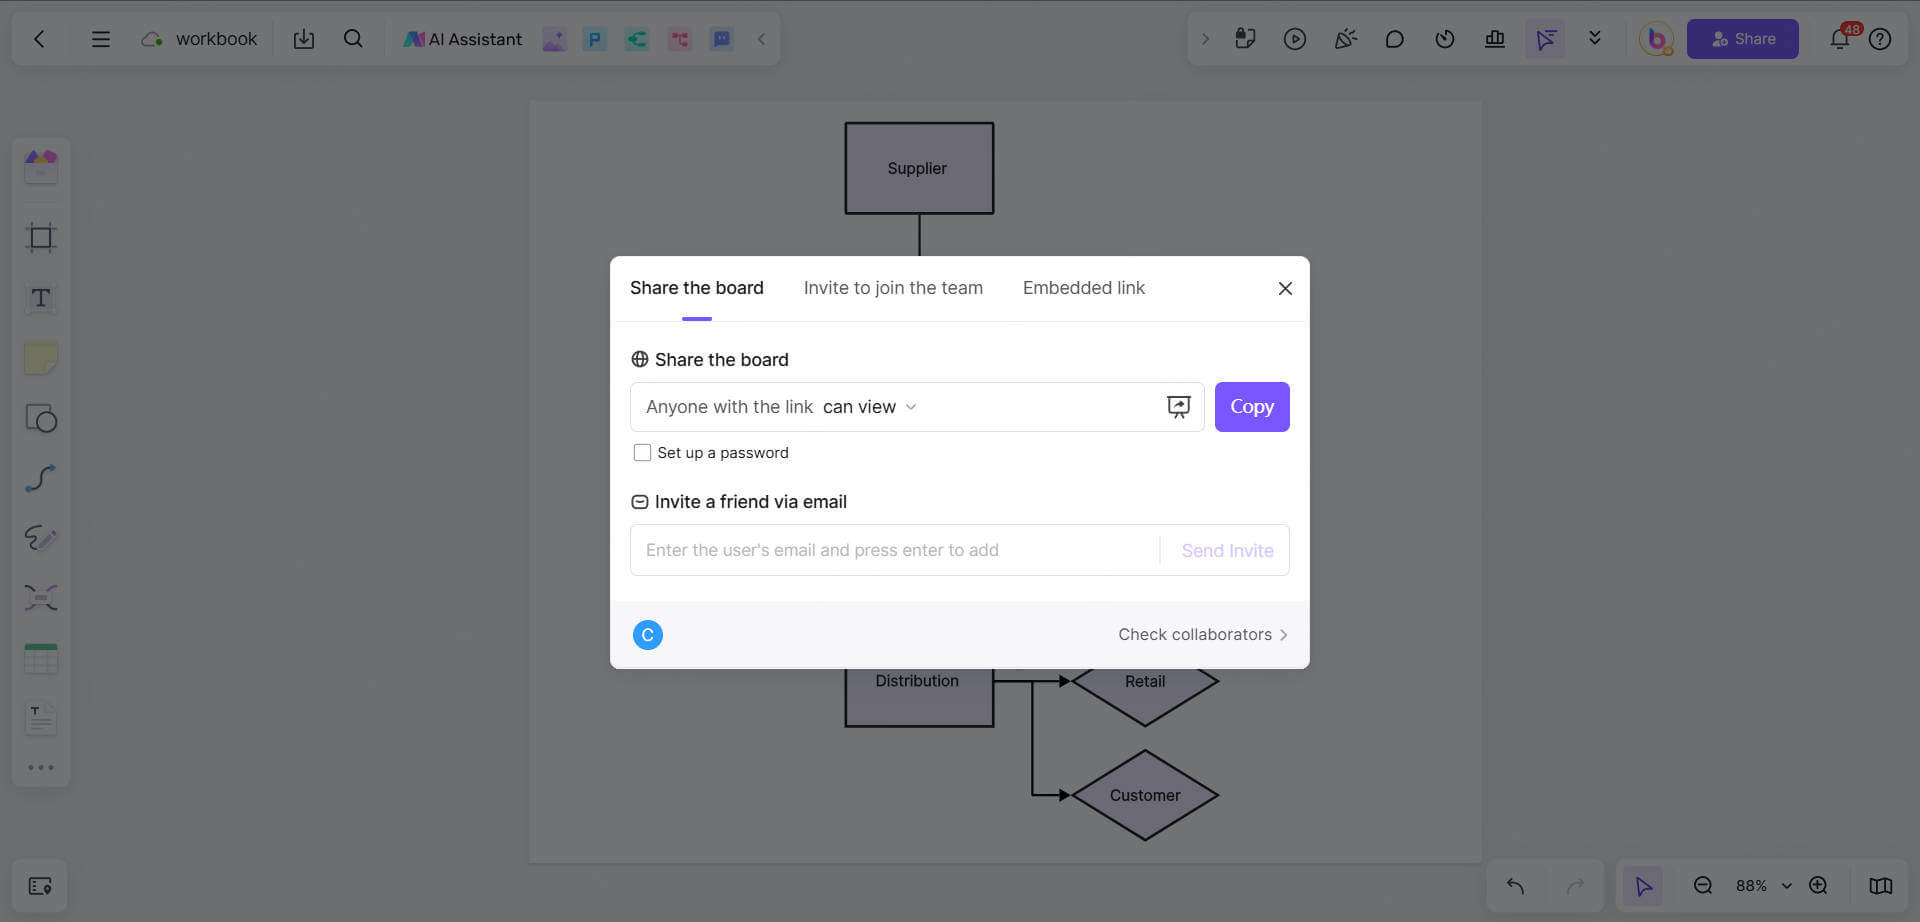
Boardmix supports real-time collaboration. Team members can add comments and modify content on the same flowchart to achieve efficient communication. It can be exported in PDF, PNG, SVG and other formats for easy sharing or embedding in report files. It can also integrate project management tools such as Trello and JIRA to seamlessly connect supply chain processes and task management.
Conclusion
A well-designed supply chain flow chart is like a guiding light to help you find bottlenecks and room for improvement in your operations. Whether you are a logistics manager or a supply chain novice, learning to use flow charts can help you make smarter decisions in the complex business world and make your work easier.
Using Boardmix to create supply chain flowcharts can not only clearly show the supply chain structure, but also improve team collaboration efficiency and optimize supply chain management processes. Boardmix can help you easily create professional supply chain visualization charts to make supply chain operations more efficient and smooth. Try Boardmix now to improve your supply chain management capabilities!


