A double bubble map can create instant comparisons, and for this reason, it has become one of the best tools for educators. If you are trying to find new ways to engage your students or for other purposes related to comparison, then it is the right option.
In this article, we will explain the double bubble graphic organizer concept, show you specific examples, and introduce you to the most efficient double bubble map creator. Don’t miss them!
What Is a Double Bubble Map
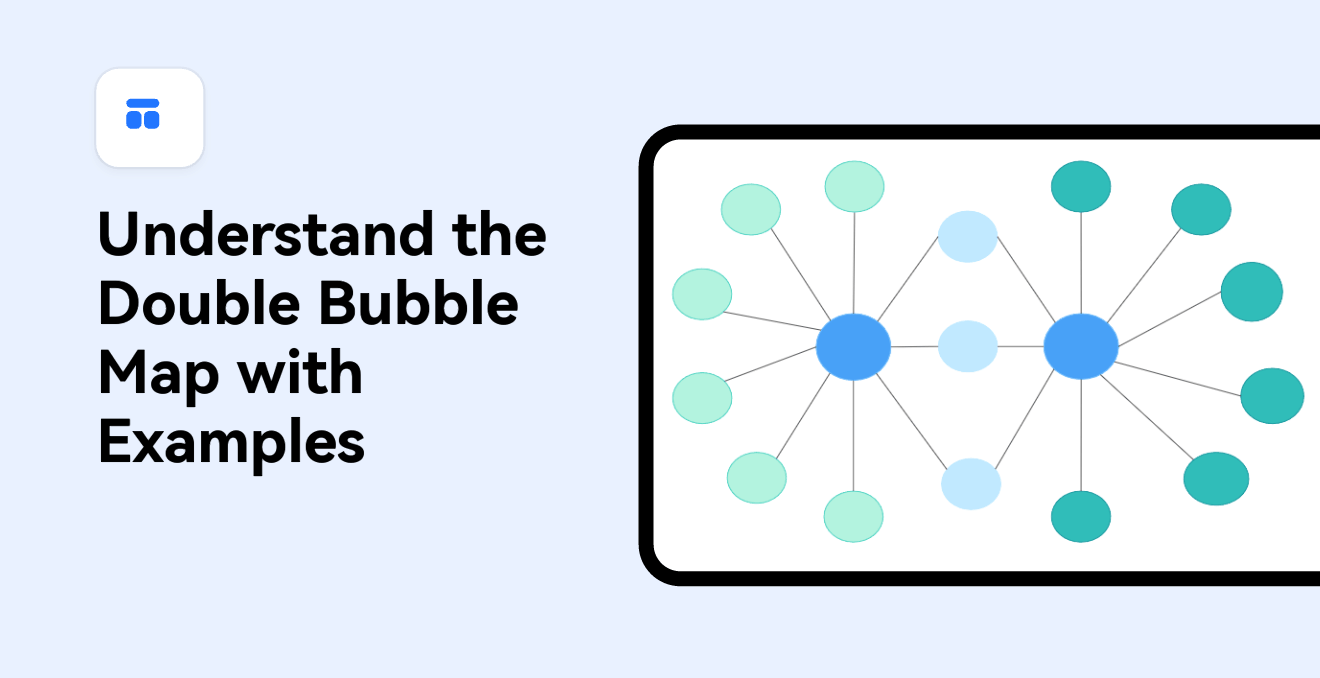
The double bubble graphic organizer is a visual tool that contains the similarities and differences between two main ideas. In essence, it is a graph that compares and contrasts two subjects in an easy way. For this reason, it has become an indispensable tool for teachers and educators.
If you see a double bubble map example, you will notice that this tool consists of several bubbles. The main focus of the graph is the two big bubbles that contain the main ideas. Then, several other bubbles around them are connected to either or both of them. This way, you can understand the main differences and similarities of these two topics at a glance. With the right double bubble map creator, you can create this graphic organizer for any ideas you want in no time.
Why Would You Use a Double Bubble Map
The main use of the double bubble graphic organizer is in the classroom, as it has several benefits. First, it can effectively summarize the similarities and differences between the two ideas. It is the perfect tool to compare and highlight the differences between two concepts that are hard to distinguish. This way, a double bubble map example can activate the student’s critical thinking and comprehension.
Moreover, there is no limit to the use of this particular graph. You can use a double bubble map creator to draw one regardless of the topic you are teaching or the age group of your students. This versatility has boosted the popularity of the double bubble graphic organizer, which is now widely used in the classroom.
Double Bubble Map Vs. Bubble Map
Apart from the double bubble graphic organizer, there is also the bubble map. Therefore, you might be wondering what is their main difference and why choose the one over the next.
By taking a look at a double bubble map example and a bubble map example, you will immediately notice that their main difference is the number of main bubbles. In a bubble map, there is only one main topic, and the bubbles around it represent its attributes. The double bubble graphic organizer, though, contains two main subjects. This allows you not only to show each idea’s attributes but to also create a direct comparison of them.
Both tools serve different purposes and are very popular among teachers. Your double bubble map creator will surely allow you to create bubble maps as well.
6 Double Bubble Map Examples
Double Bubble Map Example -01
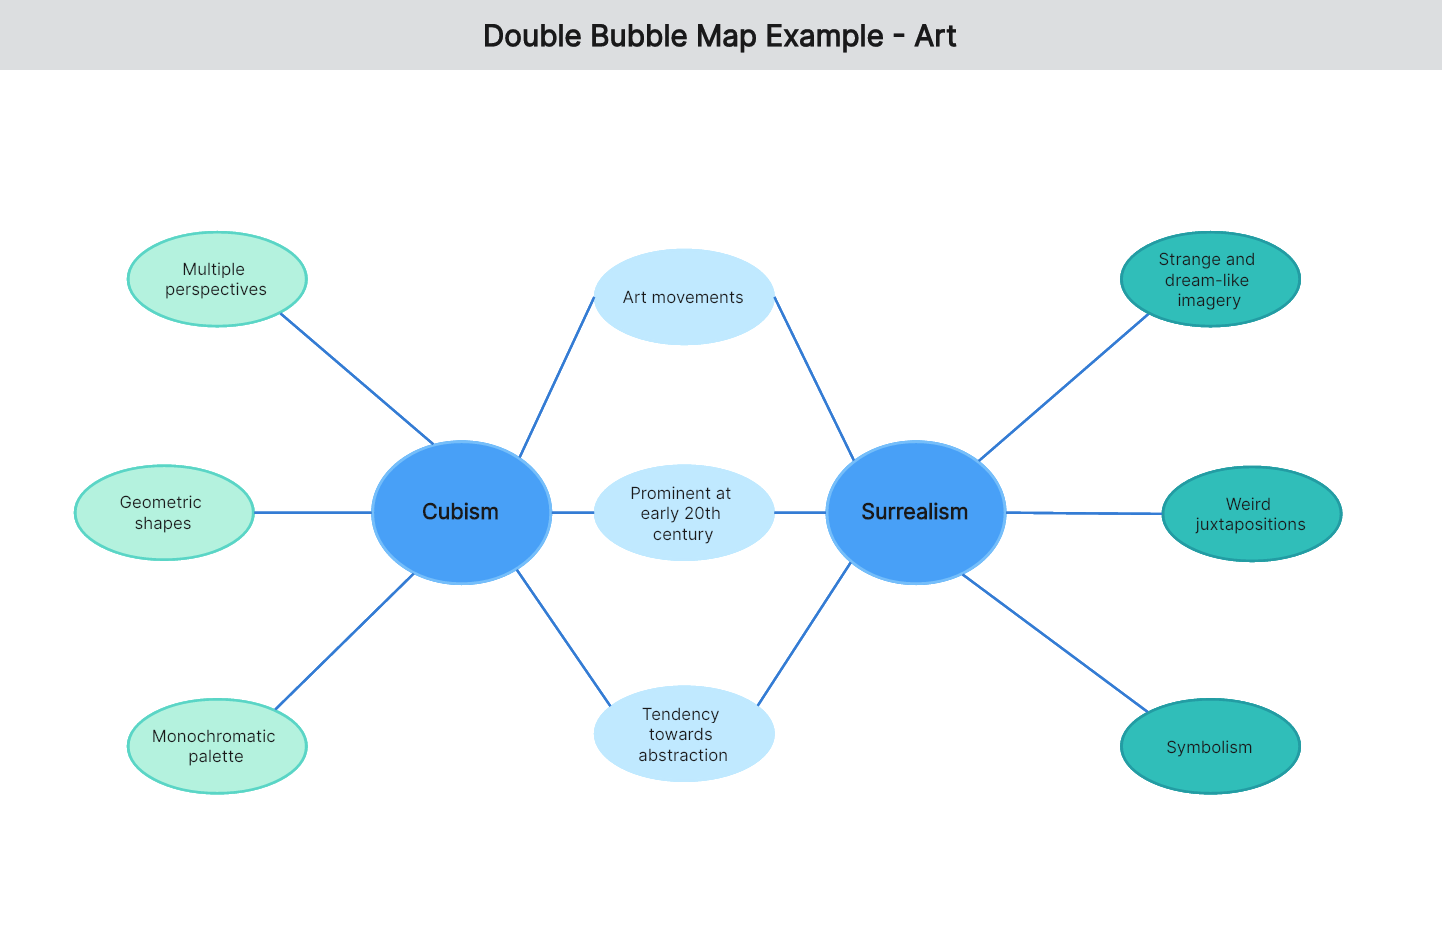
The first double bubble map example that we are going to see is one that can be used in an art class. For this example, we will compare cubism and surrealism in our double bubble map creator. As you can see, these two are both art movements; they both became prominent at the beginning of the 20th century, and both have a tendency towards abstraction. Apart from these, we can add as cubism’s characteristics in that it uses multiple perspectives, geometric shapes, and a monochromatic palette. On the flip side, surrealism’s characteristics are that it uses strange imagery, weird juxtapositions, symbolism, and dream-like images.
Double Bubble Map Example -02
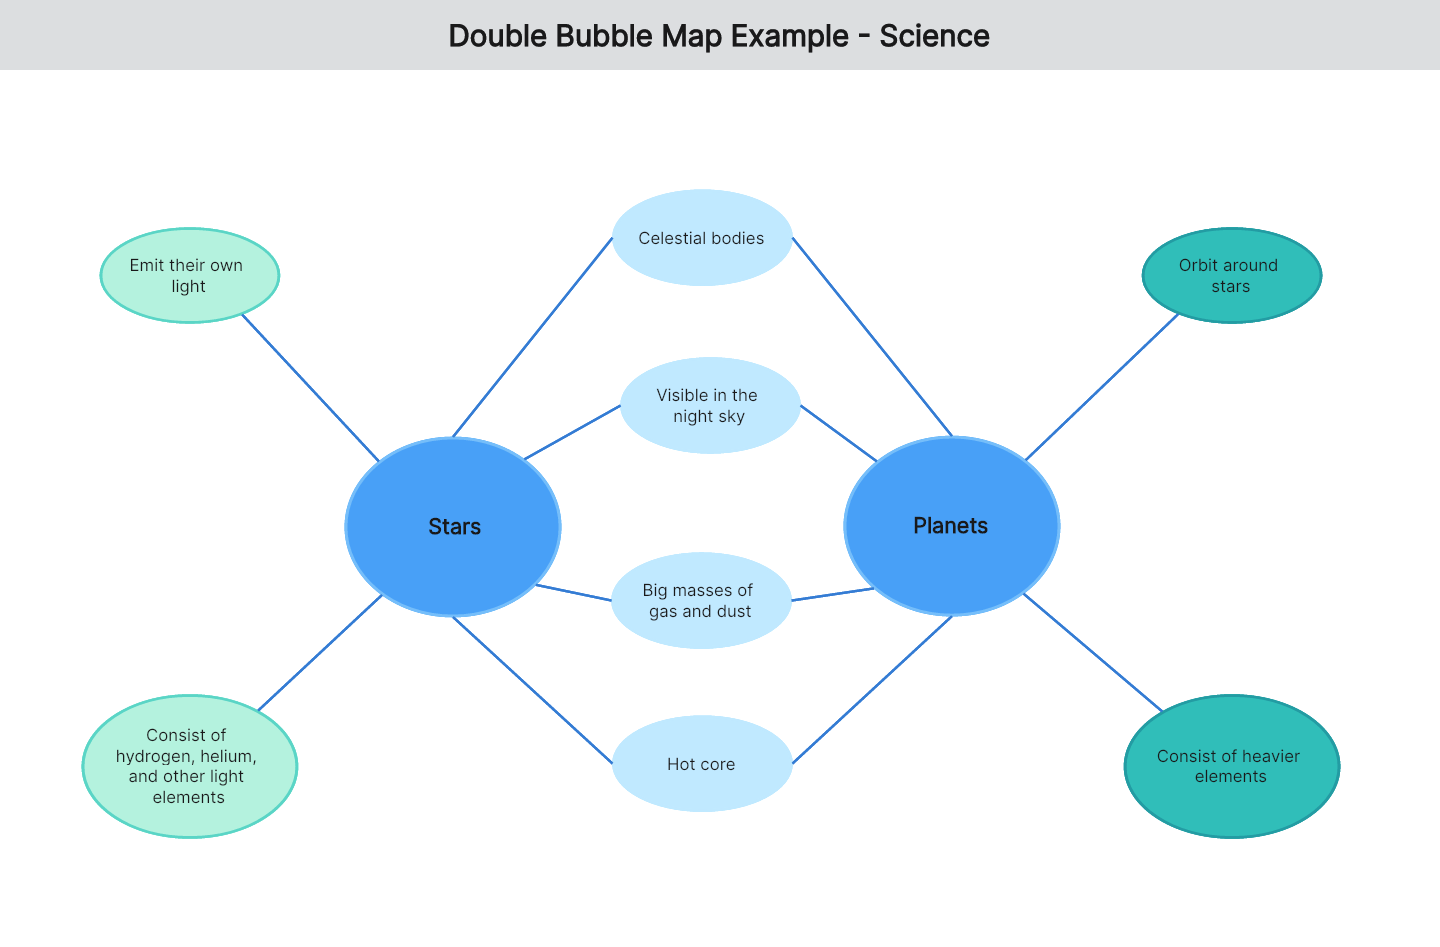
The next double bubble map example comes from a science class as it will compare stars and planets. From the graph, we see that the similarities between the two are that they are both celestial bodies, they are both visible in the night sky, they both have a hot core, and they are both big masses of gas and dust. Then, in the double bubble map creator, we are adding that the stars emit their own light and they consist of mostly hydrogen, helium, and other light elements. The planets, on the other hand, don’t emit their own light, orbit around stars, and consist of heavier elements.
Double Bubble Map Example -03
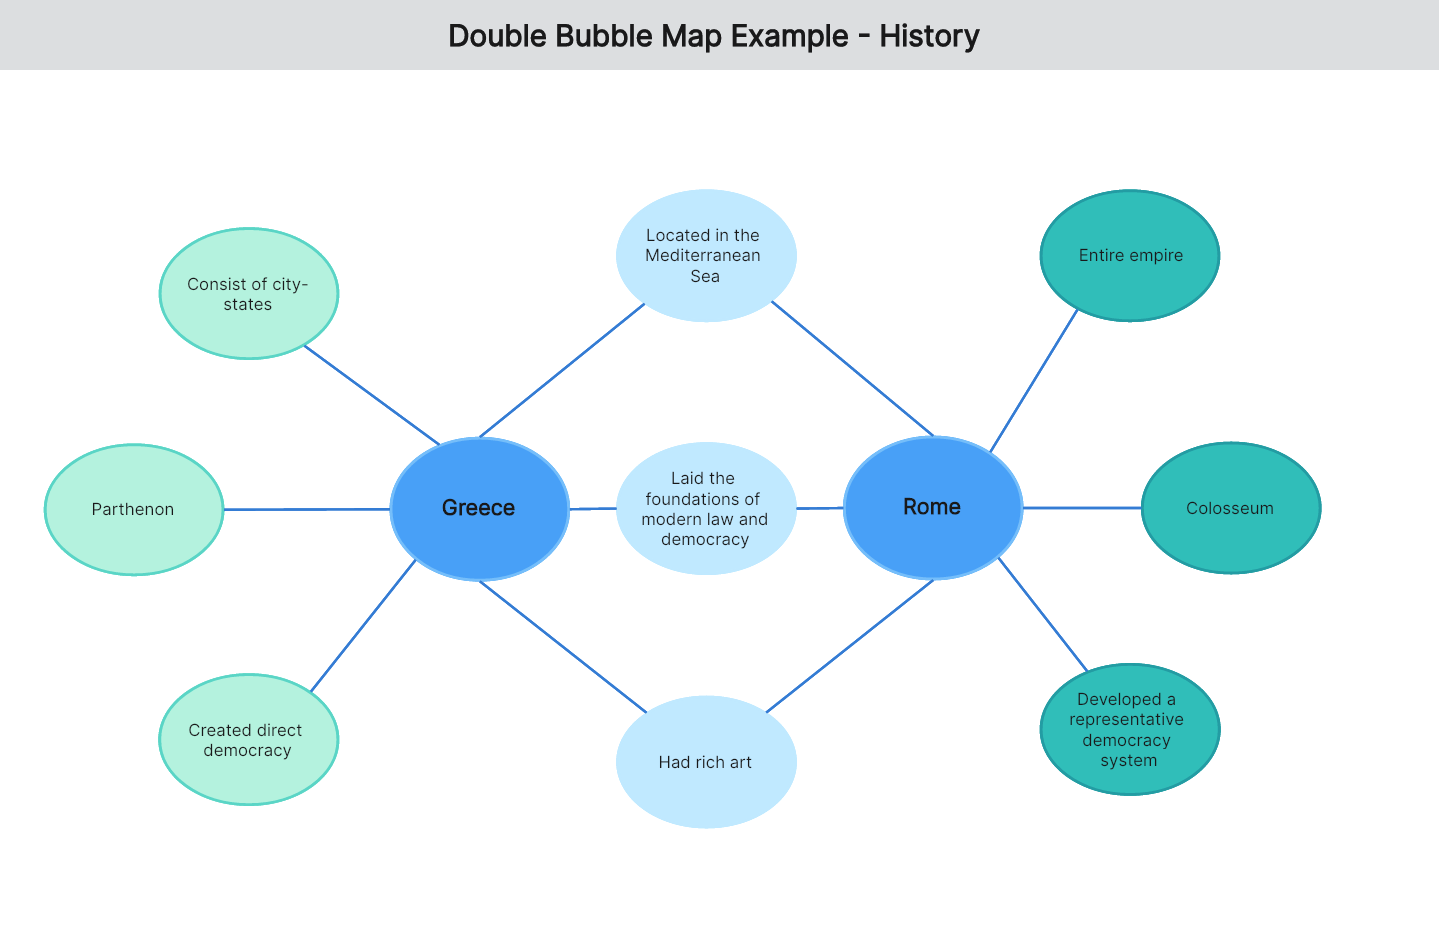
Another double bubble map example that we are going to see will be useful in a history class. In this double bubble graphic organizer, we are comparing Greece and Rome. As you can see from the map, these two empires were both located in the Mediterranean Sea, they both laid the foundations of modern law and democracy, and they had rich art. The main characteristics of Greece are that it consisted of city-states, it created direct democracy, and its most prominent building is the Parthenon. The characteristics of Rome are that it was an empire, it had developed a representative democracy system, and its most prominent building was the Colosseum.
Double Bubble Map Example -04
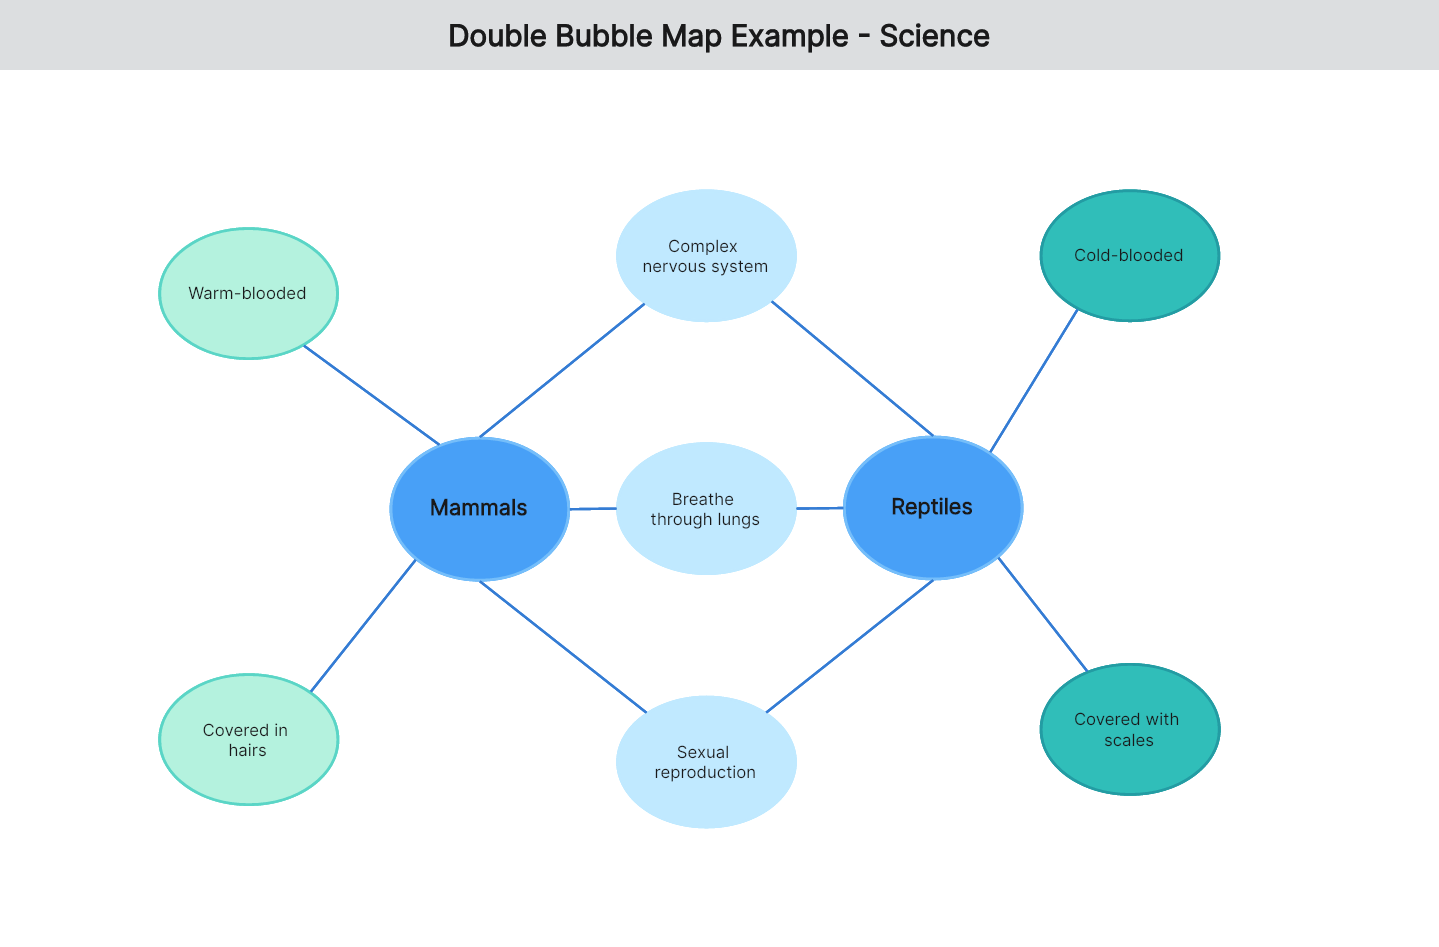
The next double bubble map example comes from biology as it compares mammals and reptiles. Both main ideas of the double bubble graphic organizer are connected to their similarities, which are that they are using a complex nervous system, they both breathe through lungs, and they go through sexual reproduction. Their differences include that the mammals are warm-blooded and are covered in hairs, while the reptiles are cold-blooded and are covered with scales.
Double Bubble Map Example -05
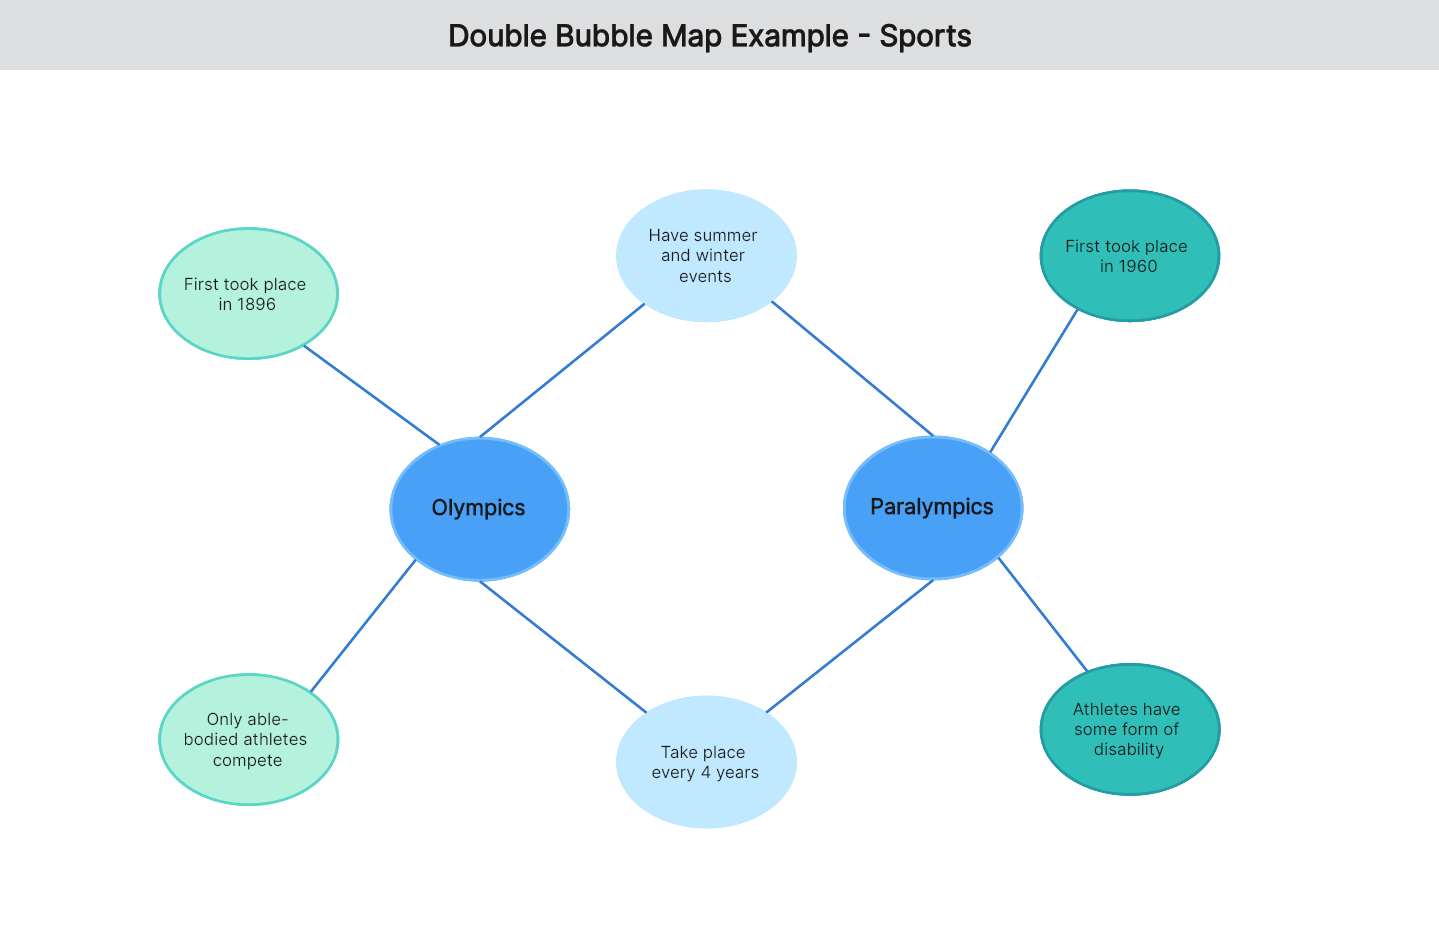
One more double bubble map example shows you a graph comparing the Olympic and the Paralympic games. In your double bubble map creator, you add as their similarities that they both have summer and winter events and they both take place every 4 years. The modern Olympics first took place in 1896 and only able-bodied athletes compete. The Paralympics first took place in 1960, and the athletes that compete have some form of physical or intellectual disability.
Double Bubble Map Example -06
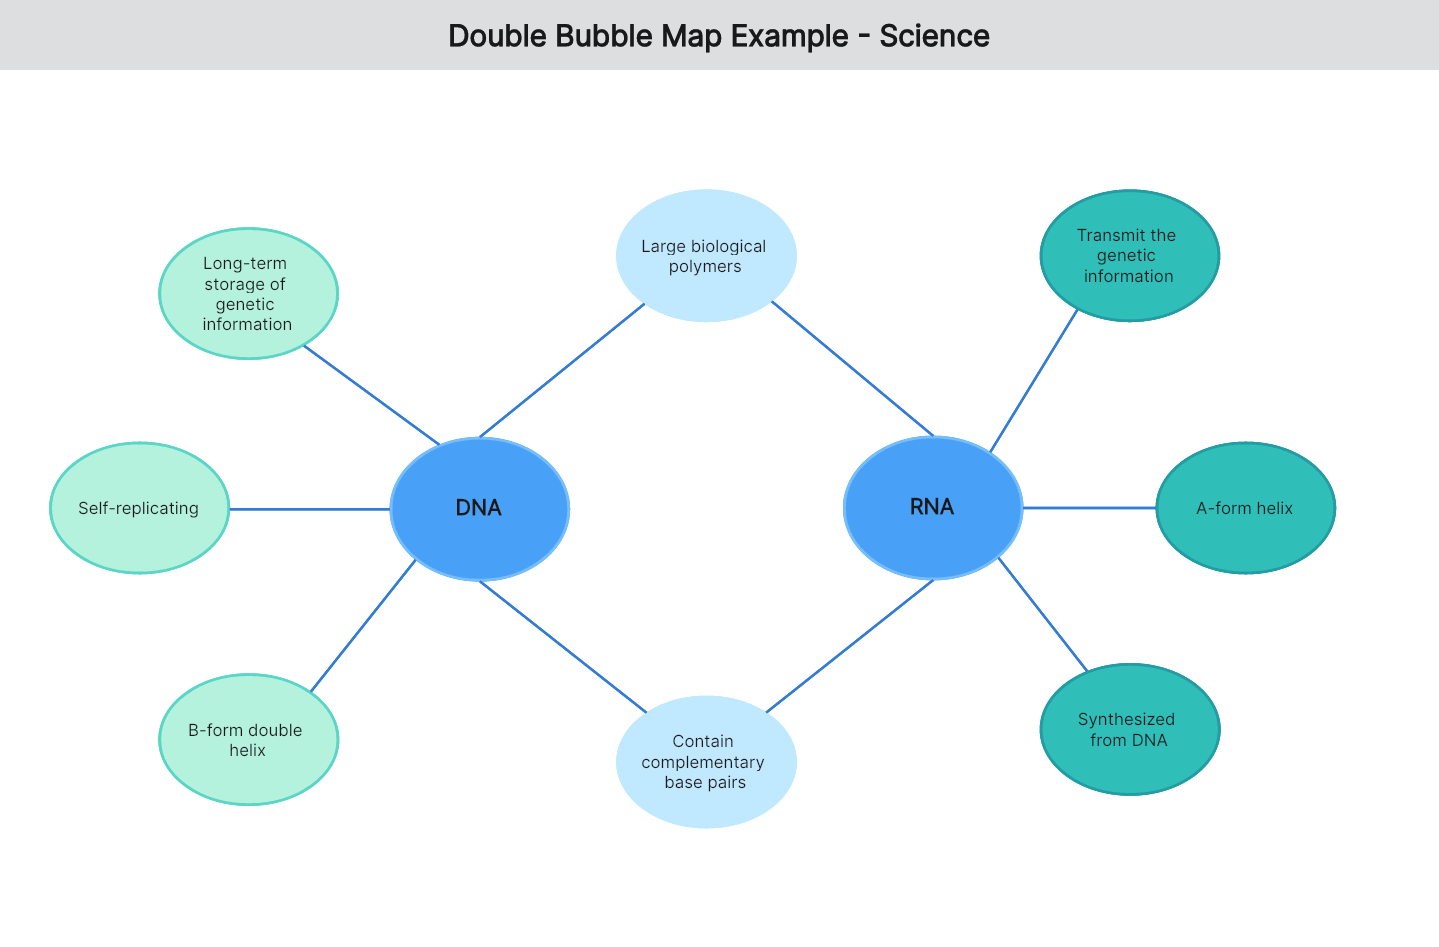
The final double bubble map example compares and contrasts the DNA and the RNA. To create this graph, you have to write that they both store genetic information, they are large biological polymers, and they contain complementary base pairs that are connected with hydrogen bonds. Then, your double bubble map creator will have additional bubbles so that you can write the individual attributes. DNA is a long-term storage of genetic information, is a B-form double helix, and is self-replicating. The RNA transmits the genetic information, is an A-form helix, and is synthesized from DNA.
How Do You Draw a Double Bubble Map
If you are interested in the double bubble graphic organizer, then you need to learn how to draw one. Luckily, Boardmix is one of the best double bubble map creators that you can use even without any technical or design skills. This tool brings you all the functions necessary to create and customize your graph in no time. Namely, you will find an easy-to-use and fully-customizable double bubble template that makes the process quicker and easier than ever before.

The steps for using Boardmix to create a double bubble map are the following:
Step 1 – Create your free Boardmix account.
Step 2 – Go to your workspace and click Templates.
Step 3 – Select the double bubble graphic organizer.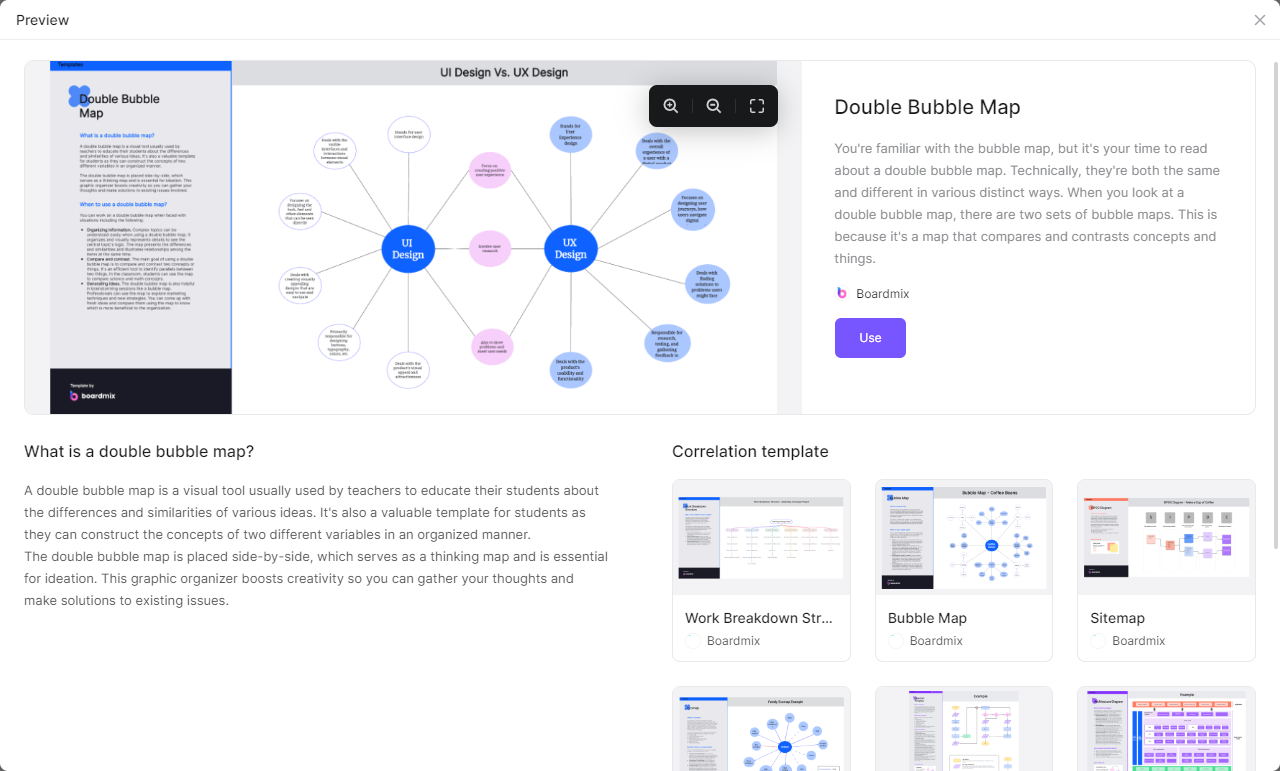
Step 4 – Add all the relevant information and customize your map accordingly using tools provided by Boardmix.
Step 5 – Share the double bubble map with your students.

In a Nutshell
The double bubble map is an invaluable tool for every classroom. Right now, you can take advantage of the most efficient double bubble map creator to draw high-quality maps that will help your students. Boardmix offers you high-quality double bubble map templates that allow you to create this graph by following some simple steps. Create your account for free to get started with this amazing online tool right now!


