

Welcome to the captivating world of Entity Relationship Diagrams (ER Diagrams)! No matter if you're a beginner; eager to learn or a seasoned professional looking to brush up on the basics. This guide is your go-to resource.
Diving right in, we'll demystify what ER diagrams are, their symbols, and notations. By painting a vivid picture of their structure, we'll set a solid foundation for your learning journey. But, we won't stop at the theory.
Taking a step further into the practical realm, we'll explore 9 real-world ER Diagram examples. From the everyday processes of a Hospital Billing System to the intricate operations of a Software Engineering firm, we're going to delve into a wide variety of scenarios.
And the best part? You'll not only learn about these systems but get to create your very own ER diagrams with our easy-to-follow guide. With the help of Boardmix, our intuitive diagramming tool, you'll be on your way to becoming an ER Diagram expert in no time!
So, are you ready to embark on this enriching journey? Let's dive in!
What Is an ER Diagram
What is an ER diagram, you might ask? Let me unveil the mystery. An ER diagram, or entity-relationship diagram, is a visual representation of the major entities within a system. But it's not just about listing entities. It's about painting a vivid picture of how these entities interact with each other.
You might be thinking why are ER diagrams important, and where are they used? From databases to software engineering. ER Diagrams are integral in simplifying and visualizing complex data structures. By giving us a bird's eye view, they help us understand the intricacies of a system and make data-driven decisions.
Symbols & Notations of ER Diagrams
Once we've grasped the essence of the ER diagram, it's time to dive into the technicalities. This world is filled with symbols and notations, which may appear cryptic at first glance. But fear not, we'll master this together.
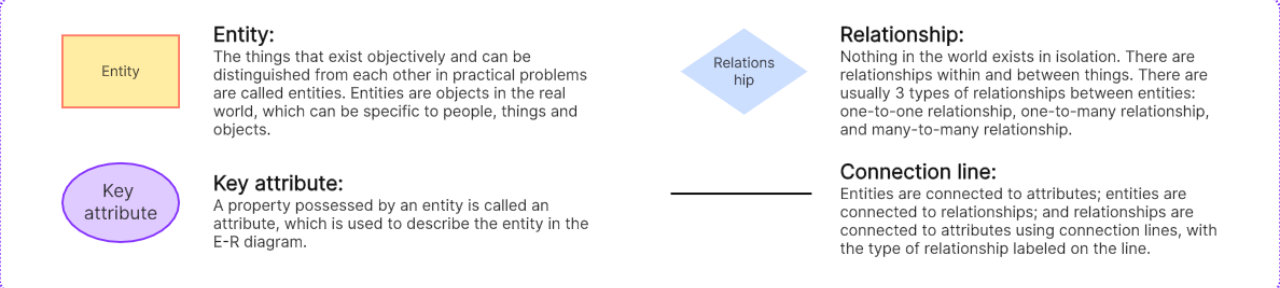
The ER diagram consists of three primary symbols: entities, attributes, and relationships.
- Entities are represented by rectangles, like name tags on suitcases, making them easy to identify.
- Attributes, depicted as ovals connected to entities, describe their properties.
- Relationships, showcased by diamond shapes, bind entities together, showing how they interact.
As we traverse this landscape, we might encounter cardinality and ordinality symbols, defining numerical attributes and minimum relationship requirements. Understanding these symbols will help us navigate the intricate world of data organization, making ER Diagrams an effective tool in database design.
9 ER Diagram Examples
To fully comprehend the versatility and real-world application of ER Diagrams, it's best to examine a range of erd examples. In this chapter, I will guide you through 9 different entity relationship diagram examples each reflecting a specific system or scenario.
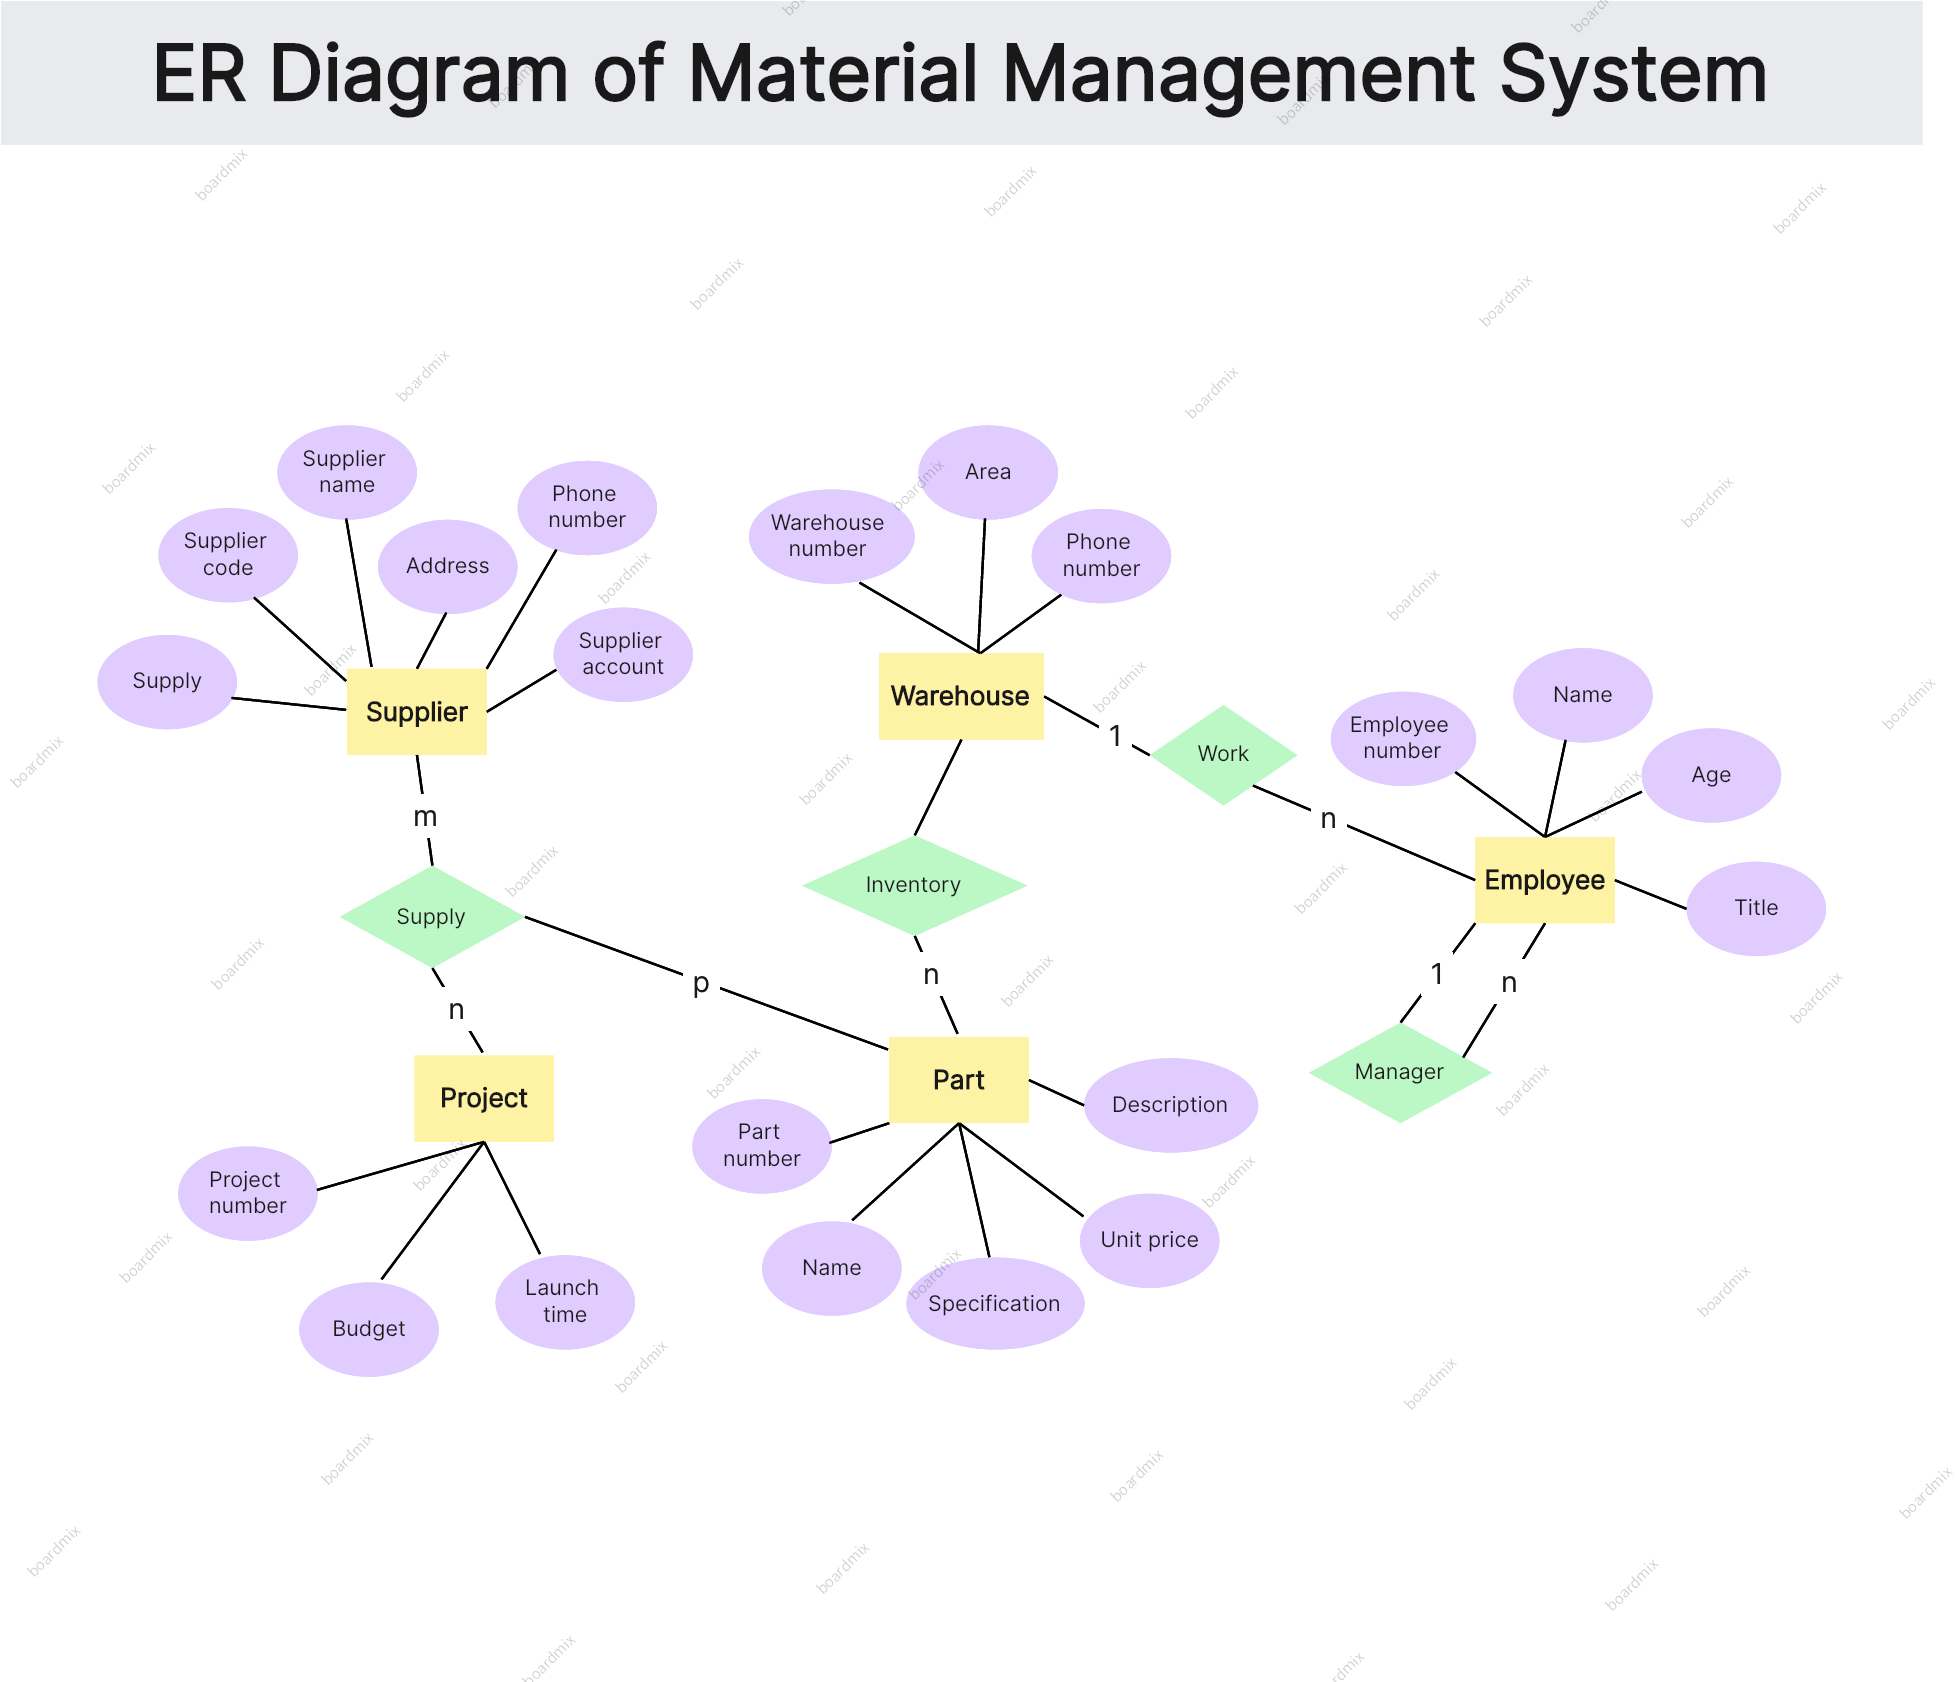
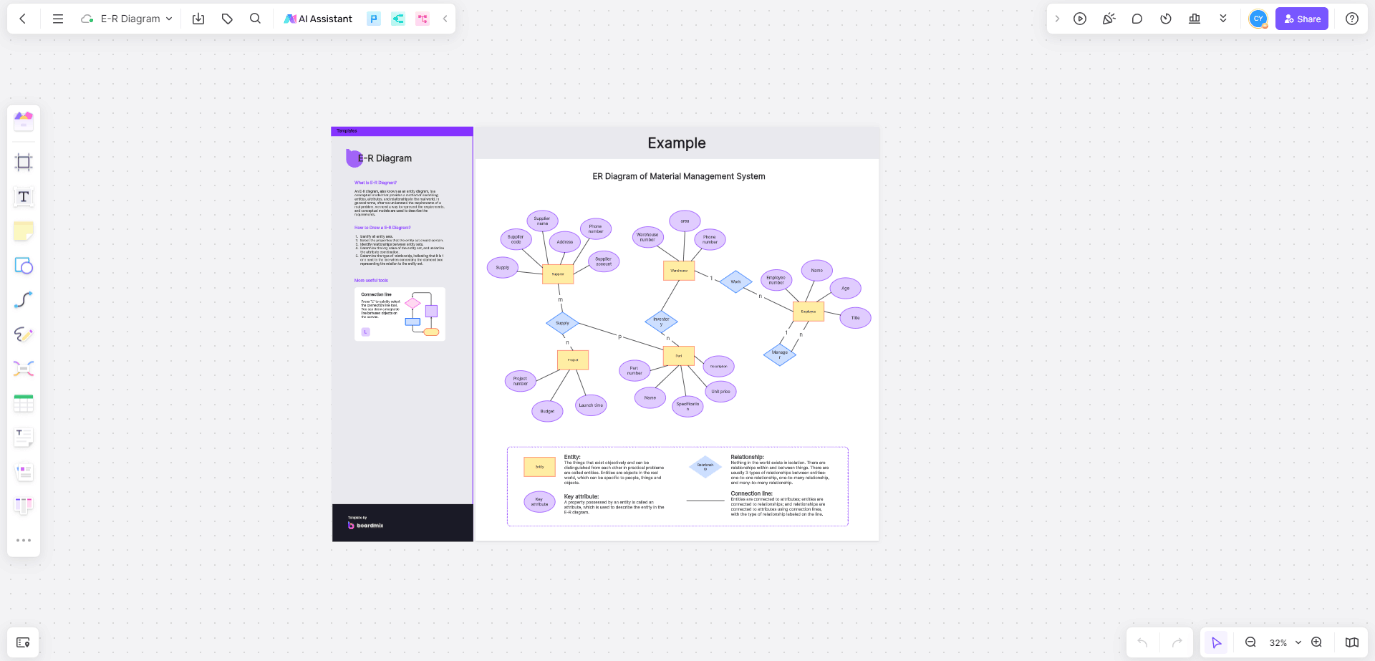
Material Management System
The material management system ER Diagram would include entities like Supplier, Warehouse, Employee, Project and Part. Relationships could involve 'Supplier provides Project', 'Employee works in Warehouse', and 'Warehouse stores parts'. Attributes might detail the Supplier's name, Warehouse number, and Employee's name.
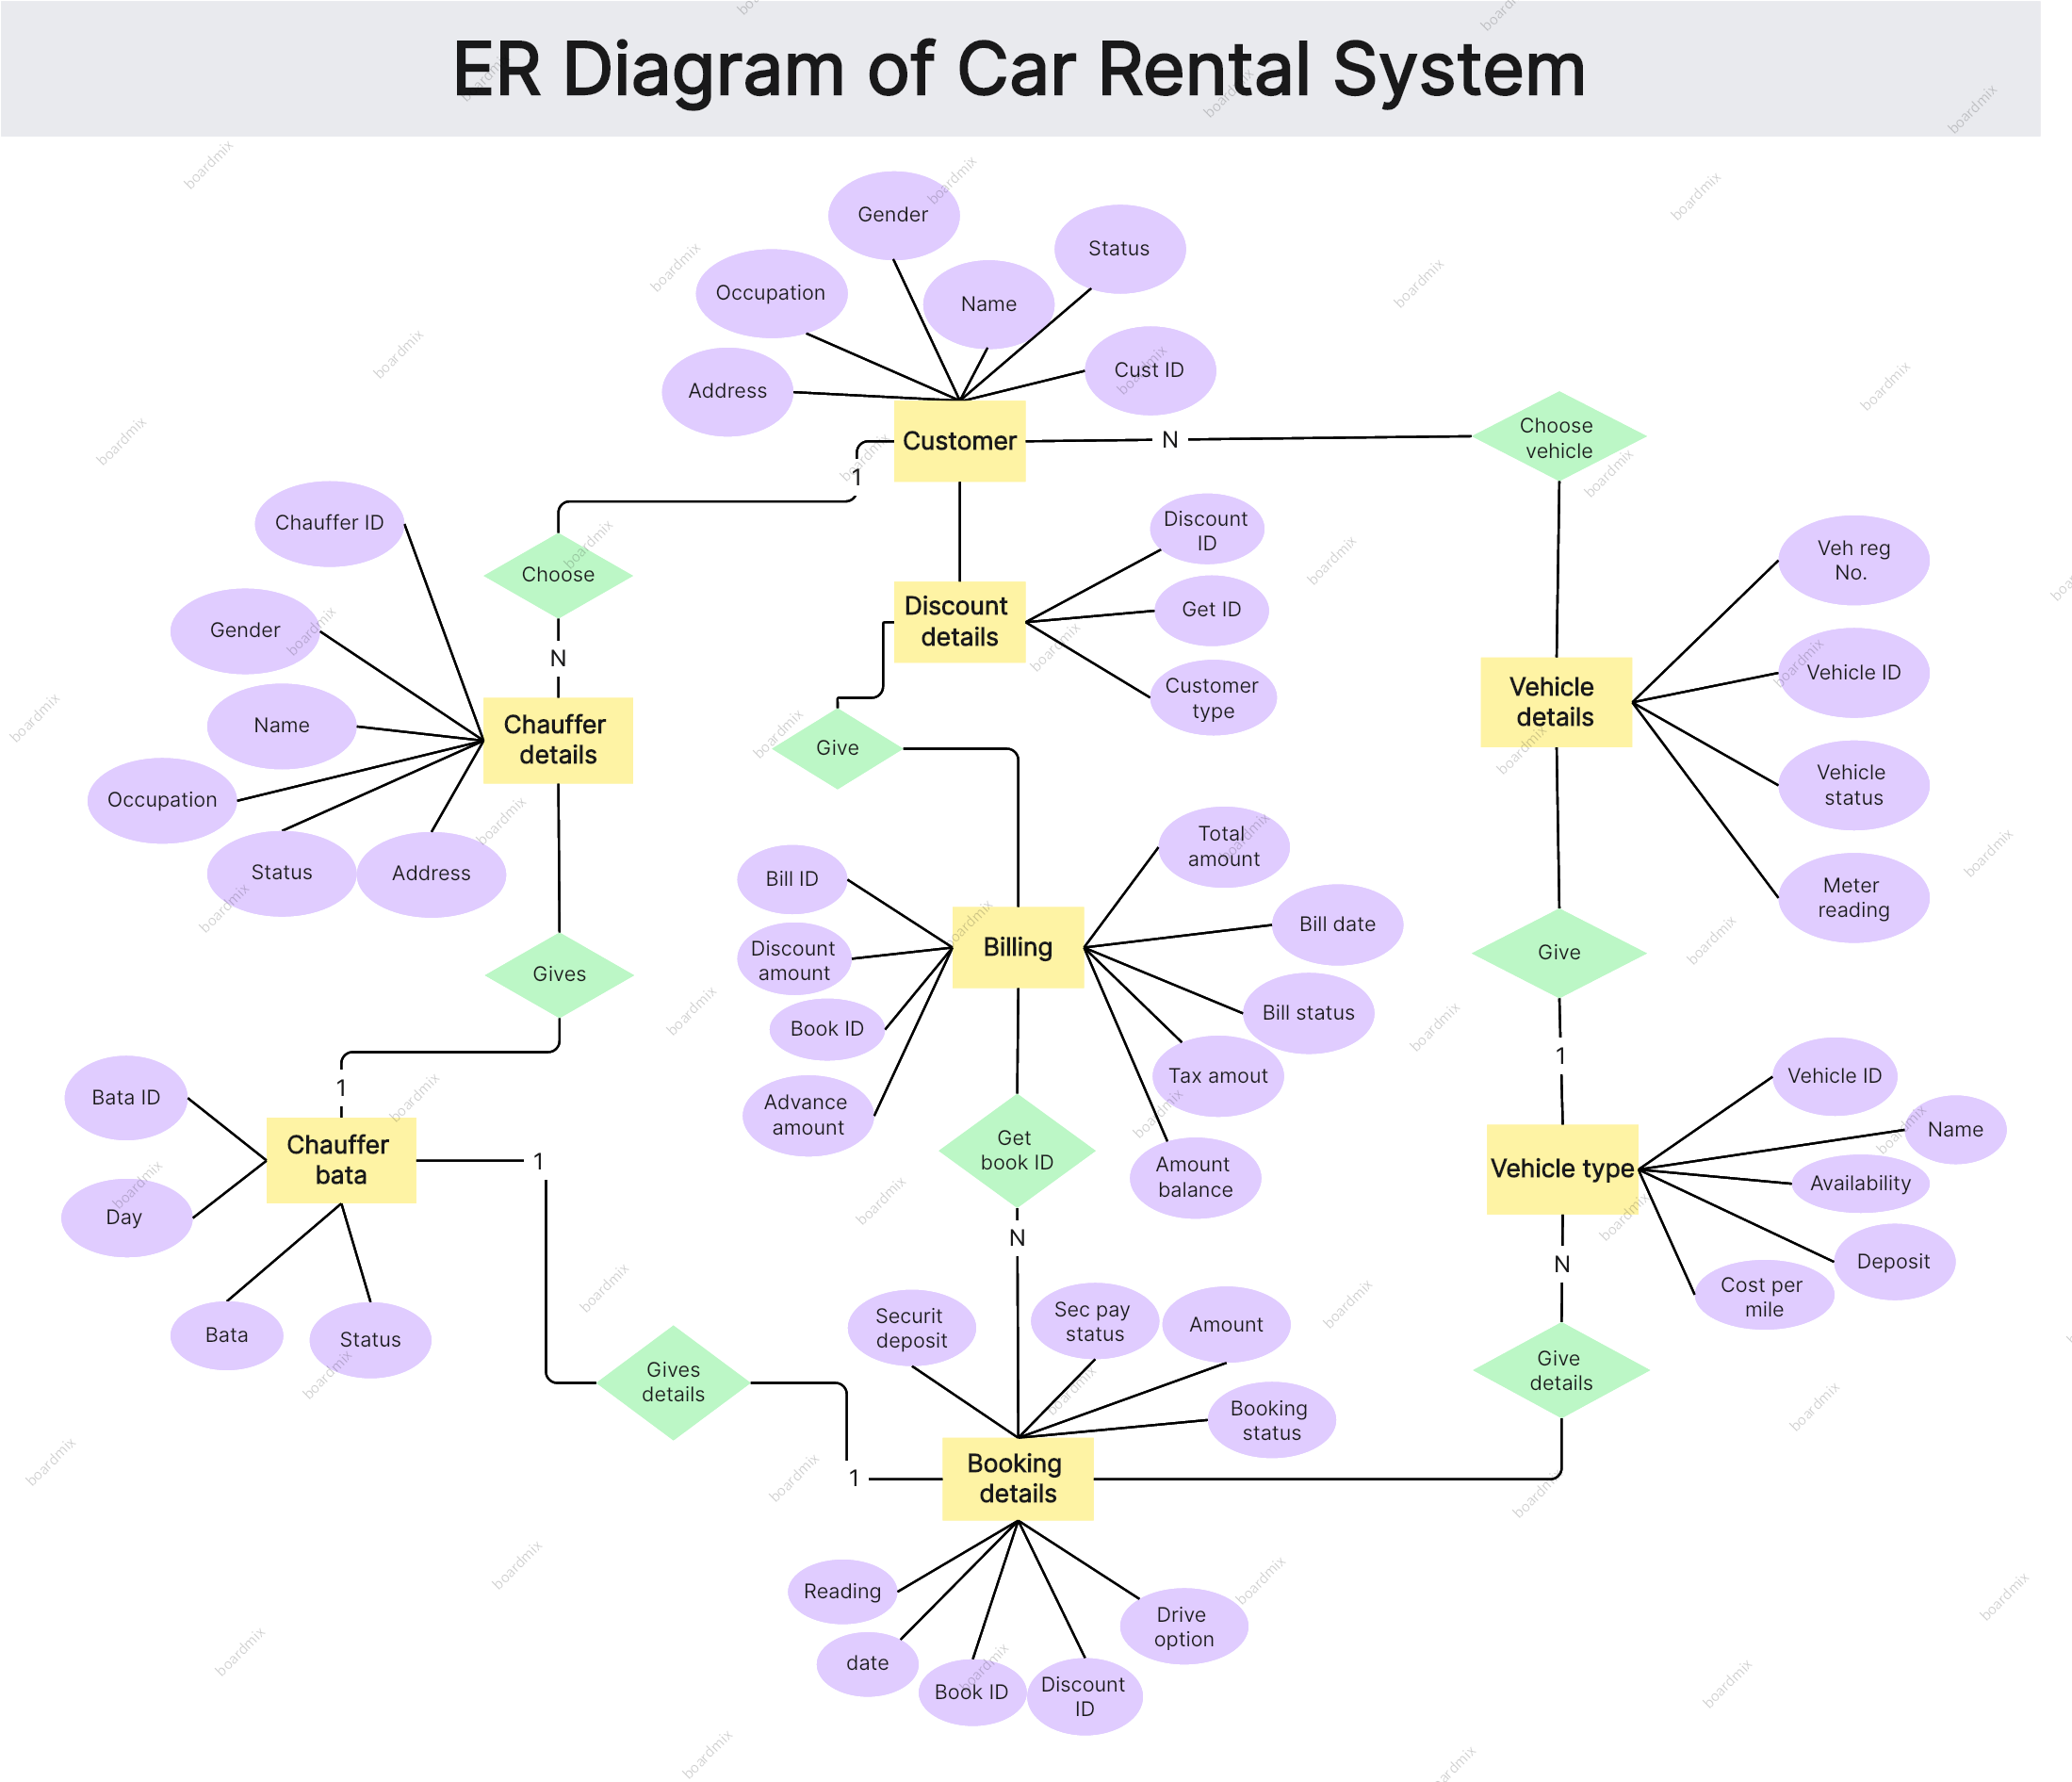
Car Rental System
For a car rental system, the ER Diagram would feature entities such as Customer, Vehicle, Rental Agreement, and Payment. Relationships could be 'Customer rents Vehicle', 'Rental Agreement details Vehicle' and 'Customer makes Payment'. Attributes could comprise the Driver's license number, Vehicle's VIN, Rental Agreement's terms, and Payment's amount.
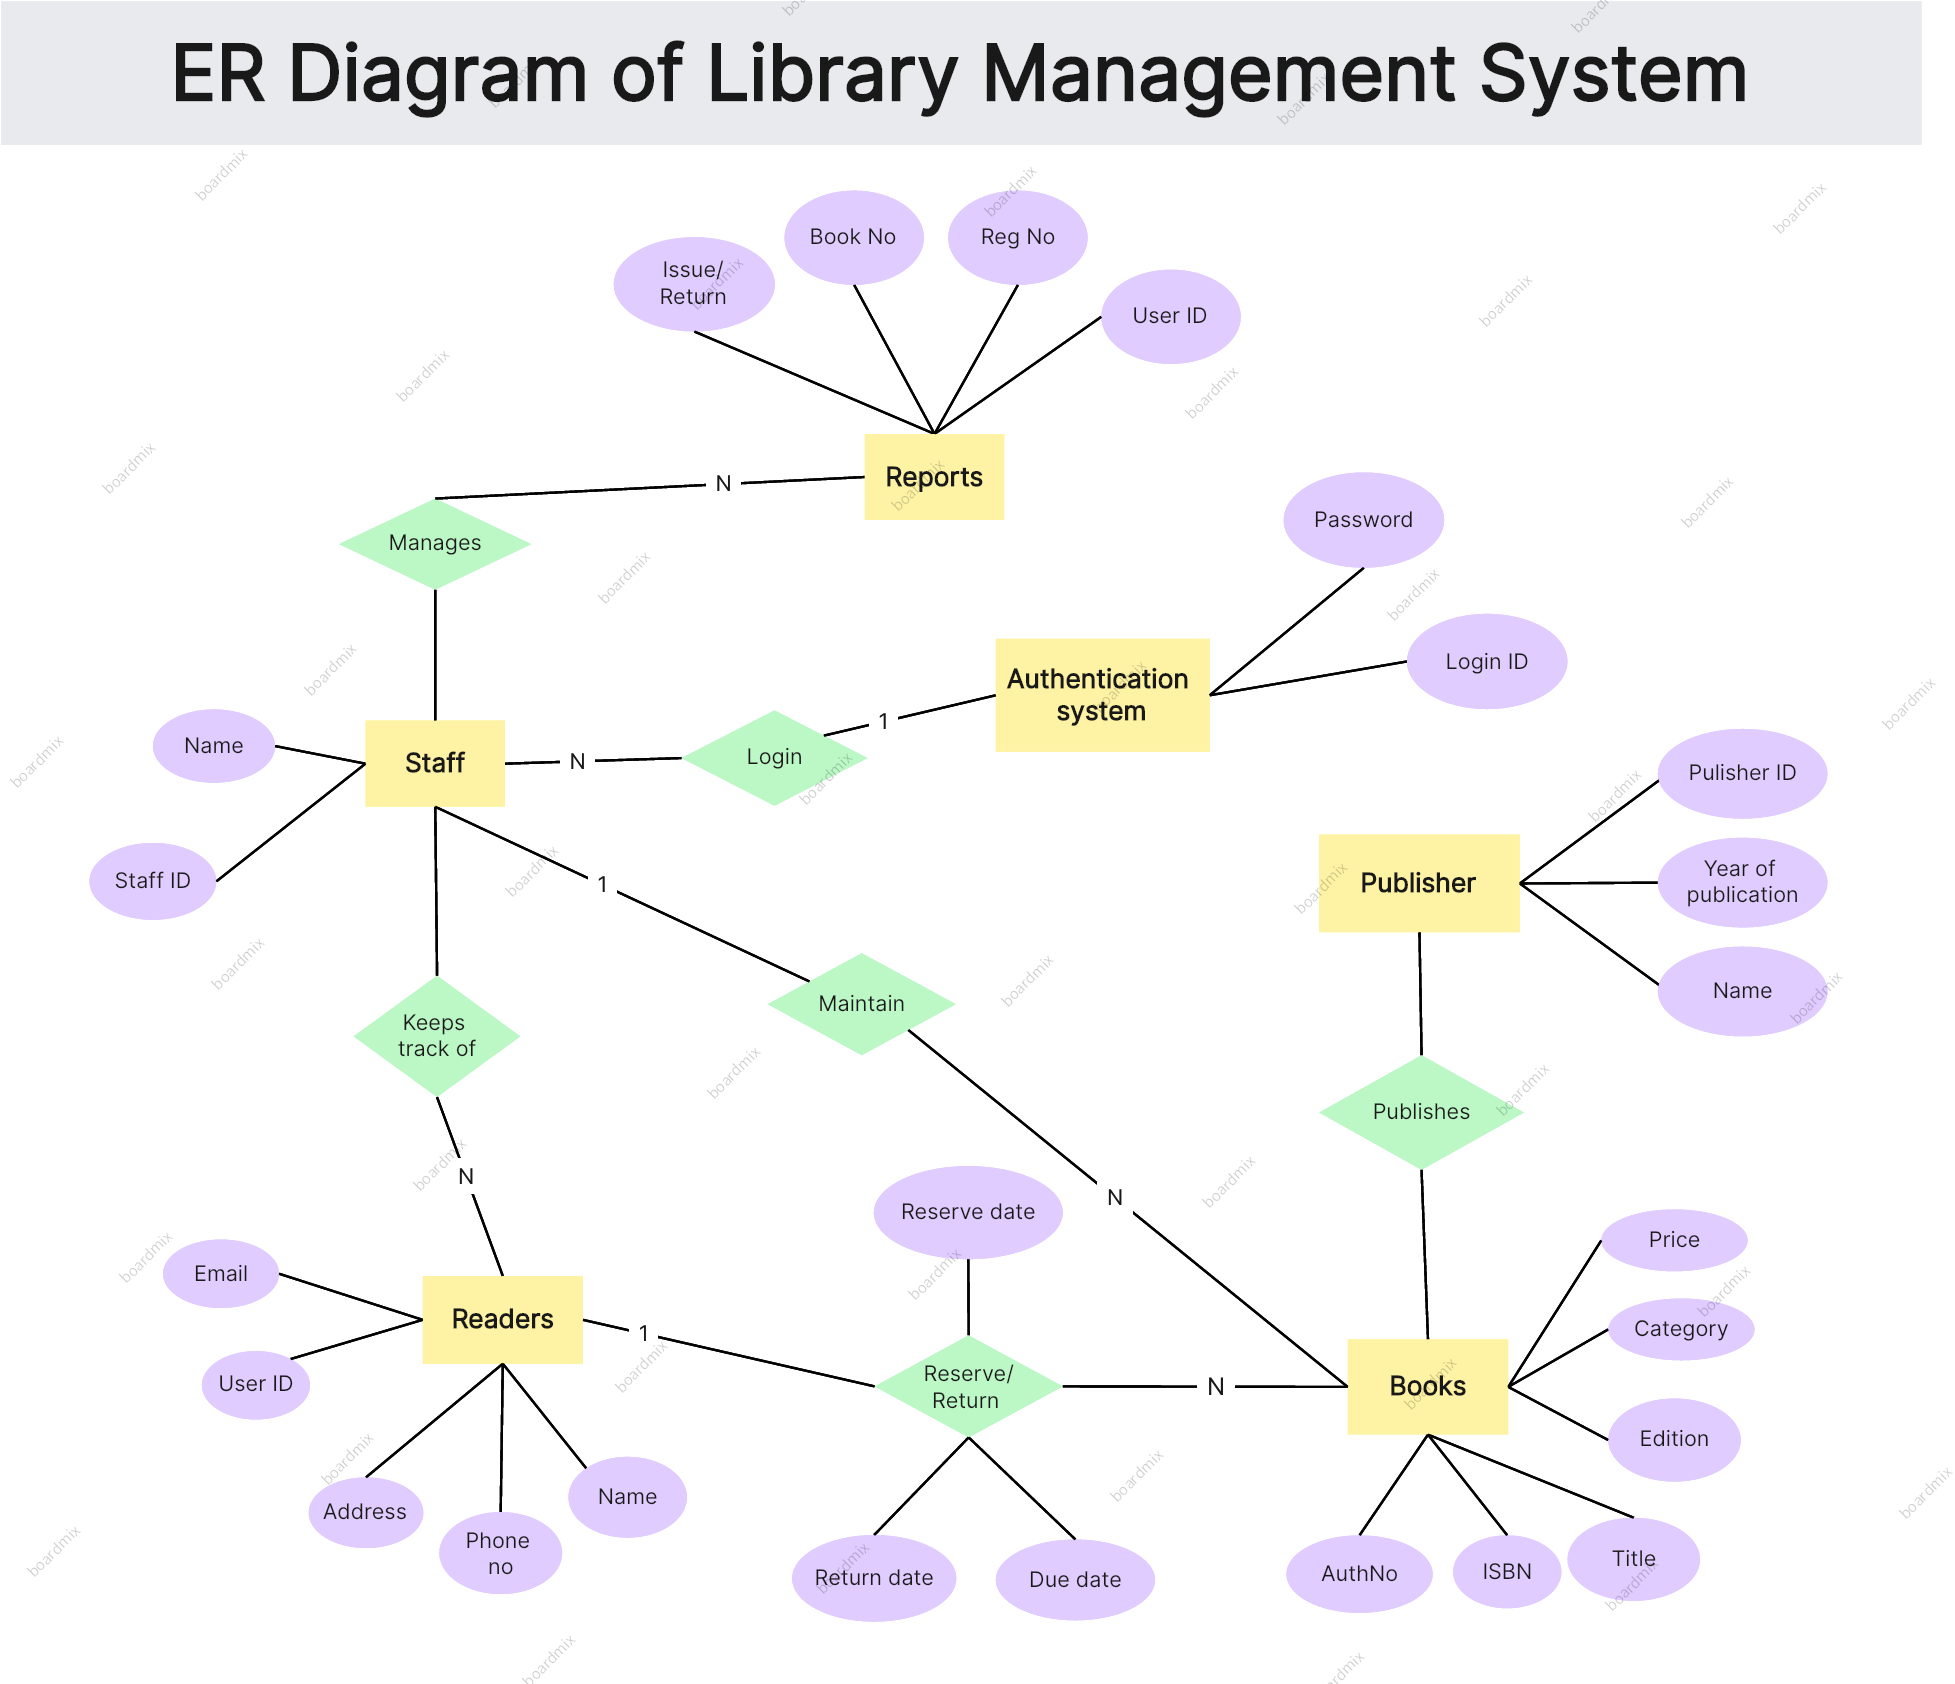
Library Management System
In a library management system, entities would include Book, Borrower, Loan, and Librarian. Key relationships could be 'Borrower loans Book', 'Loan managed by Librarian'. Attributes would indicate details like the Book's ISBN, Borrower's membership ID, Loan's due date, and Librarian's name.
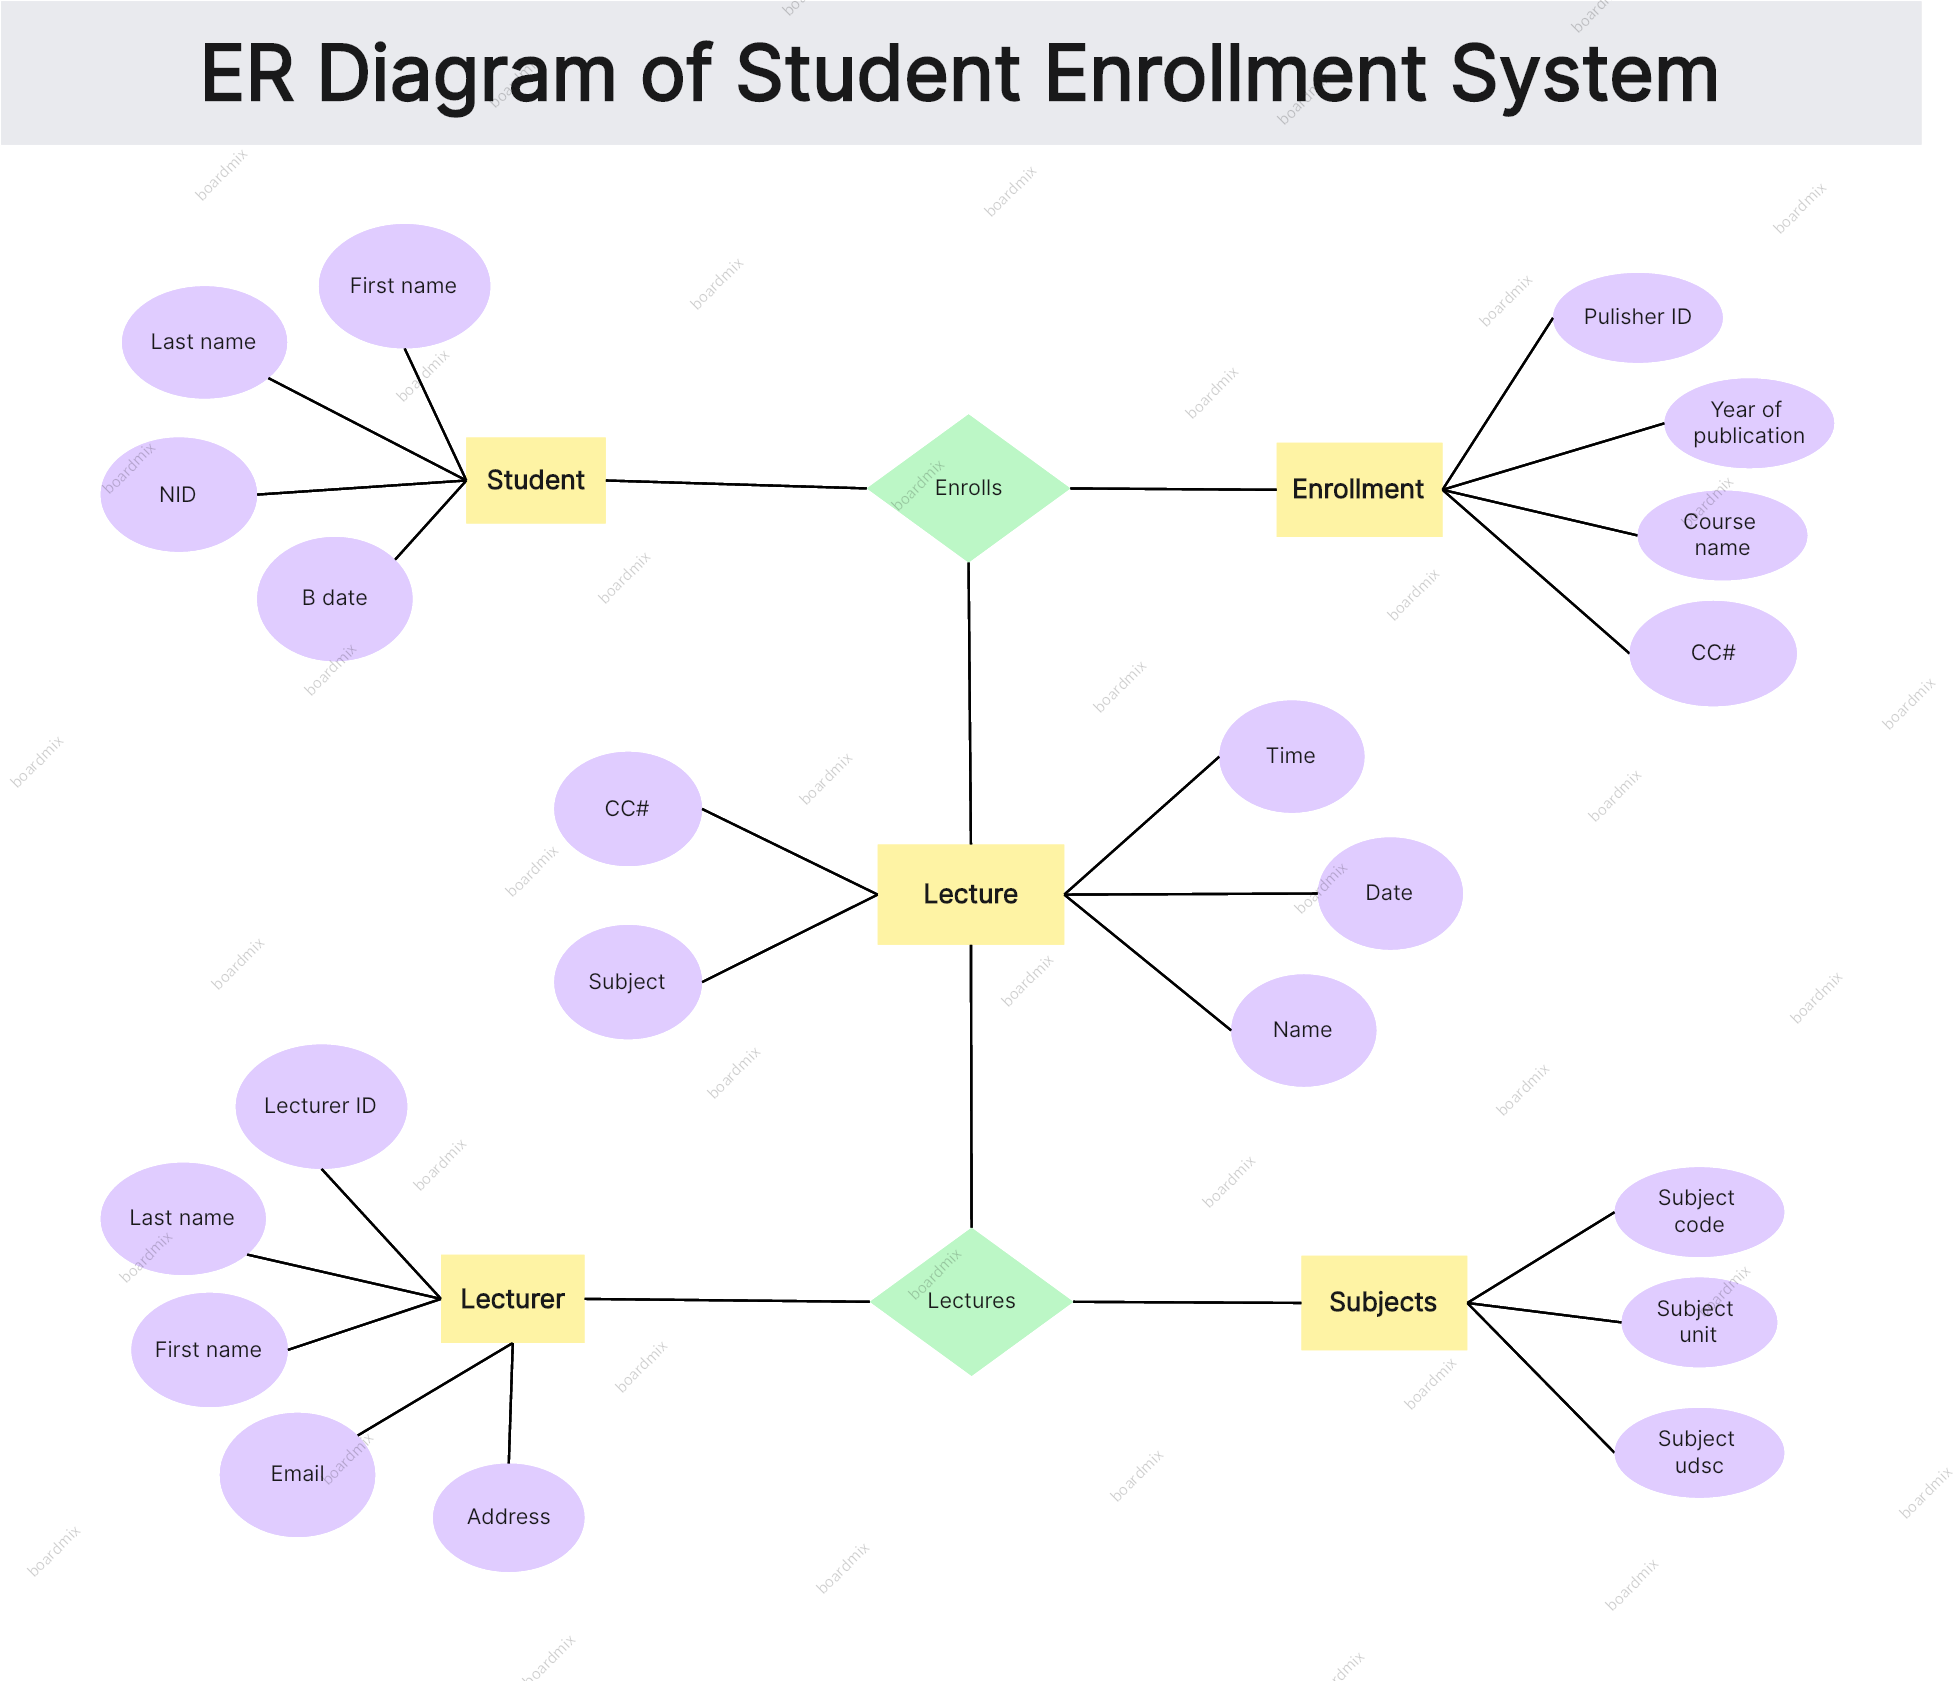
Student Enrollment System
The ER diagram for a student enrollment system might consist of entities like Student, Course, Enrollment, and Faculty. Relationships may include 'Student enrolls in Course', 'Enrollment overseen by Faculty'. Attributes would specify the Student's ID, Course's code, Enrollment's date, and Faculty's department.
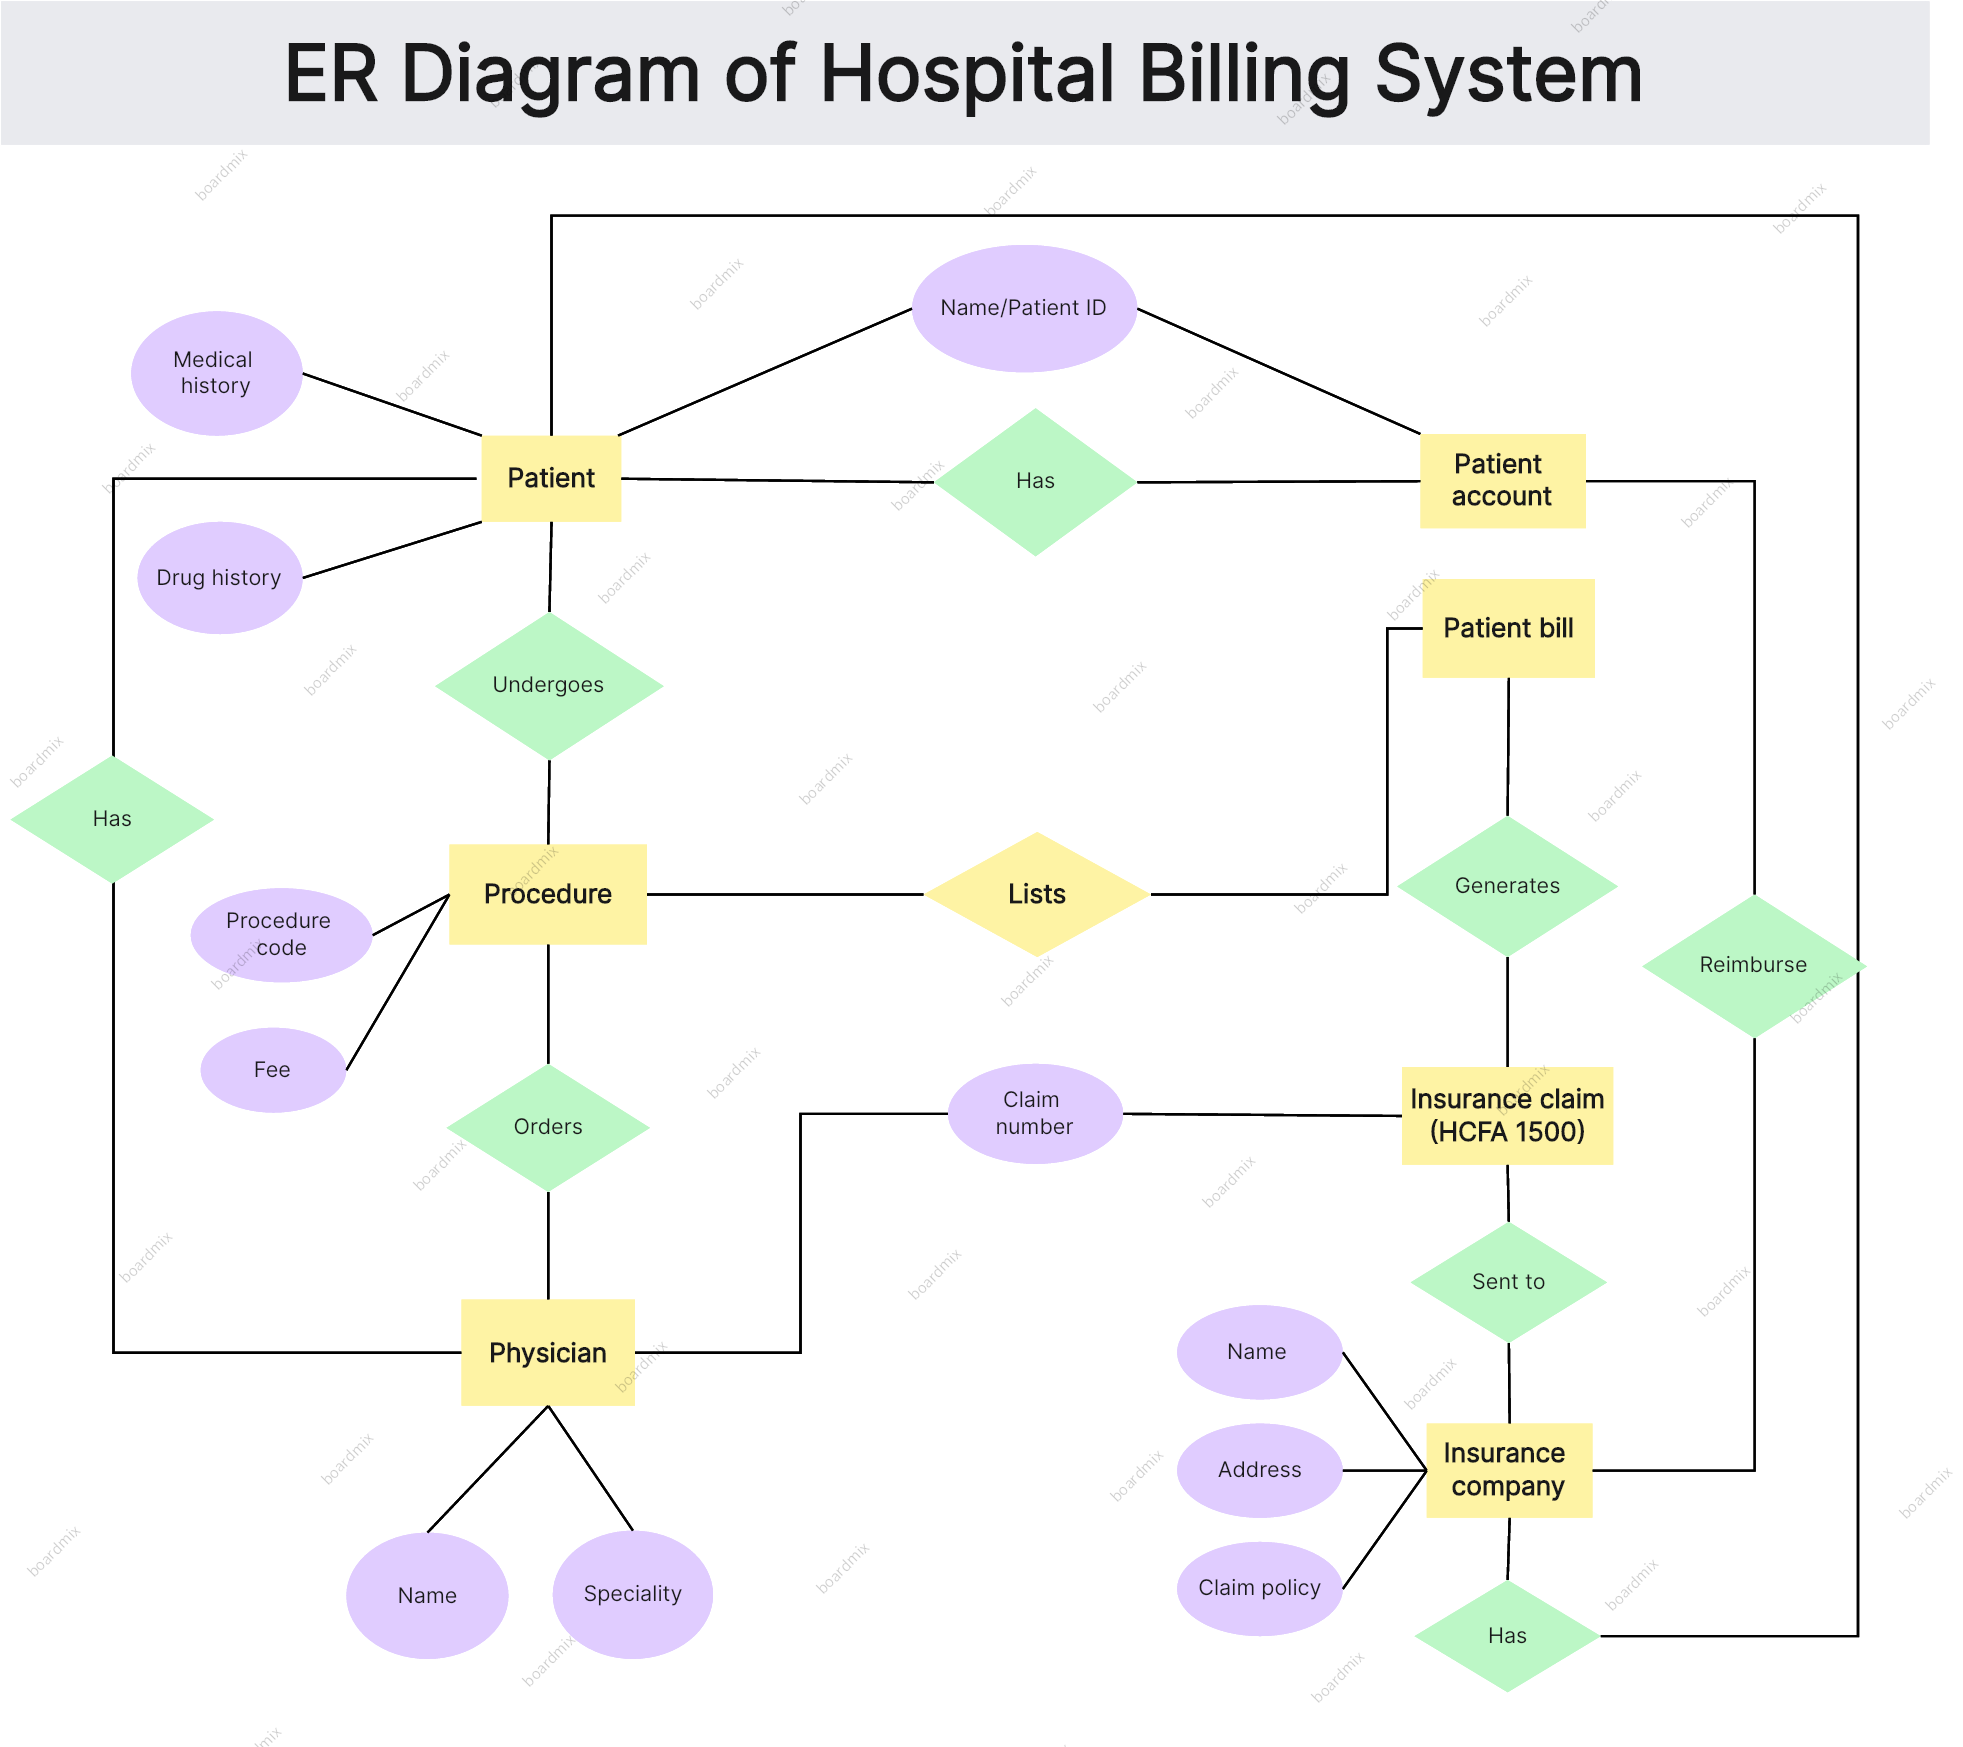
Hospital Billing System
For a hospital billing system, entities such as Patient, Procedure, Bill, and Insurance would be included. The relationships would involve 'Patient undergoes Procedure', 'Bill generated for Procedure', 'Insurance covers Bill'. Attributes could include the Patient's name, Procedure's cost, Bill's total amount, and Insurance's policy number.
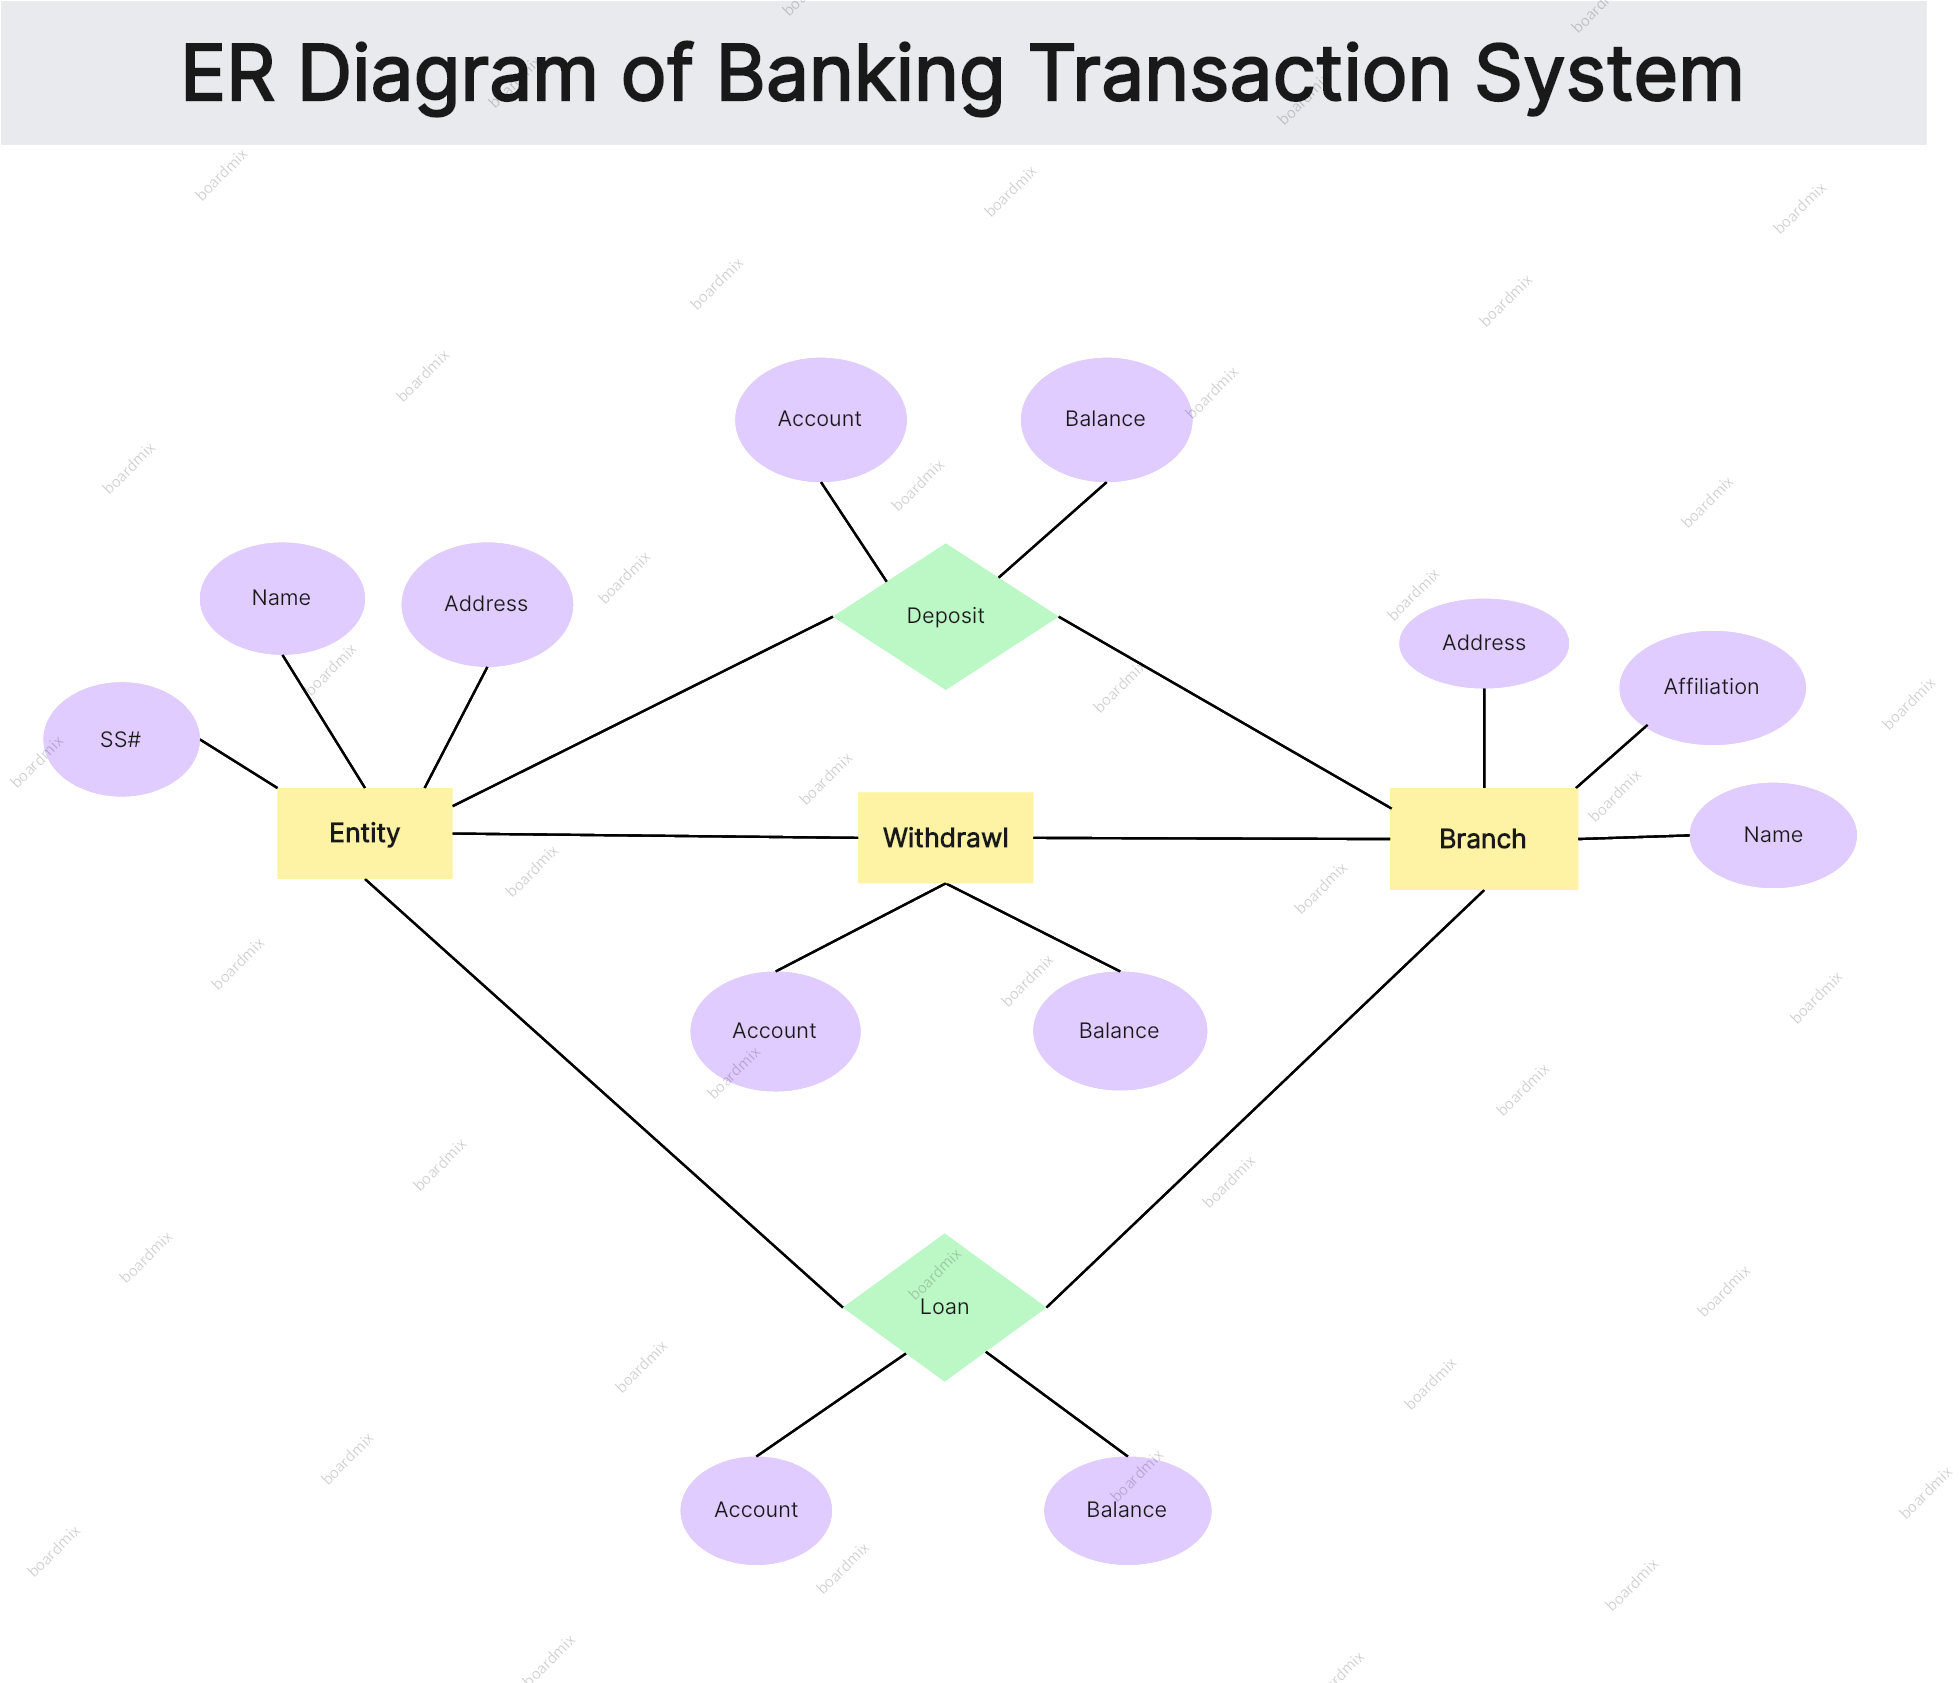
Banking Transaction System
In the banking transaction system's ER Diagram, entities like Customer, Account, Transaction, and Bank Branch are essential. Relationships might be 'Customer owns Account', 'Transaction debits/credits Account', 'Account managed by Bank Branch'. Attributes might cover the Customer's SSN, Account's number, Transaction's date, and Bank Branch's location.
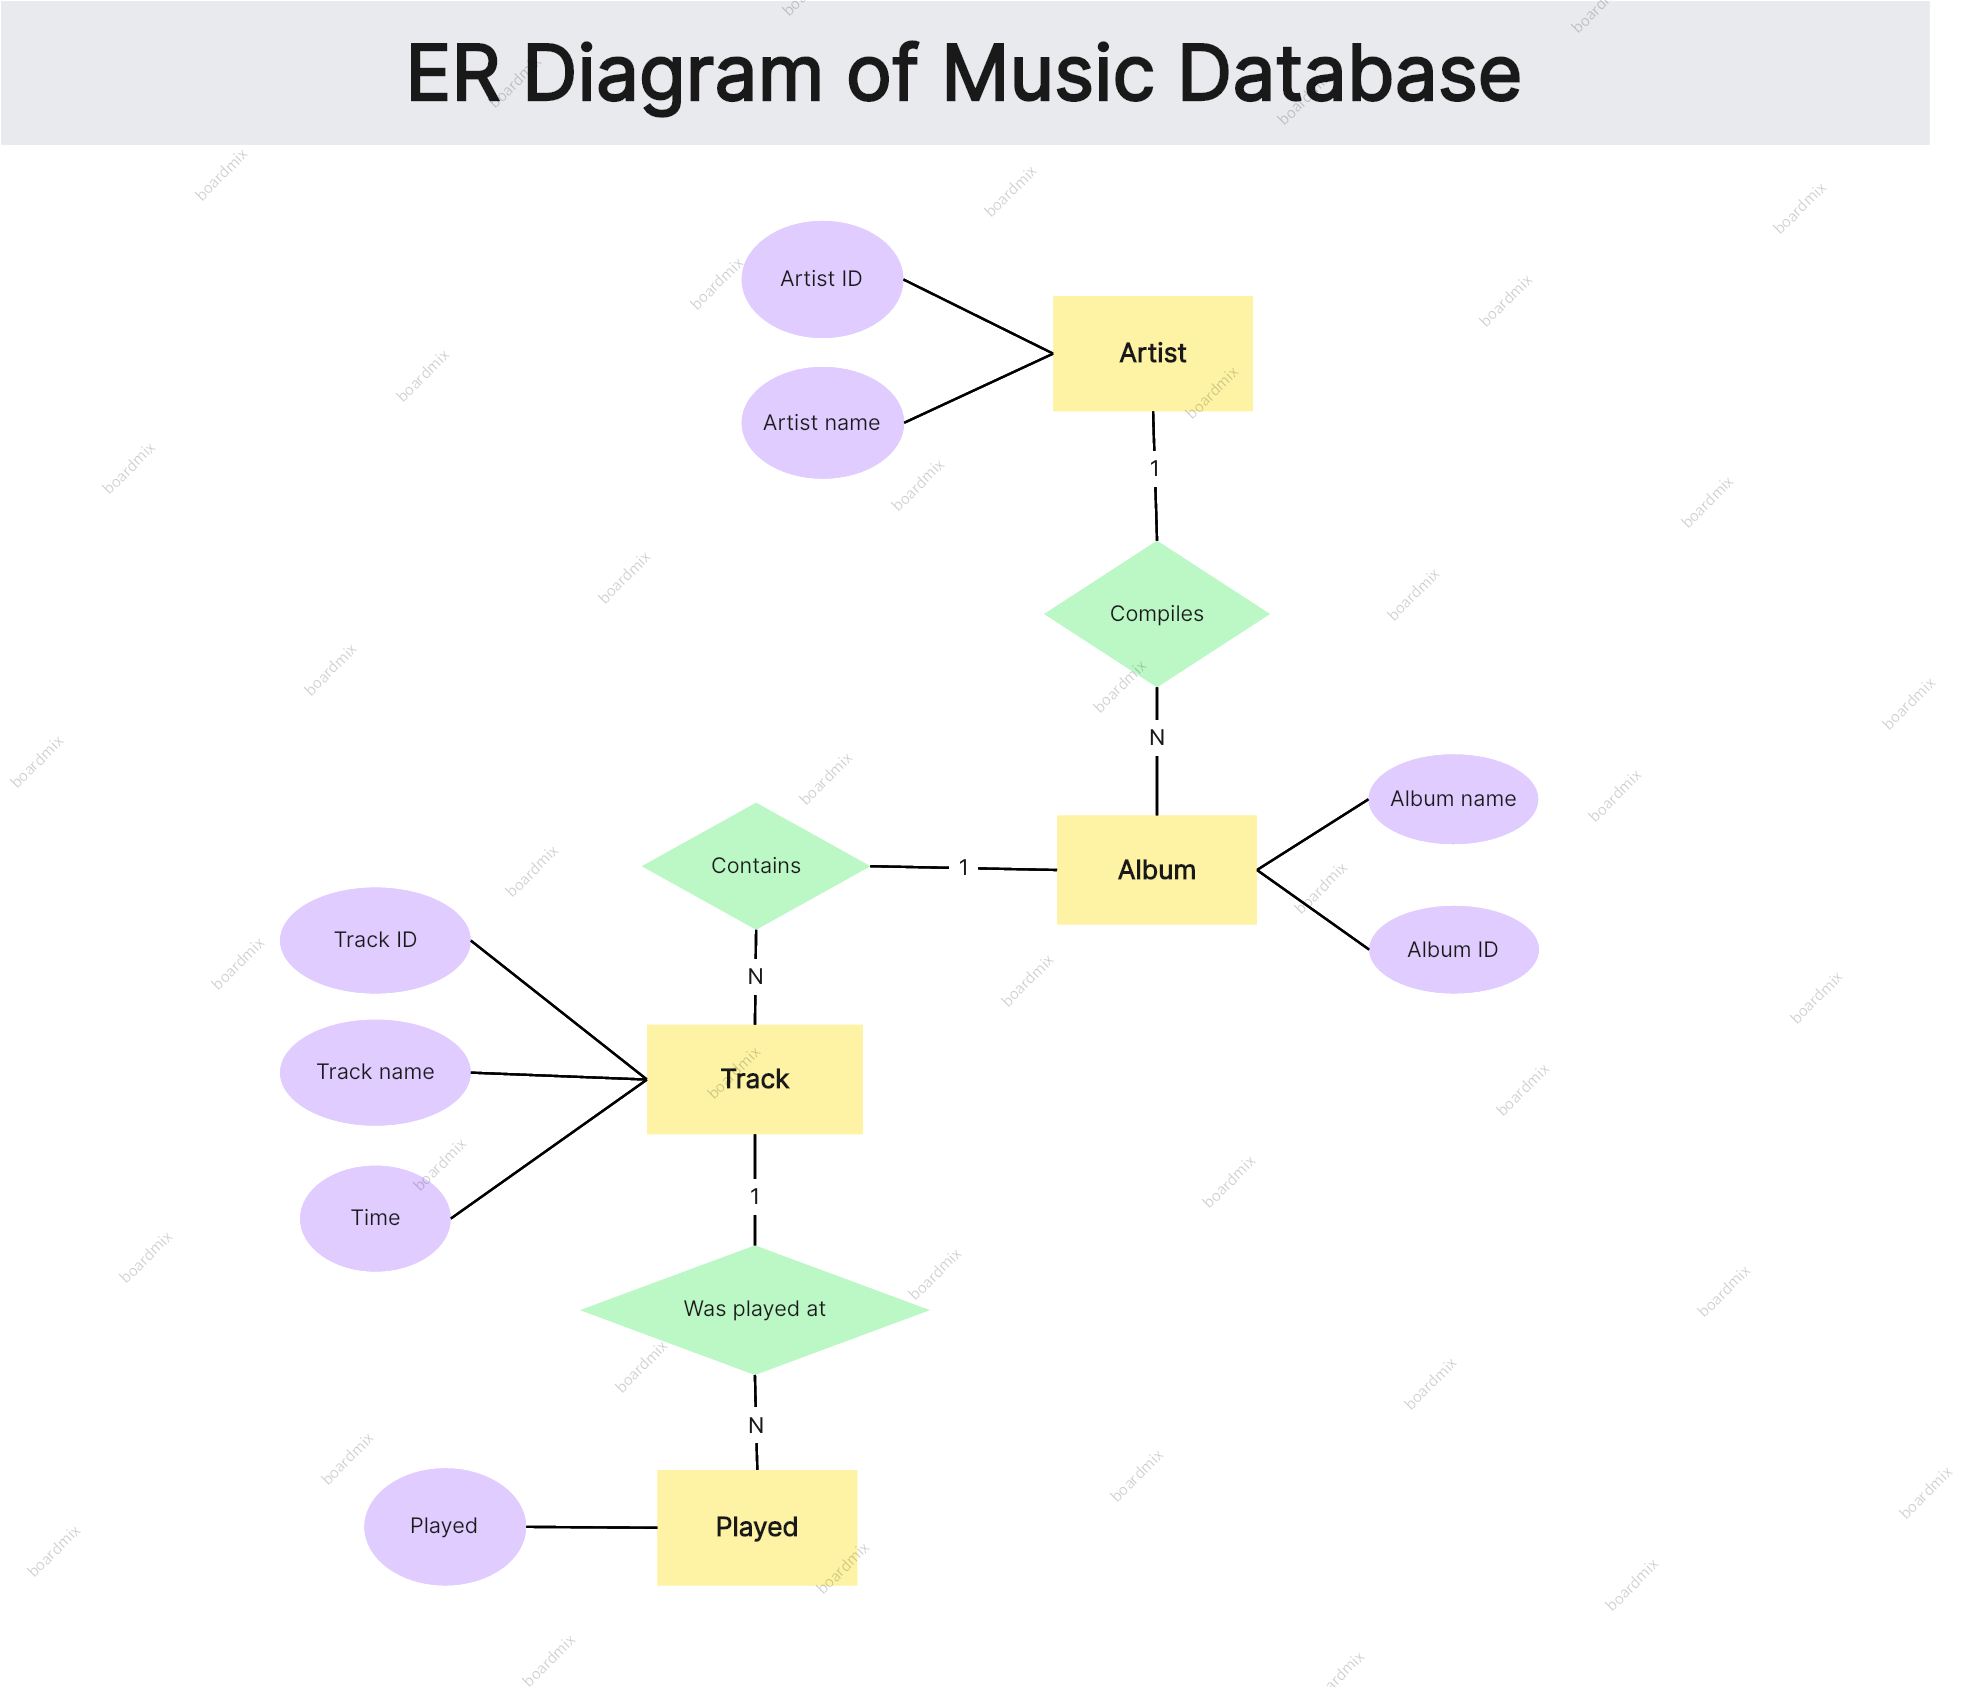
Music Database
A music database ER diagram would contain entities like Artist, Album, Song, and Genre. Relationships could involve 'Artist records Album', 'Album contains Song', 'Song categorized as Genre'. Attributes would comprise the Artist's name, Album's release year, Song's duration, and Genre's description.
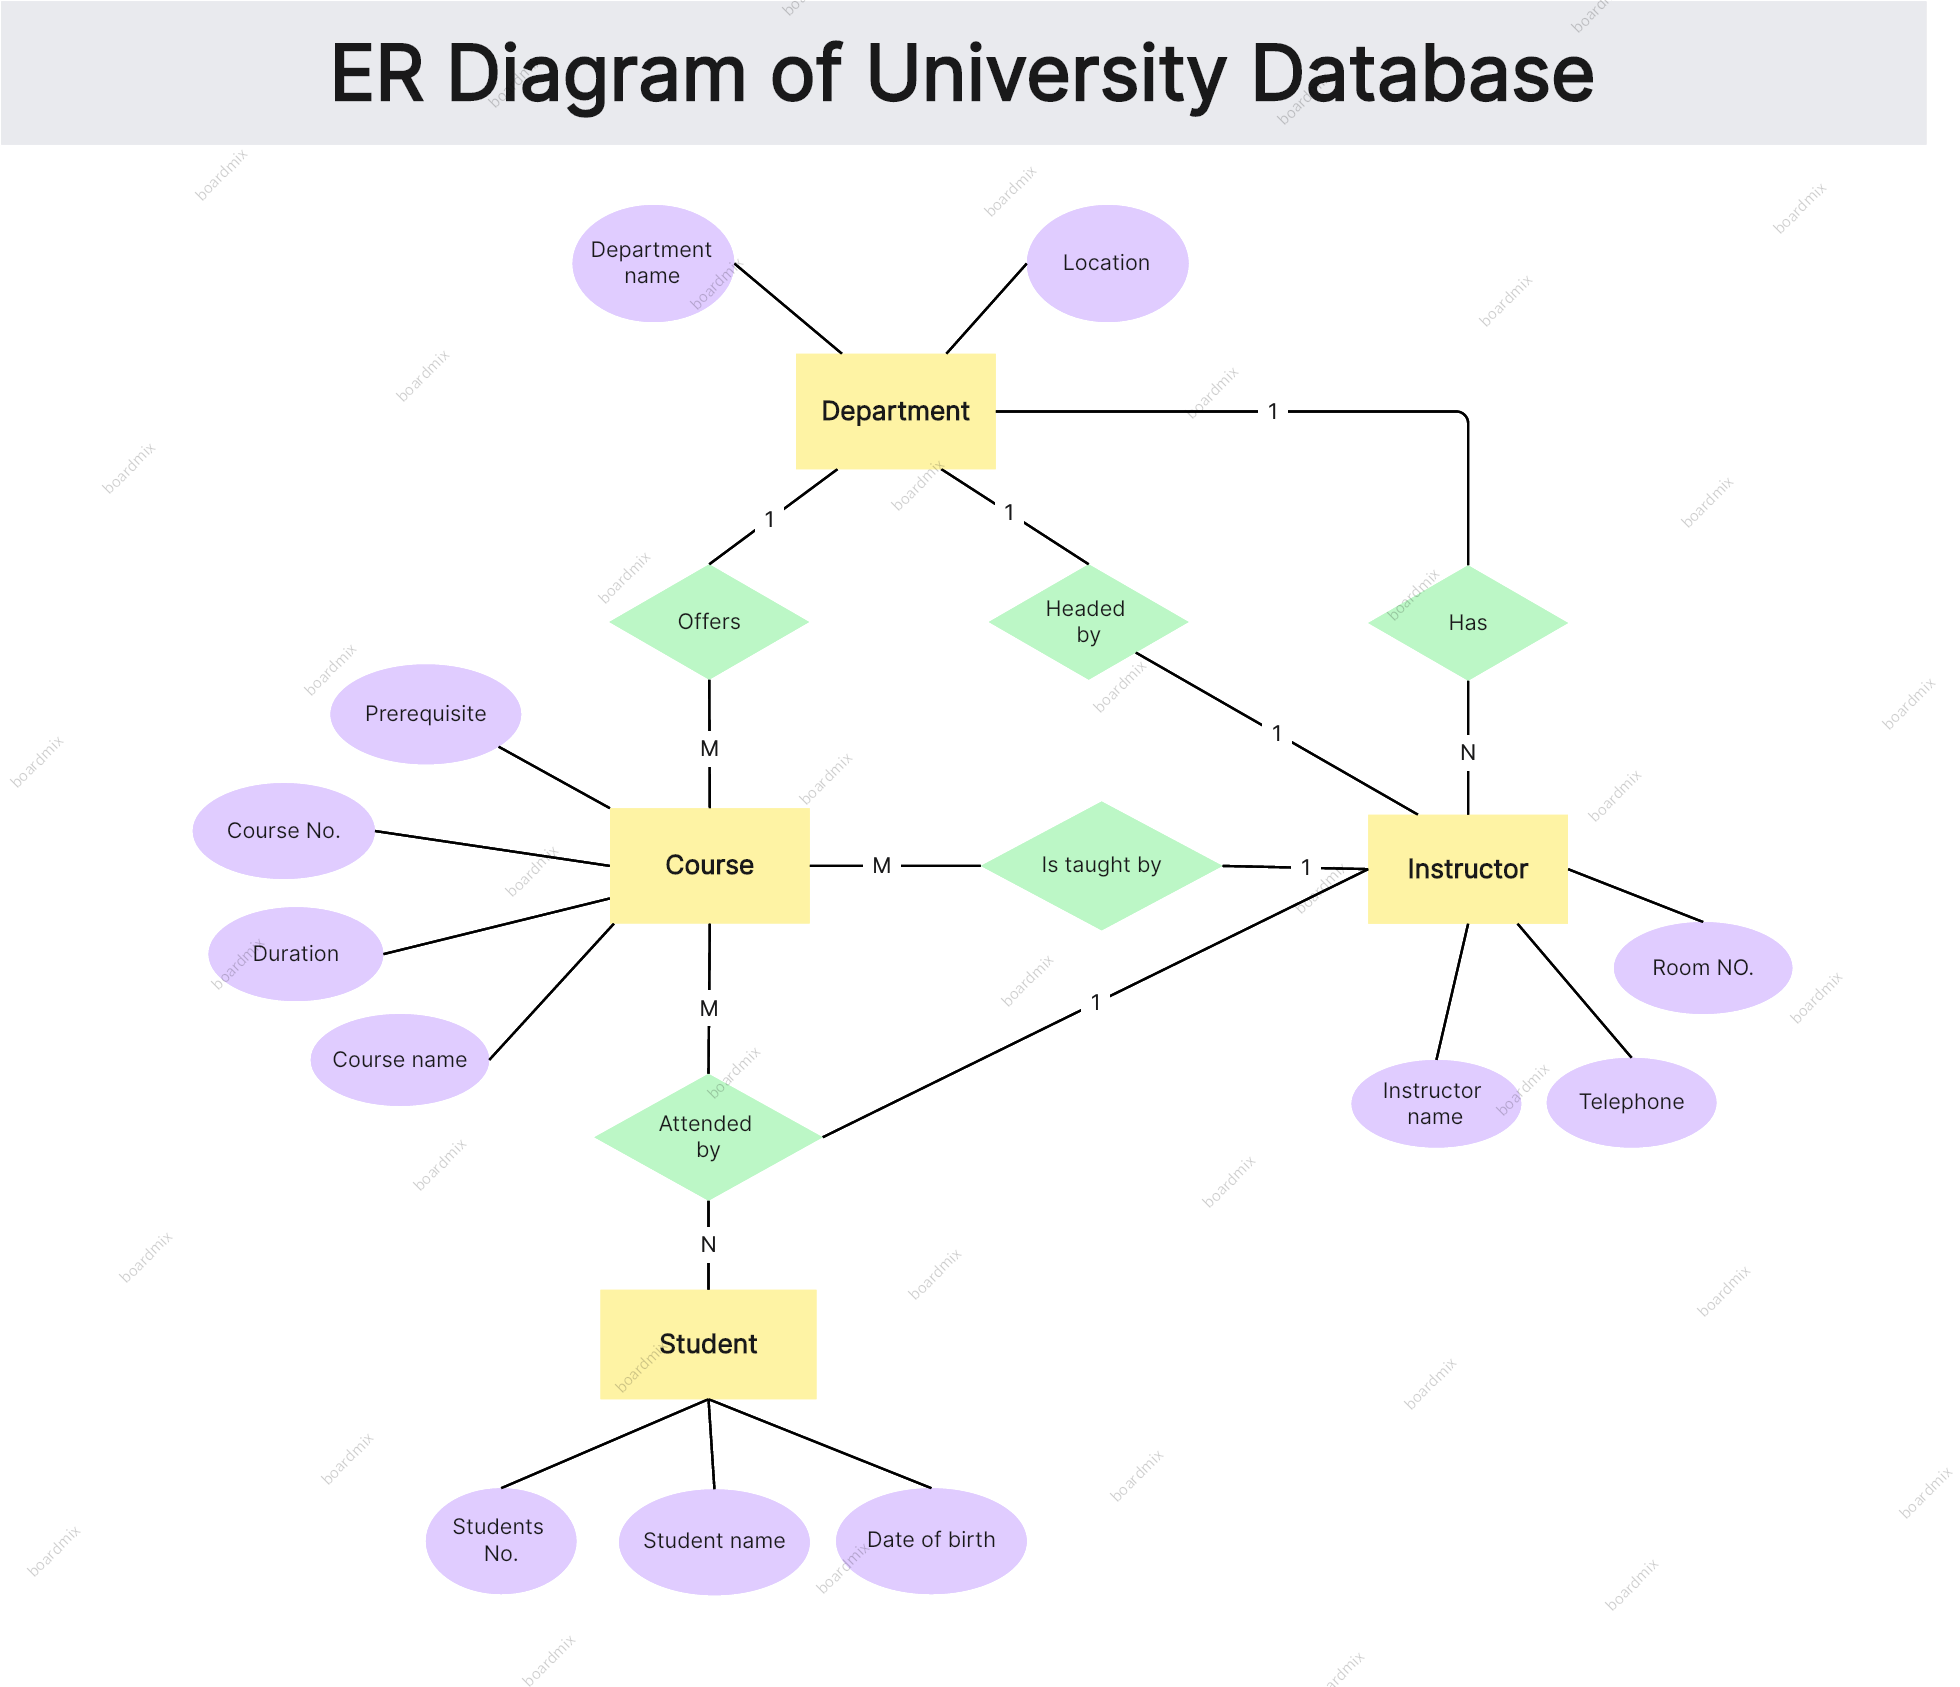
University Database
For a university database, the ER Diagram would include entities such as Student, Course, Professor, and Department. The relationships could be 'Student takes Course', 'Course taught by Professor', 'Professor belongs to Department'. Attributes might include the Student's matriculation number, Course's syllabus, Professor's tenure status, and Department's budget.
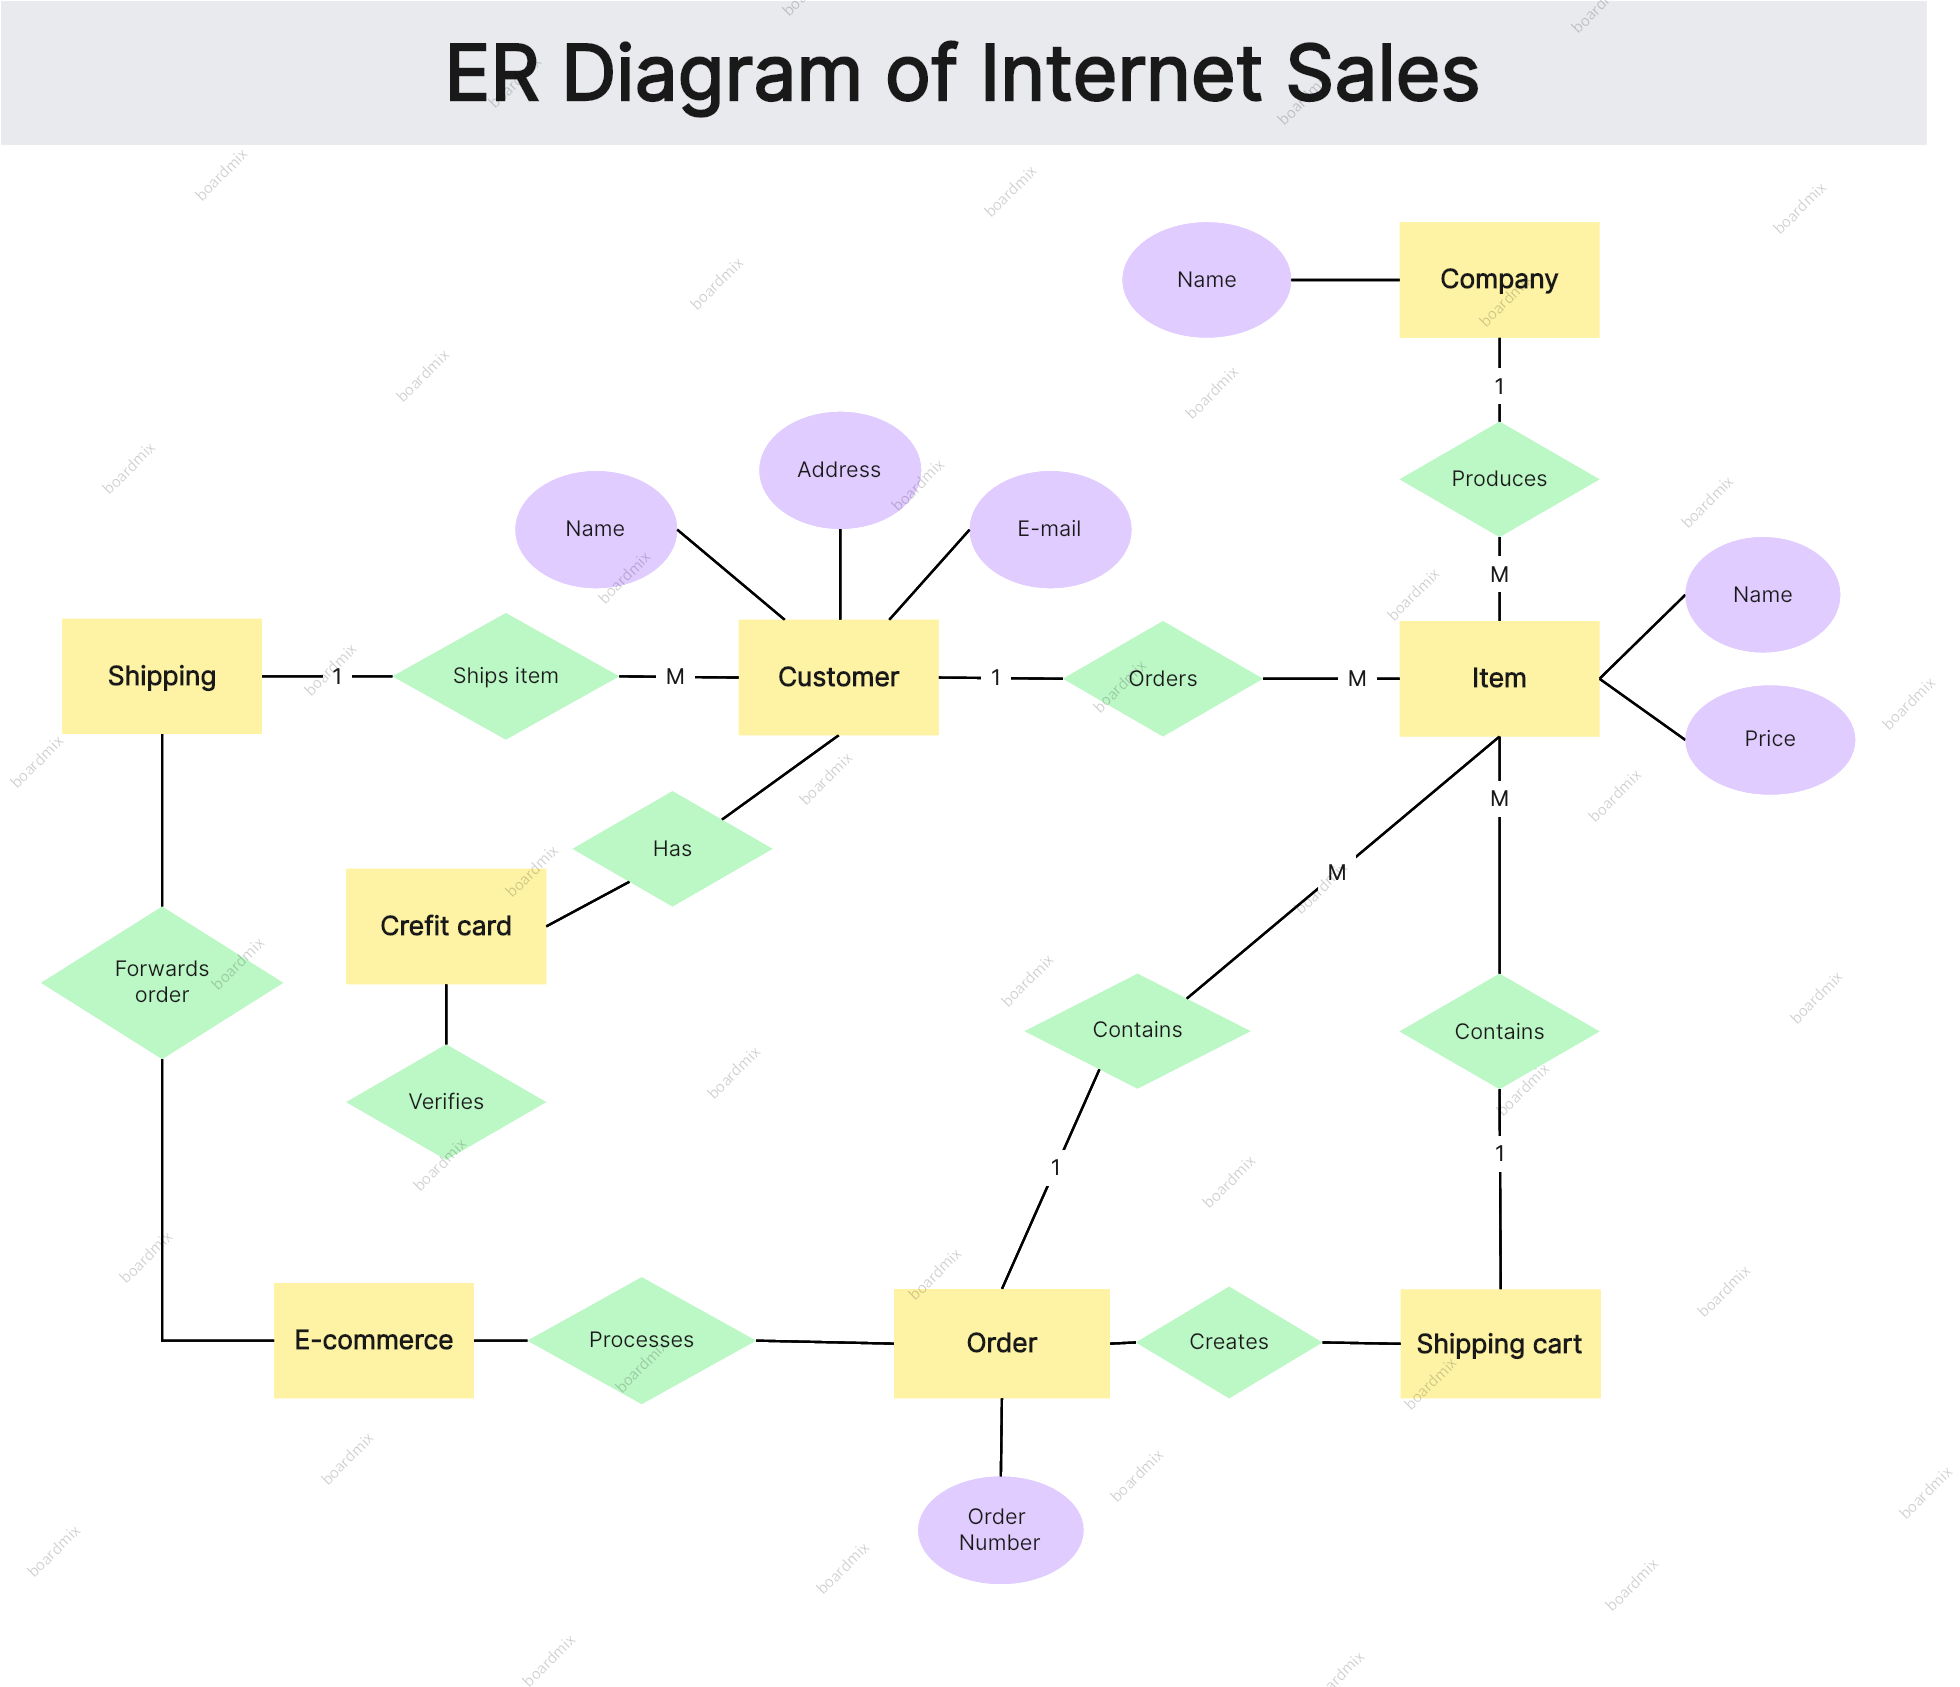
Internet Sales
In an Internet sales ER Diagram, entities would be Customer, Product, Order, and Payment Method. Relationships might include 'Customer purchases Product', 'Order contains Product', 'Payment Method used for Order'. Attributes would detail the Customer's email, Product's price, Order's delivery date, and Payment Method's provider.
How to Create an Entity Relationship Diagram
In the next part of our journey, I'd like to introduce you to a handy tool, Boardmix. This versatile platform comes equipped with various templates, making the creation of ER diagrams a breeze. But not only does it simplify the process, Boardmix also enhances the clarity and presentation of your diagrams, making them easier to understand and share.

So, let's delve into the process of creating an ER Diagram using Boardmix's ready-made template. Here's your step-by-step guide:
- Launch Boardmix: First, log in to your Boardmix account. If you don't have one, you can quickly sign up on the Boardmix website.

- Access the Template Gallery: Once you're logged in, navigate to the template gallery. You can find this by clicking on the 'Templates' option, usually located in the menu bar.
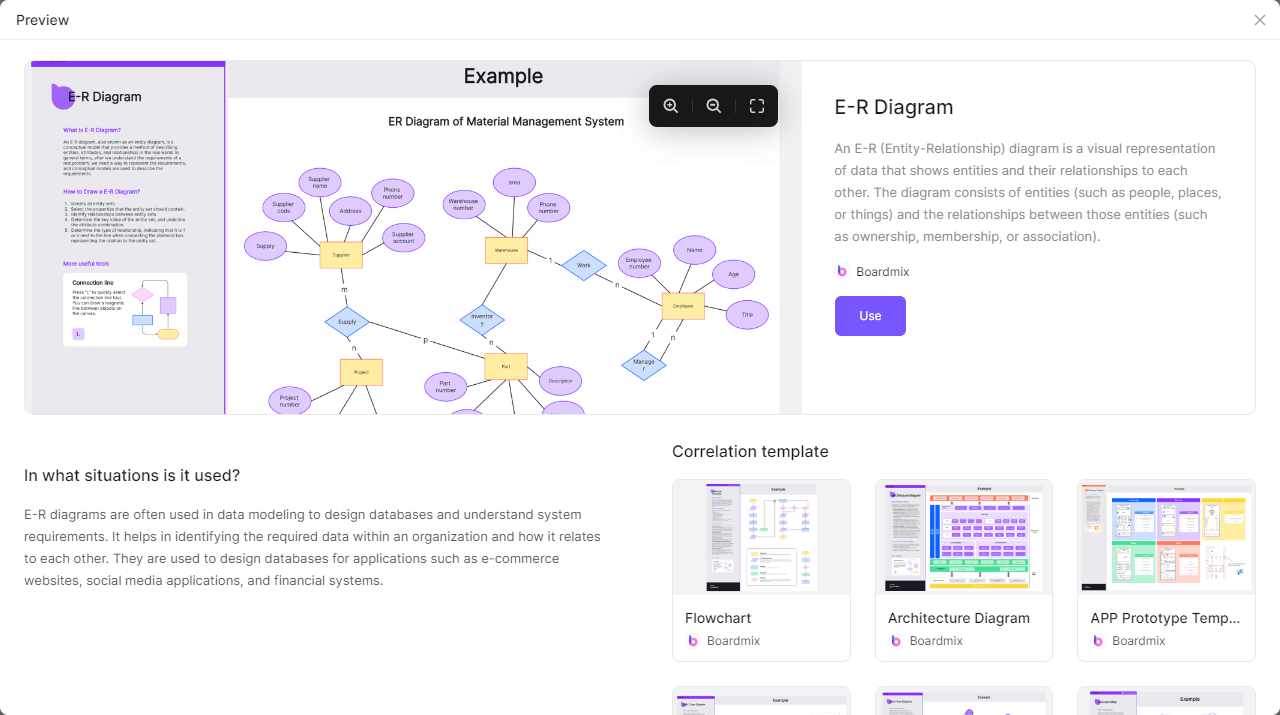
- Select the ER Diagram Template: In the template gallery, you'll find a wide range of pre-built templates for different diagram types. Look for the E-R Diagram template and select it by clicking on the 'Use' button.
- Create Your ER Diagram: With the template, you can start creating your own ER diagram. The template will have placeholders for entities, attributes, and relationships. Simply click on these placeholders to edit them. You can also add more entities, attributes, or relationships by clicking on the respective icons on the toolbar and dragging them to the desired position on the canvas.
- Name Your Entities: Double-click on the rectangle (representing an entity) to type in the name of your entity. Repeat this for all your entities.
- Detail Your Attributes: Similar to the entities, double-click on the oval shapes to add the attribute names. Remember to connect these ovals to their respective entities using lines.
- Define Relationships: Double-click on the diamond shapes to add the names of your relationships. Connect these diamonds to the relevant entities to show how they are related.
- Set Cardinality and Ordinality: You can specify the cardinality and ordinality of your relationships by adjusting the line endings connecting the entities and relationships.
- Finalize Your ER Diagram: Once you're done with your ER diagram, you can give it a final touch by adjusting the layout, color scheme, and font using the options available on the toolbar.
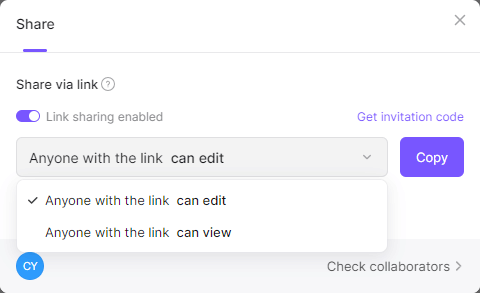
- Save and Share Your ER Diagram: Your ER diagram will be saved to cloud automatically. Boardmix also offers options to share your diagram with others via sharing links or export it in various formats.
Concluding Thoughts
As we conclude this journey through the world of ER Diagrams, we've covered the essentials. From understanding the concept and deciphering symbols to exploring real-world erd examples and creating our diagrams using the Boardmix tool. Remember, this is just the beginning; with each diagram you craft, you'll refine your skills and discover the true potential of this powerful tool.
ER Diagrams serve as bridges, connecting abstract data to tangible insights, guiding us through complex information landscapes. So, let this book be your compass as you embark on the exciting adventure of data organization, knowing that every diagram you create propels you further in this exhilarating voyage of discovery. Happy diagramming!


