

If you are an educator or a student, then chances are that you have already used a T chart in the class. This graphic organizer is an interesting tool that allows you to dissect any topic and gain a deeper understanding of it.
In this article, we will analyze what the T chart is and see some T chart examples. This way, you can find more uses to implement it in your daily life.

What Is T Chart
Common Concept
A T chart is one of the simplest and most basic charts that you can create. However, it is very effective as it gives you a clear visual categorization of your thoughts and ideas. Usually, you will find various T chart example used in education because the format allows students to develop their opinions.
Nevertheless, this type of chart can be used in any situation whenever your need to weigh out your options to find which one is the best for you. For instance, you can create a T chart example when you are unsure whether an investment will be beneficial to you or not. By writing down all the facts you know, you can compare the benefits and drawbacks to reach a conclusion.
What Is the T Chart Teaching Strategy
As we have already mentioned, the most common T chart example comes from education. In fact, a T chart is such a valuable tool that you can find it in every classroom, regardless of grade or educational level.
In more detail, the T chart teaching strategy is rather straightforward. The teacher creates two separate columns and the students need to organize the data at hand depending on the criteria. For instance, they might try to find the pros and cons, the causes and effects, and the before and after among others. In this way, students can organize what they’ve learned in an easily digestible way.
Pros and Cons of T Chart
Every tool has positive and negative aspects that you need to be aware of before using it. The same applies to the T chart. Therefore, before we start analyzing each T chart example, we must mention the organizational tool’s pros and cons.
5 T Chart Examples
In this section, we will show you various T chart examples so that you can get a clearer perspective. After studying these examples, you will be able to create your own T chart for any given topic you wish.
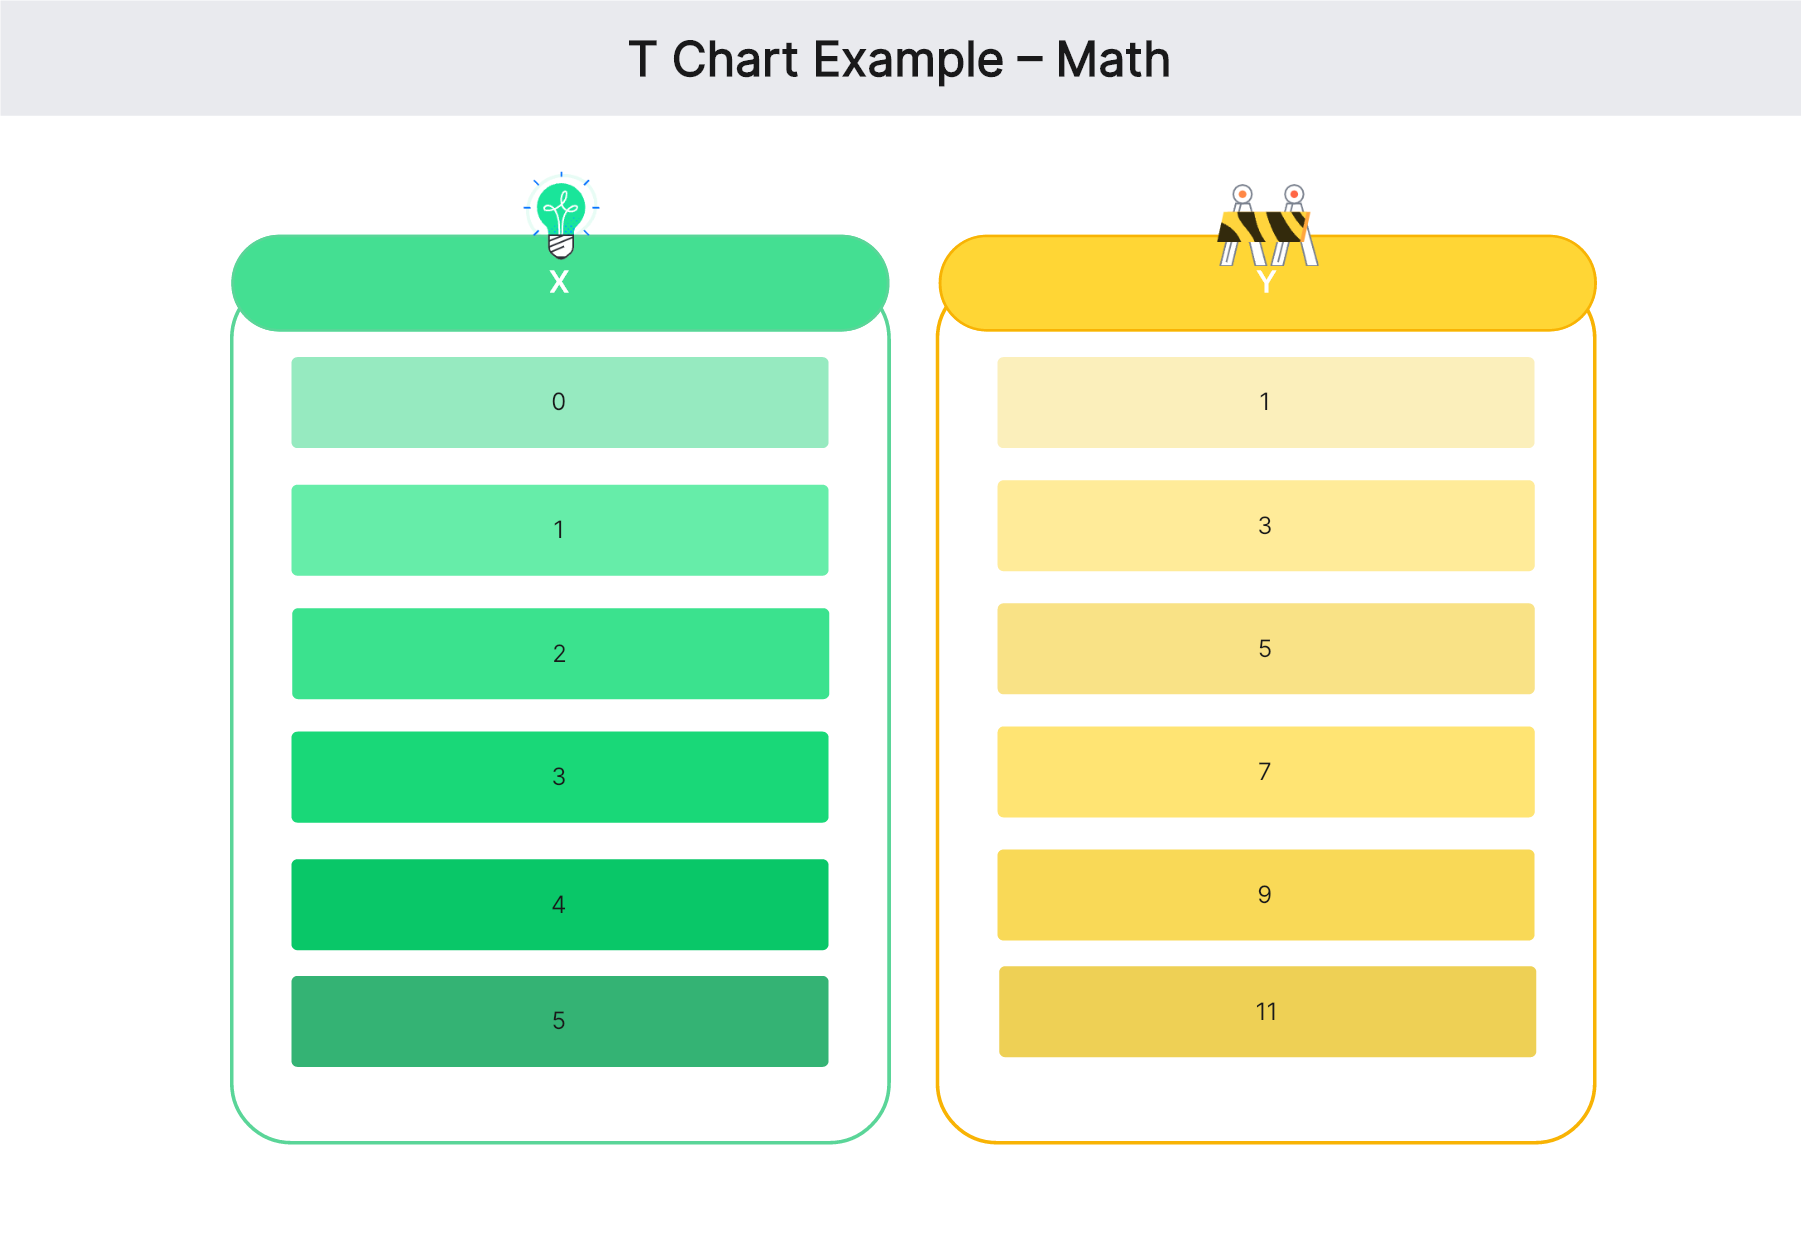
T Chart Example – Math
The first T chart example comes from a math class. This organizational tool is a great one for solving problems and linear equations. To explain this better, let’s take the two variables x and y that are connected in the equation y = 2x + 1. In this case study, we can create a T chart to show the values of y for every value of x.
Therefore, our math T chart becomes like this:
T Chart Example – English
The next T chart example comes from an English class. In this case, the teacher has asked their students to divide the given verbs into two broad categories, such as past tenses and future tenses. This exercise will be useful to the kids because they will understand that the tenses in English are divided into these categories. Furthermore, it also gives the teacher a chance to evaluate the level of their students and identify any possible weaknesses.
Here is our detailed T chart in English:

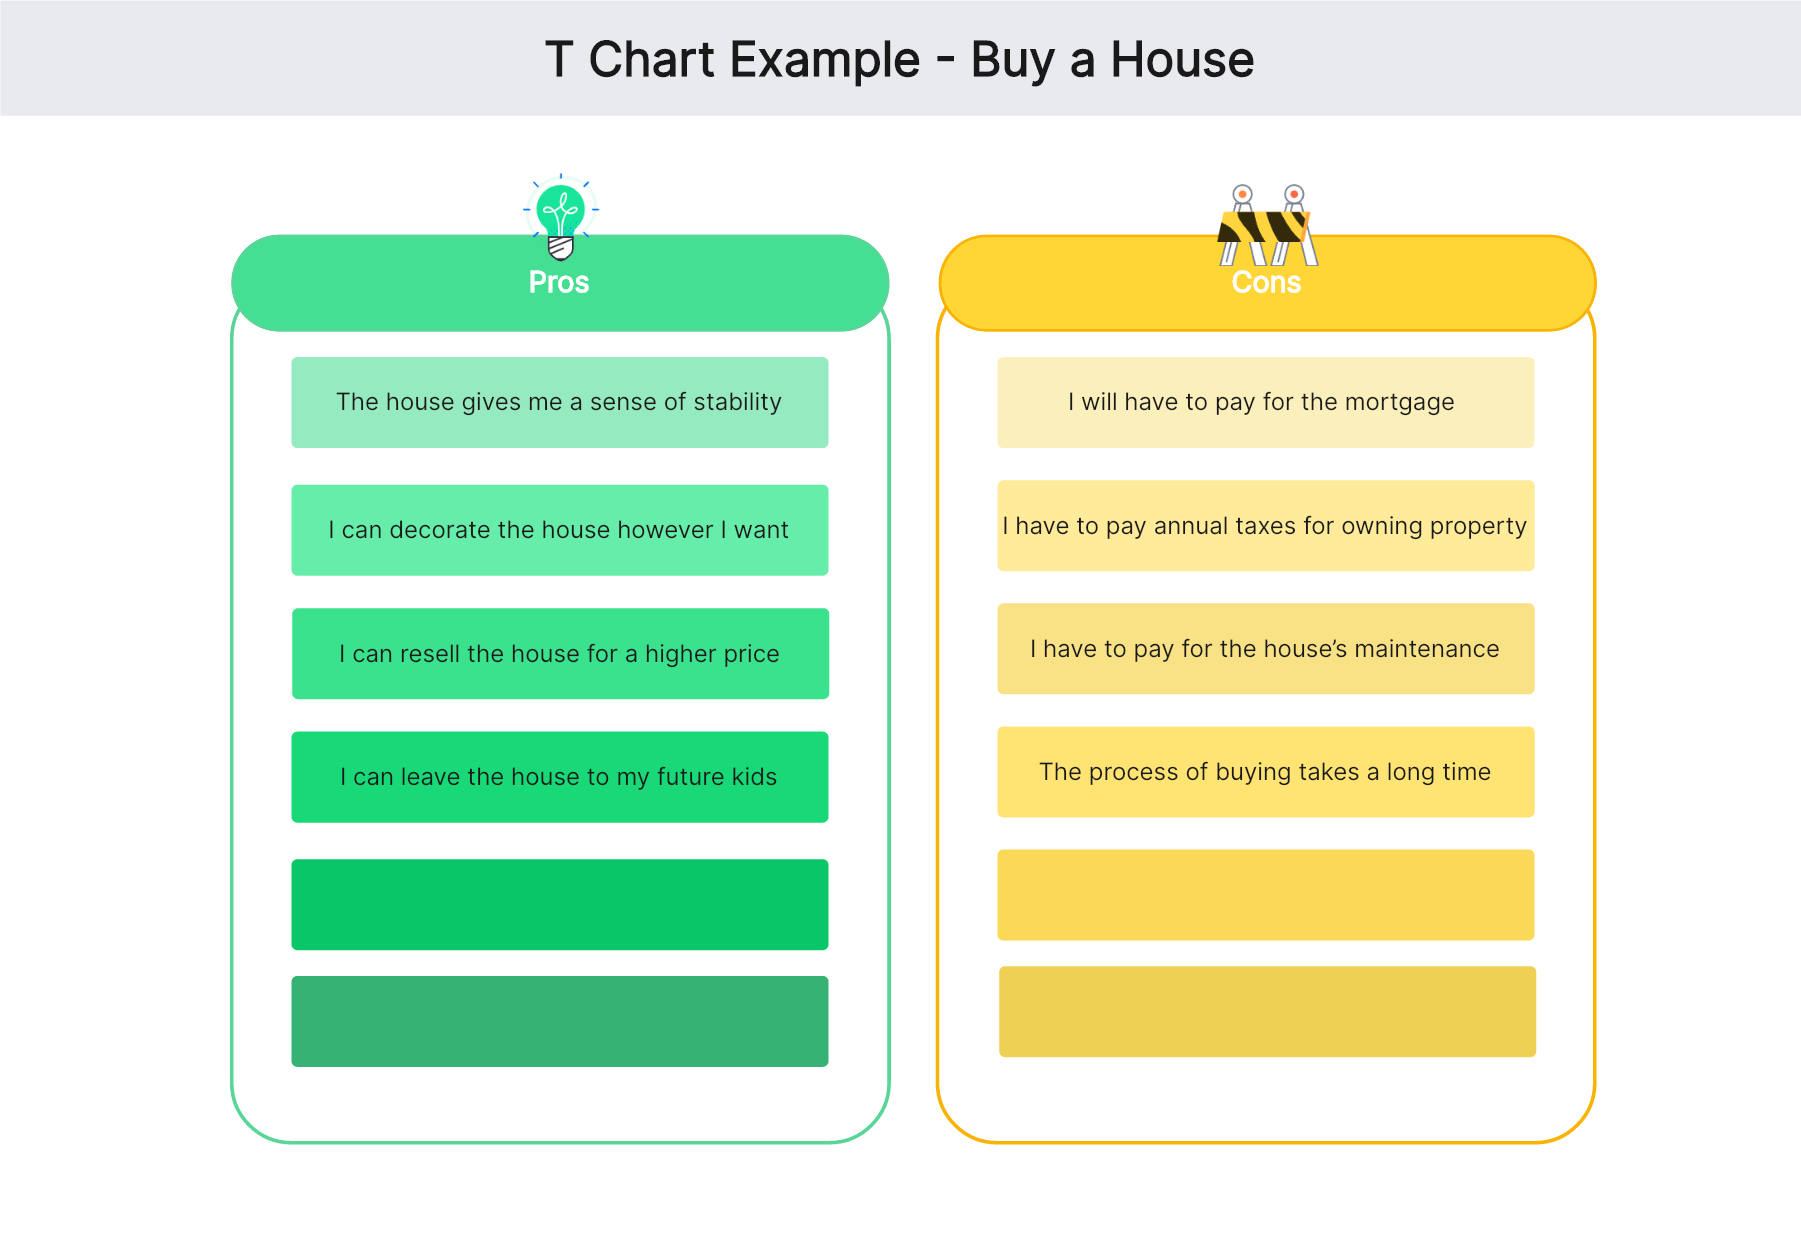
3.3 T Chart Example - Decision Making
In the following T chart example, we will show you how to use this powerful tool for decision-making. In this case study, we will examine the pros and cons of buying a house. This is a very important decision that many people are hesitating. If you feel the same, then a T chart will allow you to evaluate and weigh out the benefits and drawbacks.
Here is what the T chart will look like:
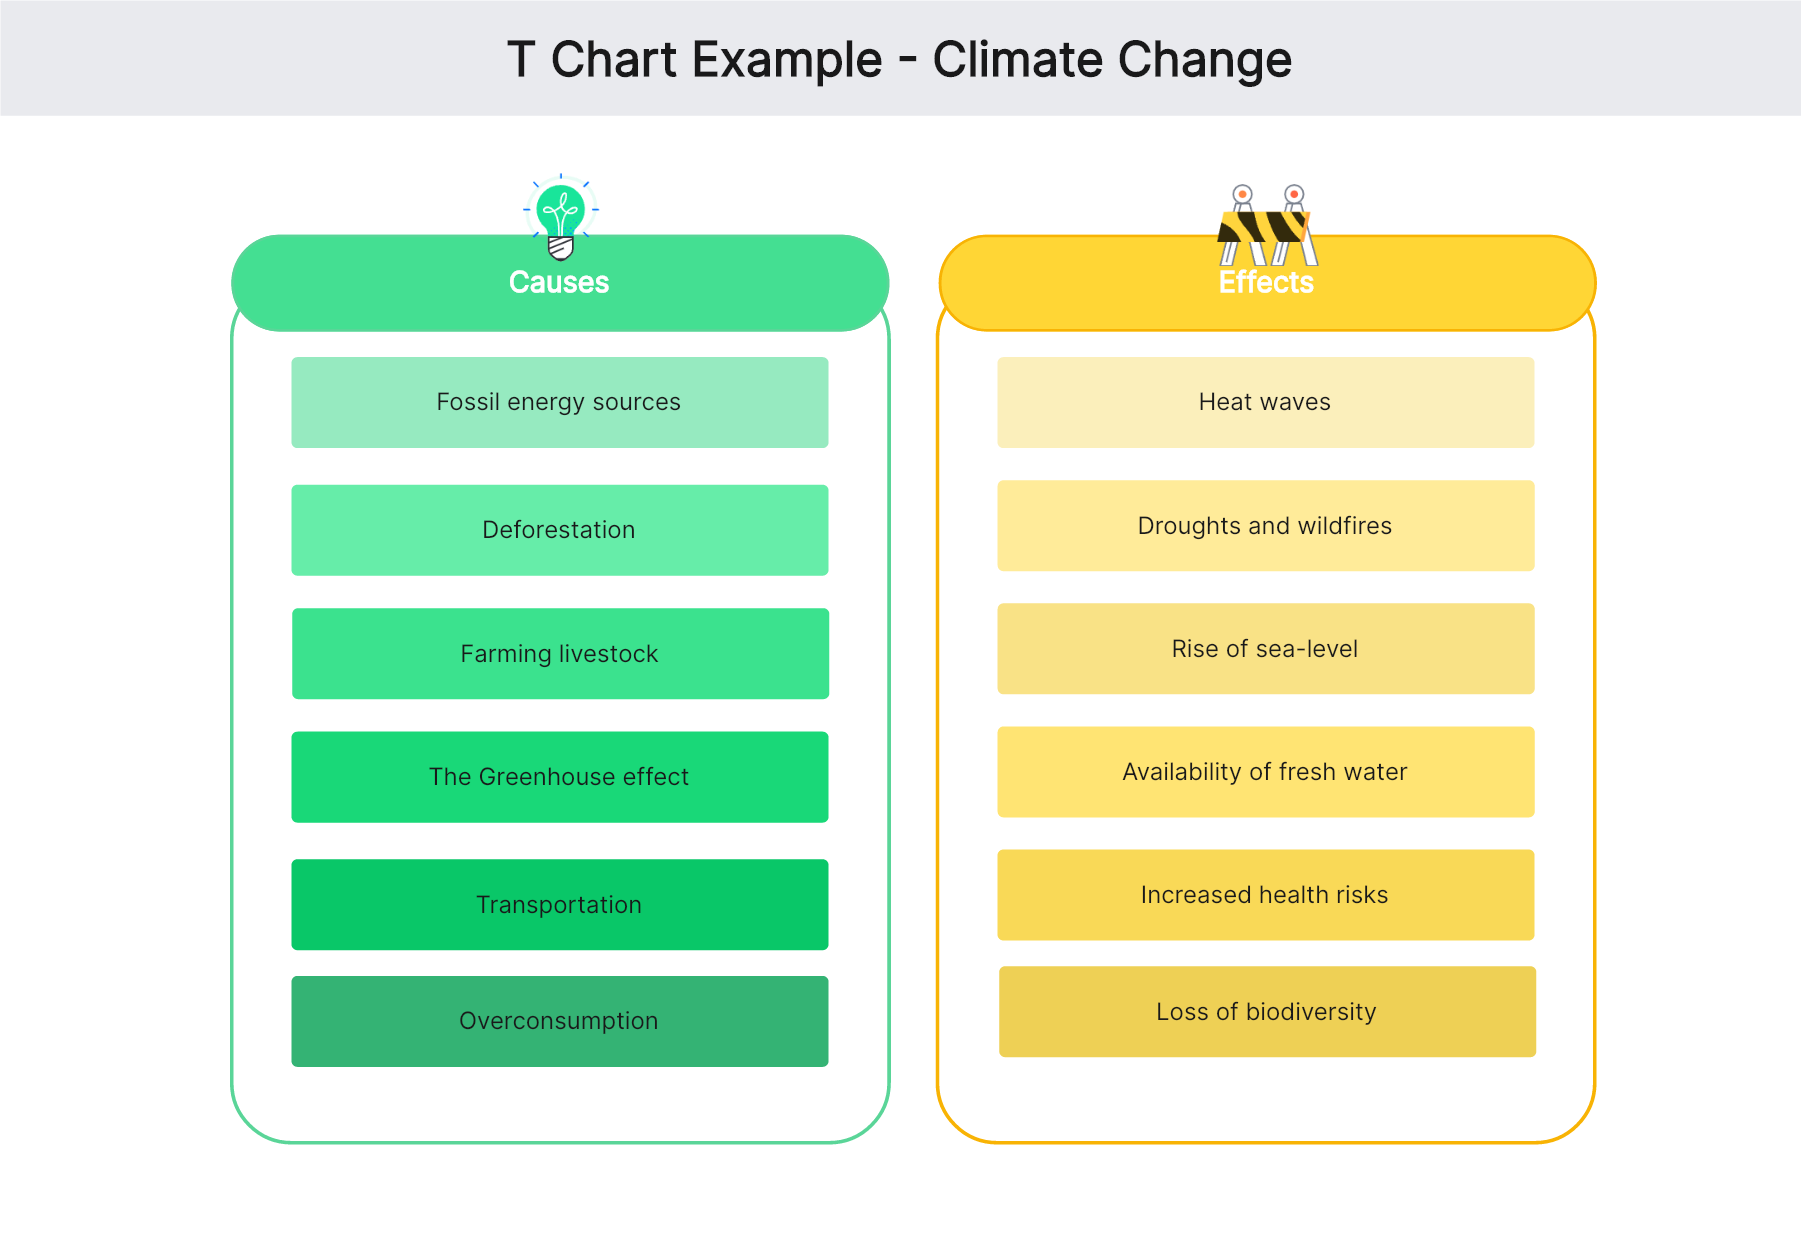
T Chart Example - Climate Change
Another T chart example that shows this tool’s potential shows the causes and effects of a single topic. In our example, we are going to examine the causes and effects of climate change. For instance, a T chart like this will be useful in a presentation by some students or a sustainability-focused company.
In this case, the T chart will be this one:
T Chart Example - Investment
The final T chart example is about investments. For instance, you might be thinking of investing in stocks but you can’t decide if it’s the right thing for you. With this chart, you will see in a simple list all the pros and cons of this decision so that you make up your mind.
Here is what this T chart will look like:

How to Create a T Chart
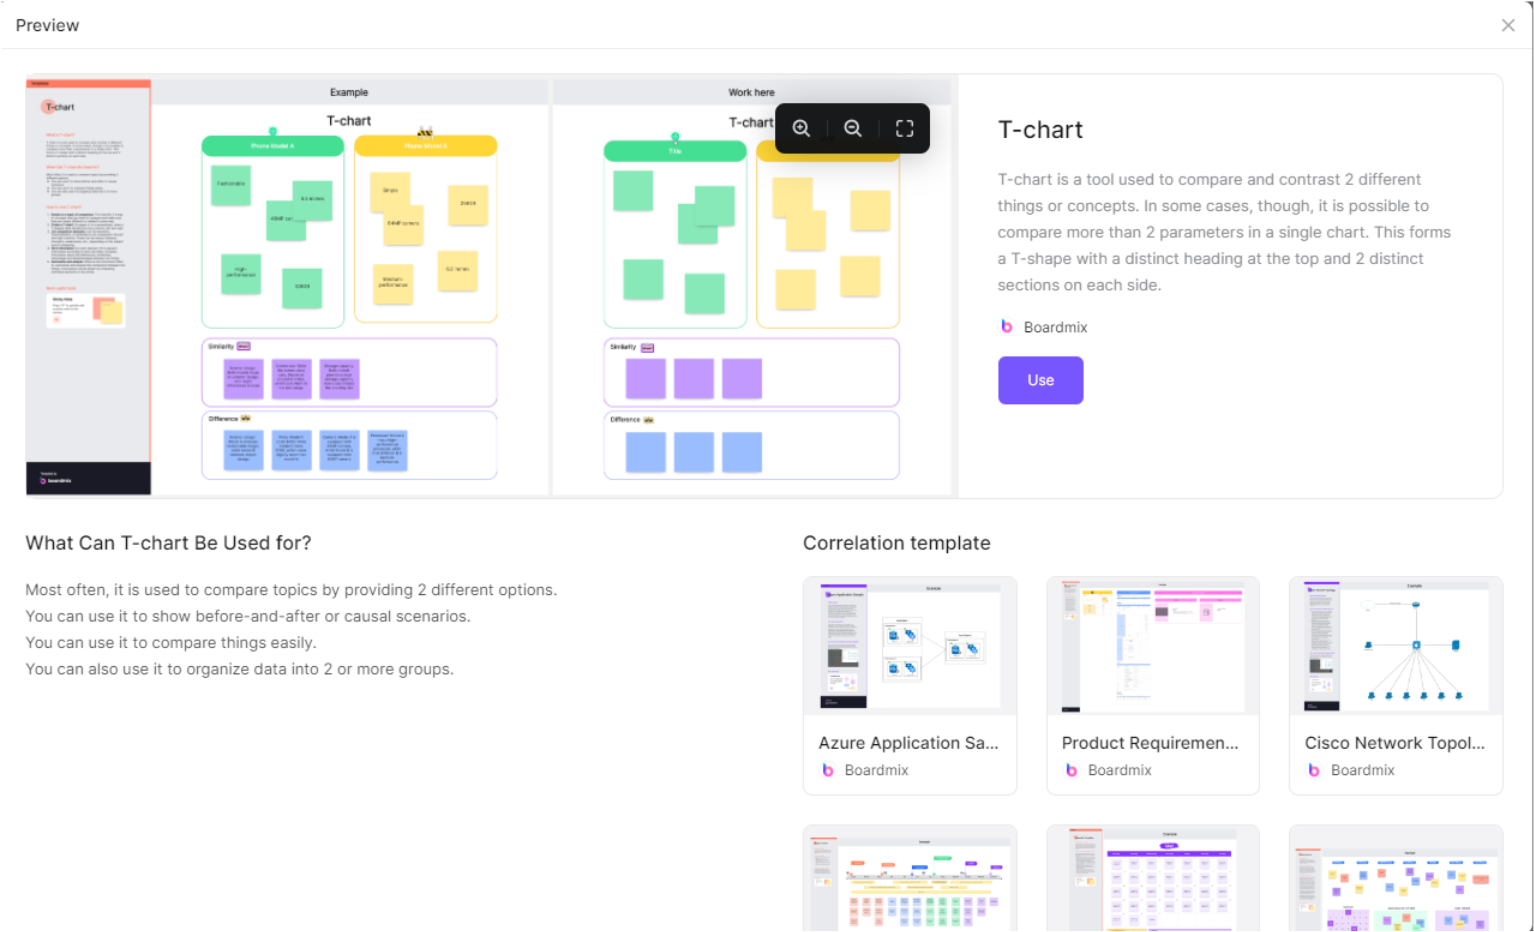
As you can see, the T chart is really versatile. For this reason, you will benefit from learning how to create one with ease. The best tool to create your T chart in no time is Boardmix. This is an online tool that has been designed to make diagramming as simple as possible. In Boardmix, you will find a rich template library, readymade shapes, and even an AI assistant to help you research whatever you need.
Here is how to create a T chart using Boardmix:
Create your Boardmix account. From your workspace, click the Create new whiteboard button to begin. Or you can also choose the ready-made template provided by Boardmix official.
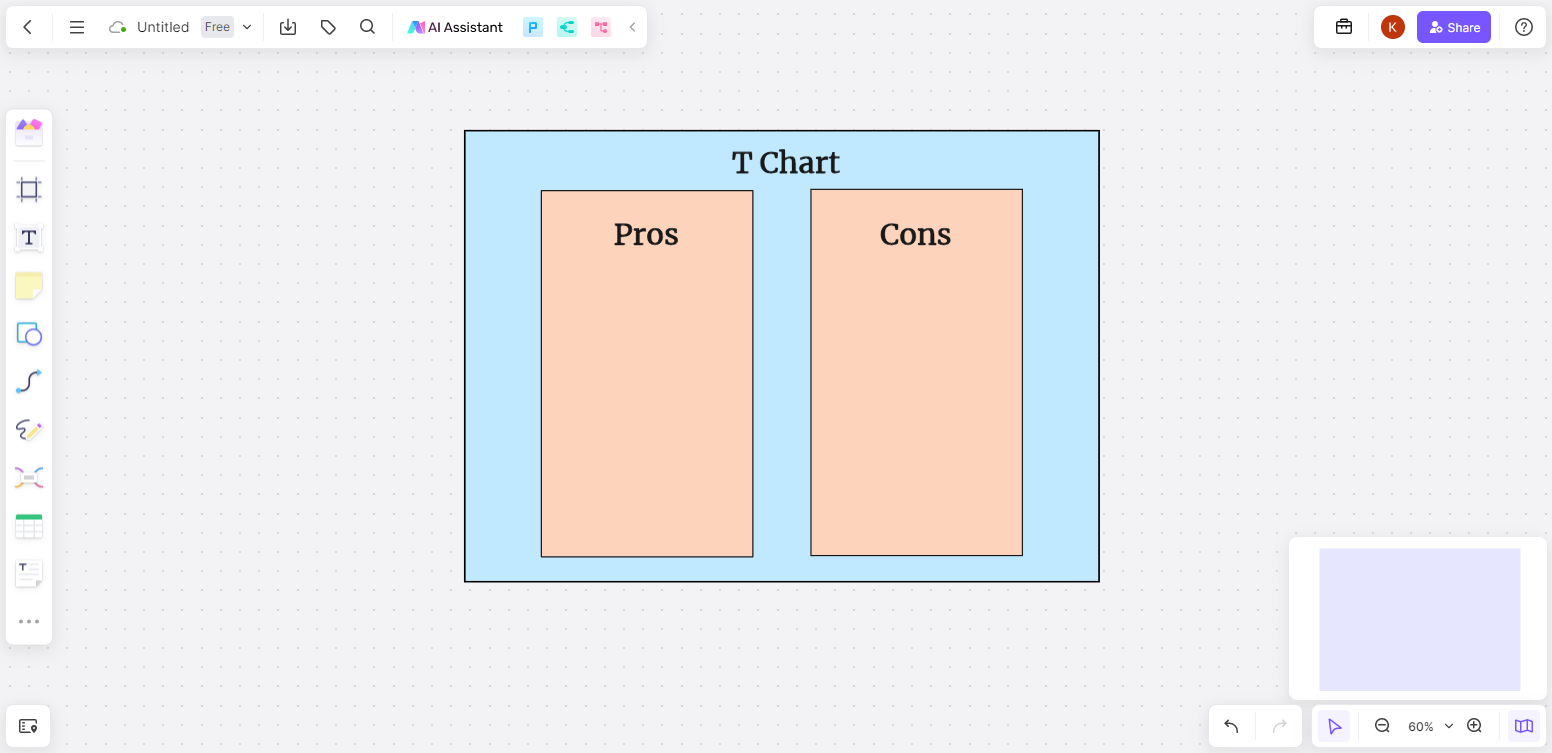
Create the columns for your T Chart and label them accordingly.
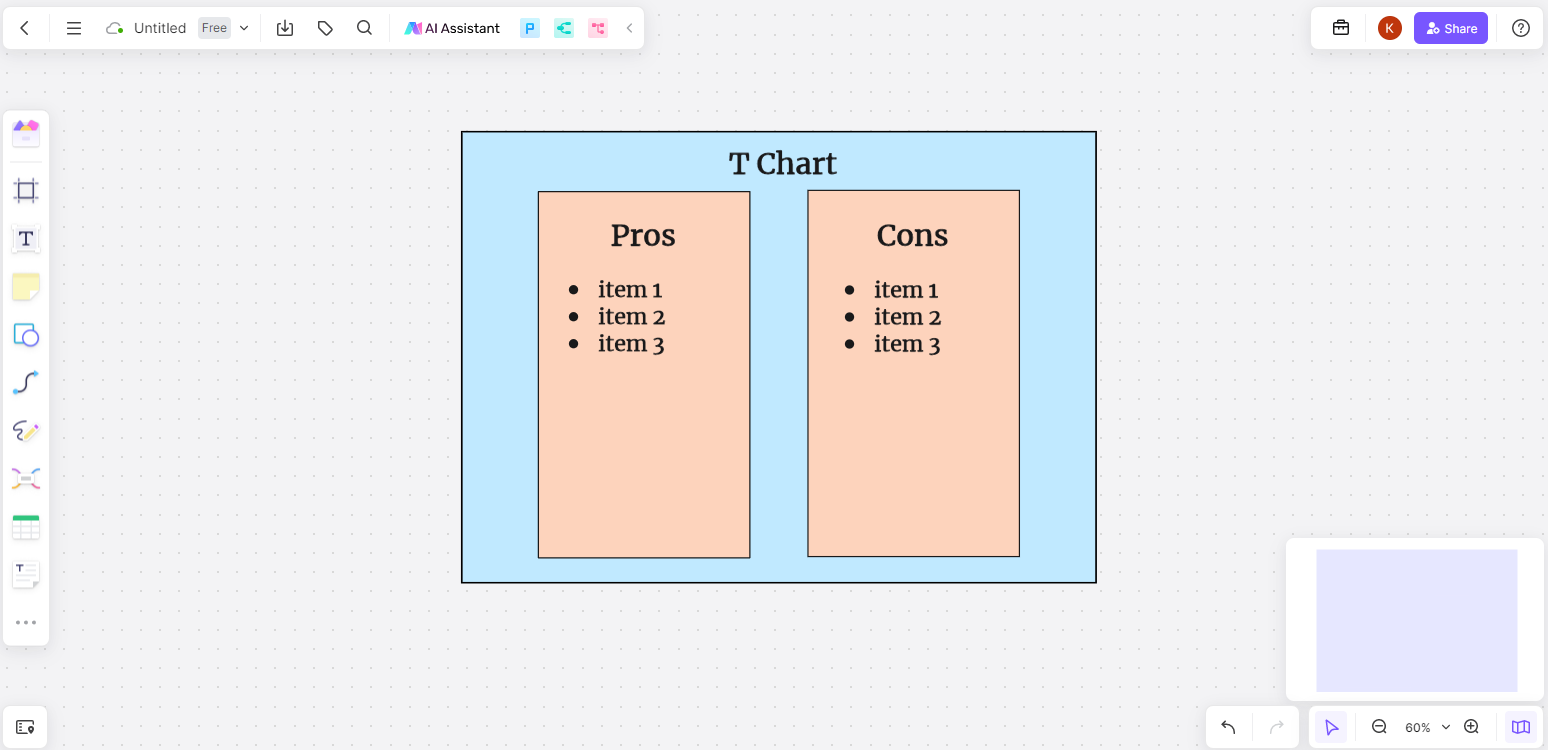
Write the items on their list. Your T chart is ready. If you want, you can also share it with other users by the sharing link.
The Bottom Line
The T chart is a valuable tool for both educational and personal purposes. Learn how to create one on Boardmix to start using it whenever you need to take an important decision. Create your account for this online tool to gain access to a huge number of premade templates and other advanced features.


