

What Is the GE Matrix
GE Matrix is a strategic business tool that plots an organization’s business units or products on a two-dimensional grid based on industry attractiveness and competitive strength. It is primarily used to determine resource allocation for business portfolios. It helps business corporations prioritize investment in products or strategic business units (SBU). The ultimate goal behind adopting the GE matrix is to attract patronage to a particular product that was designed through research.
Before business resources are allocated, the essence of any business product or investment has to be analyzed critically on how profitable it would be. This profitability is determined by essential components of GE matrix which are detailed below.
Components of the GE Matrix
First of all, components of GE matrix are detailed along the X and Y axis. Let’s look at the axis thus;
Y-axis
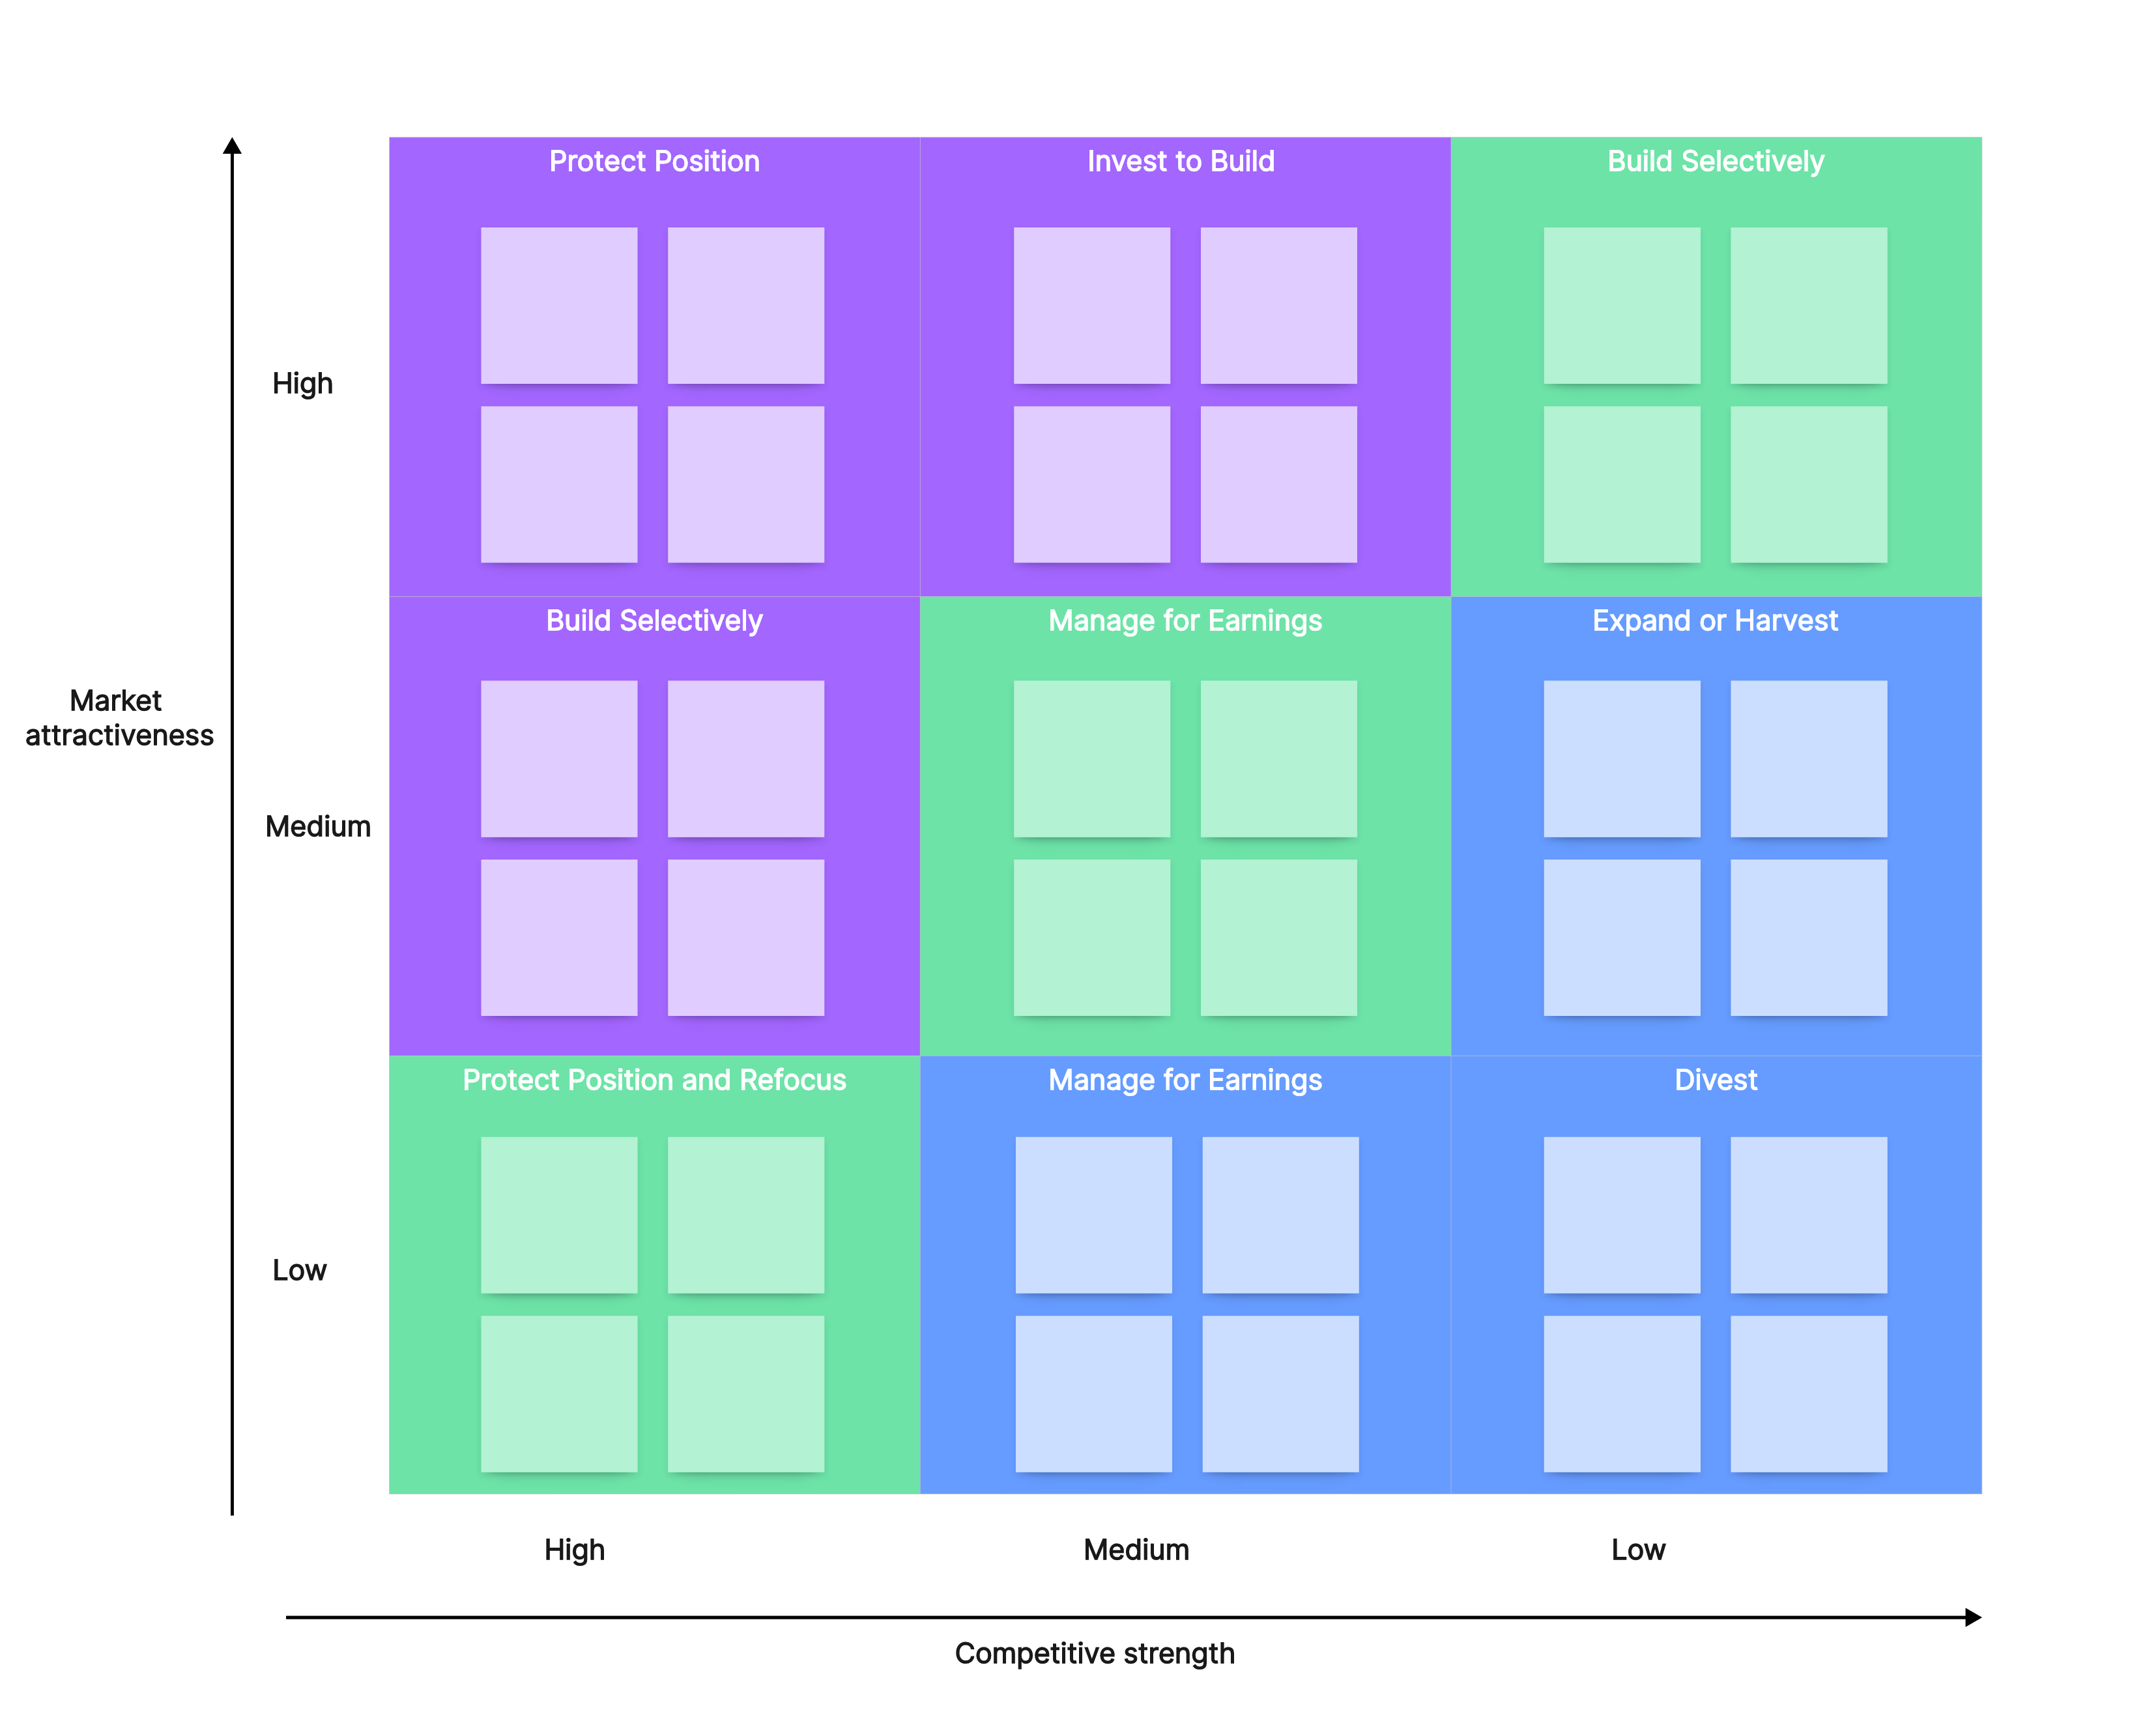
Just like a mathematical graph, the Y-axis of the GE Matrix known as the vertical axis scores the industry attractiveness which is grouped into Low, Medium, and High.
Industry attractiveness demonstrates the level of profit possibility a company could have when they compete with other companies in the same industry. The higher the profit possibility, the more attractive is the industry. On the other hand, if the industry attractiveness is low, it implies the level of profit possibility is low.
Note that there are factors that could influence industry attractiveness such as industry size (which considers the power of buyers and suppliers), environmental factors, cost of labor, etc. These factors should be considered with the future and long term in mind.
X-axis
The X-axis of the GE matrix demonstrates the competitive strength of a business unit which is divided into Low, Medium, and High. It measures how strong a company is against its competitors - an indicator of the company’s ability to compete within an industry. This ability is known as unique selling points (USPs), commonly called sustainable competitive advantages. Essentially, certain factors such as brand equity, level of differentiation, market share, profitability, and customer loyalty can influence a company’s USP even in the long run.
Inside Components of the GE Matrix
Here, the GE matrix consists of 9 blocks interpreted as different scenarios and corresponding strategic actions a company will take on. These scenarios and their corresponding actions are briefly discussed below;
- Invest/Grow strategy
If a company or strategic business unit reaches this scenario, it is most likely operating in a moderate to highly attractive industry while occupying a moderate to highly competitive position within the same industry. At this stage, the company would have to allocate resources such as capital and assets to grow, as this is the time the company has massive growth potential.
- Selectivity/Earnings Strategy
A company or Strategic business unit in this situation probably occupies a high competitive position in an unattractive industry, or it is occupying a low to a moderate competitive position in an attractive industry. At this juncture, allocating resources for investment ought to be done conservatively, because companies in this block may not be performing optimally in that industry.
- Harvest/Divest strategy
A company or a strategic business unit at this point should not be invested in or should not allocate resources for investment. In this block, it has almost zero growth potential. Divest strategy is the best option left, implying the company has to synergize or be sold to an interested buyer having a better competitive advantage. However, a harvest strategy might be considered if the company has enough profit from previous investments to keep itself running.
Pros and Cons of the GE Mckinsey Matrix
Needful to note that the GE matrix is called the GE Mckinsey Matrix, because it was created by Mckinsey Consultancy Group in the 1970s. Since then so many companies have adopted it as a better strategic framework to grow their business units. Nevertheless, GE Mckinsey Matrix has cons that invalidate it as an all-suitable strategy framework for any type of business unit or company- below are the pros and cons:
Pros:
- GE Mckinsey matrix analyzes the key areas of the business portfolio that need to be improved by the company’s decision.
- It enables business managers to effectively monitor the market performance of their products.
- It is a consistent strategic framework and welcome all kinds of changes happened during the process.
- Mckinsey matrix helps portfolio managers to identify which business unit is making a profit and which is not.
Cons:
- GE Mickinsey martix may not be a suitable strategy framework for emerging industries.
- The expertise of an experienced business analyst is needed to analyze the company's strengths and attractiveness.
- It is expensive to manage.
How to Apply the GE Mckinsey Matrix
Application of Mckinsey matrix requires a good platform. This helps to virtually set up the matrix, and provide an integral environment where every member of the team can keep tabs on the use of Mckinsey matrix to analyse investment prospects. In this case, Boardmix is a recommended platform.
Before diving into how to use Boardmix to get this done, let’s highlight the principal methodology used to apply GE Mckinsey matrix.
Methodology
- Find out the industry attractiveness of each SBU or product: Factors such as level of competition, differentiation, market size, industry profitability, and market growth rate are determinants that define the industry attractiveness of any product or SBU. After careful examination of how these factors impact, rate each SBU or product on each factor on a scale of 1-9.
- Find out the competitive strength of each SBU or product: Factors such as brand equity, market share, production capacity, pricing, and profit difference compared to competitors have different levels of the essence in determining the strength of SBU (product).
- Plot the findings on the GE matrix:Integral values translated from the findings are plotted graphically on the McKinsey matrix. The position of the SBU or the product in the graph could tell if a company should invest in that SBU or not.
Setting up the GE Mckinsey Matrix with Boardmix
The Boardmix GE matrix template is highly flexible and user-friendly. You can use it by following steps below:
- Go to the Boardmix website, sign in, or sign up.

- On the homepage, click Templates, scroll down, and select GE Mckinsey Matrix. The matrix contains 9 adjustable blocks on the Y and X axes.
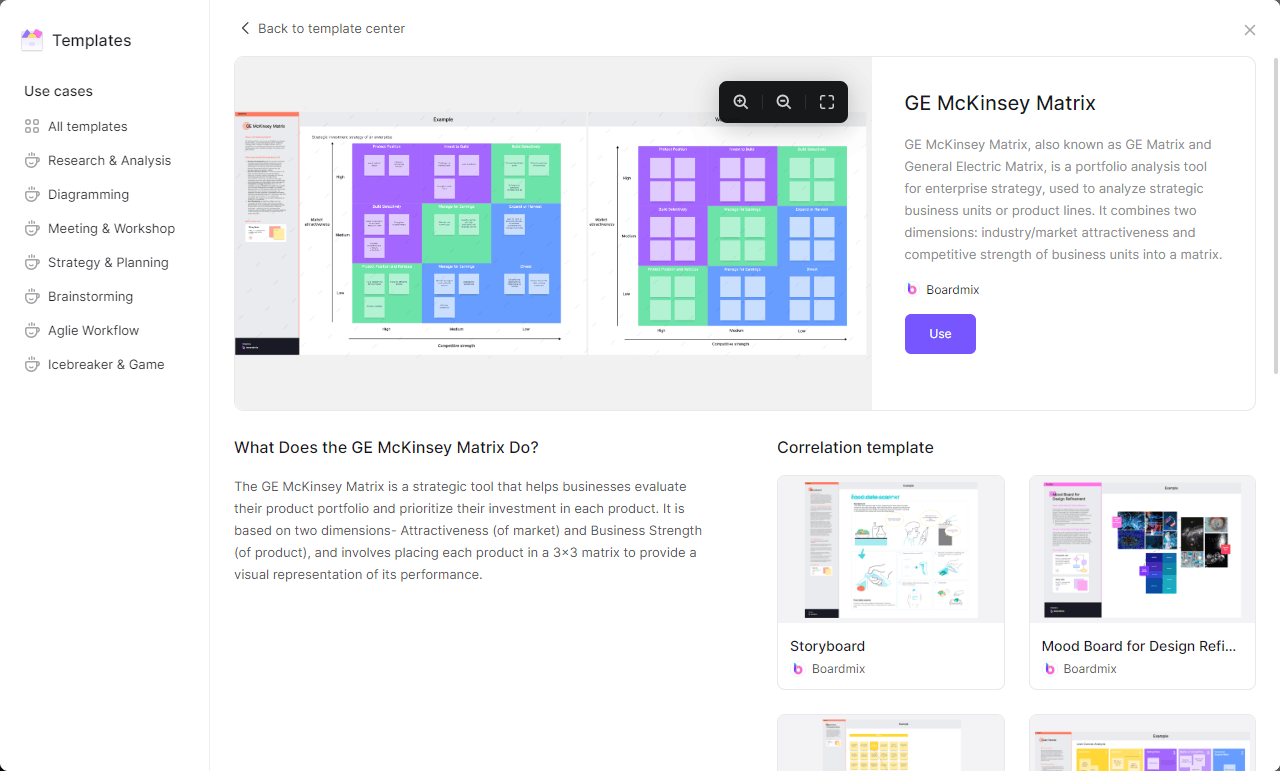
- Each block has 4 small and adjustable boxes for posting analysis drawn for the Mckinsey matrix graph.
- The left-sided laid-out tools are designed to customize the Matrix on your terms.
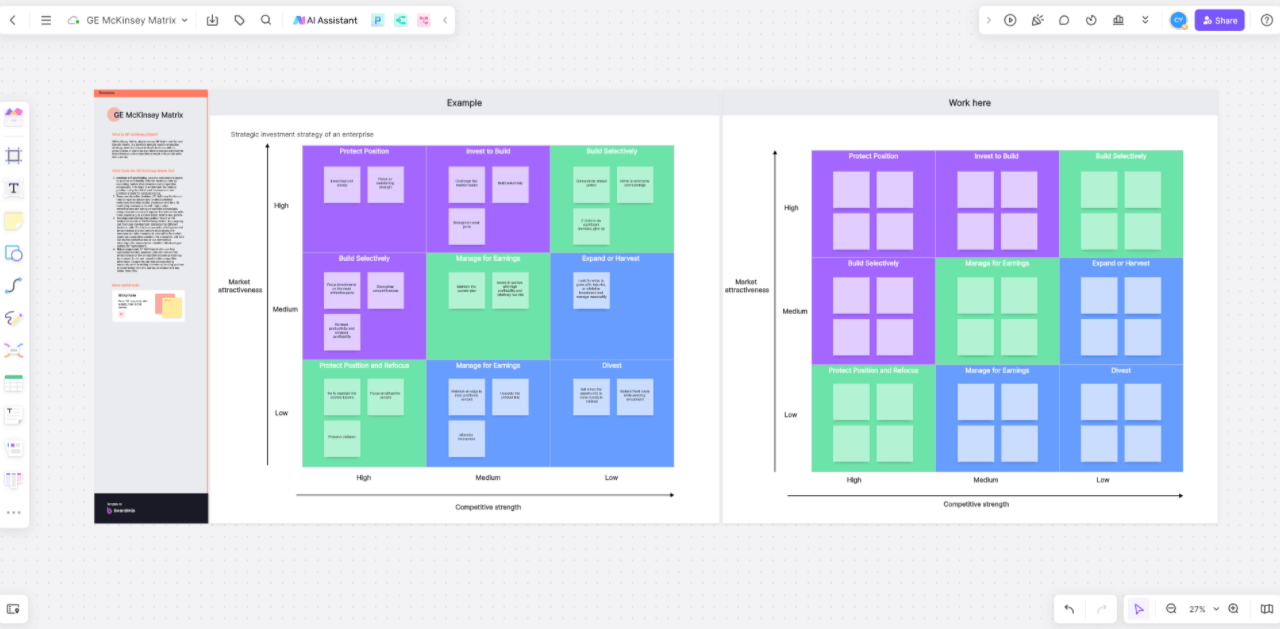
- The AI Assistant helps to make the whole process more seamless and all-rounded.
FAQ: What is the difference between BCG and GE matrix?
- BCG matrix has two dimensions based on market share and market growth. While GE matrix has two dimensions based on business strength and industry attractiveness.
- BCG matrix is used primarily to allocate resources among different products or business units, whereas GE Matrix is used to prioritize investment among different products and business units.
- BCG matrixconsists of 4 blocks while GE Matrix has 9 blocks.


