


In our increasingly complex world, understanding systems and processes is vital. Whether it's a business operation, a technical procedure, or a scientific phenomenon, clear and concise representation of how things work can make all the difference. One such tool that can be used to visualize and understand systems better is the system flowchart. In this article, we will delve into what a system flowchart is, when it's best to use one, the various benefits it offers, its symbols, examples and steps to create one. Keep reading.
What Is a System Flowchart
A system flowchart is a diagrammatic representation that depicts the workflow or processes involved in a system. It uses a variety of symbols, shapes, and arrows, each representing different types of tasks or steps in a process. The sequence of operations is illustrated by arrows connecting these symbols.
Click Here to Create Flowcharts
System flowcharts can cover a range of scenarios – from manufacturing processes in industries to software operations in information technology, business procedures in organizations, and even biological or chemical processes in science.
These charts provide a visual layout of 'what happens when' in a system, giving viewers a comprehensive understanding of how different elements within the system interact with each other to achieve the final output.
When to Use a System Flow Diagram
System flow diagrams can be employed anytime you need to understand, explain, improve, or communicate a process. Some specific situations where they are particularly useful include:
- Planning New Processes: When setting up new operations or systems, a flowchart can help visualize the planned processes and identify potential bottlenecks or inefficiencies.
- Troubleshooting: System flowcharts can aid in identifying issues in an existing process by illustrating each step clearly, making it easier to spot where things may be going wrong.
- Training Purposes: For those unfamiliar with a process, system flowcharts serve as an effective visual guide detailing each step in the operation.
- Documentation: Flowcharts provide clear and concise documentation of processes for reference and quality control purposes.
Benefits of System Flowcharts
System flowcharts bring with them numerous benefits:
- Enhanced Understanding: By breaking down complex processes into individual steps and visually representing them, system flowcharts promote better comprehension.
- Improved Communication: Flowcharts provide a universal language of diagrams and symbols that enhances communication among team members and across different departments.
- Efficient Troubleshooting: As system flowcharts map out each step in a process, they make it easier to identify where problems may be occurring.
- Effective Training Tool: For people new to a process, system flowcharts offer an easy-to-follow guide, enhancing learning and recall.
- Streamlined Process: System flowcharts help identify redundancies and inefficiencies in a process, facilitating improvements for greater efficiency.
System flowcharts, therefore, serve as a powerful tool in visualizing, communicating, understanding, refining, and troubleshooting processes across various fields.
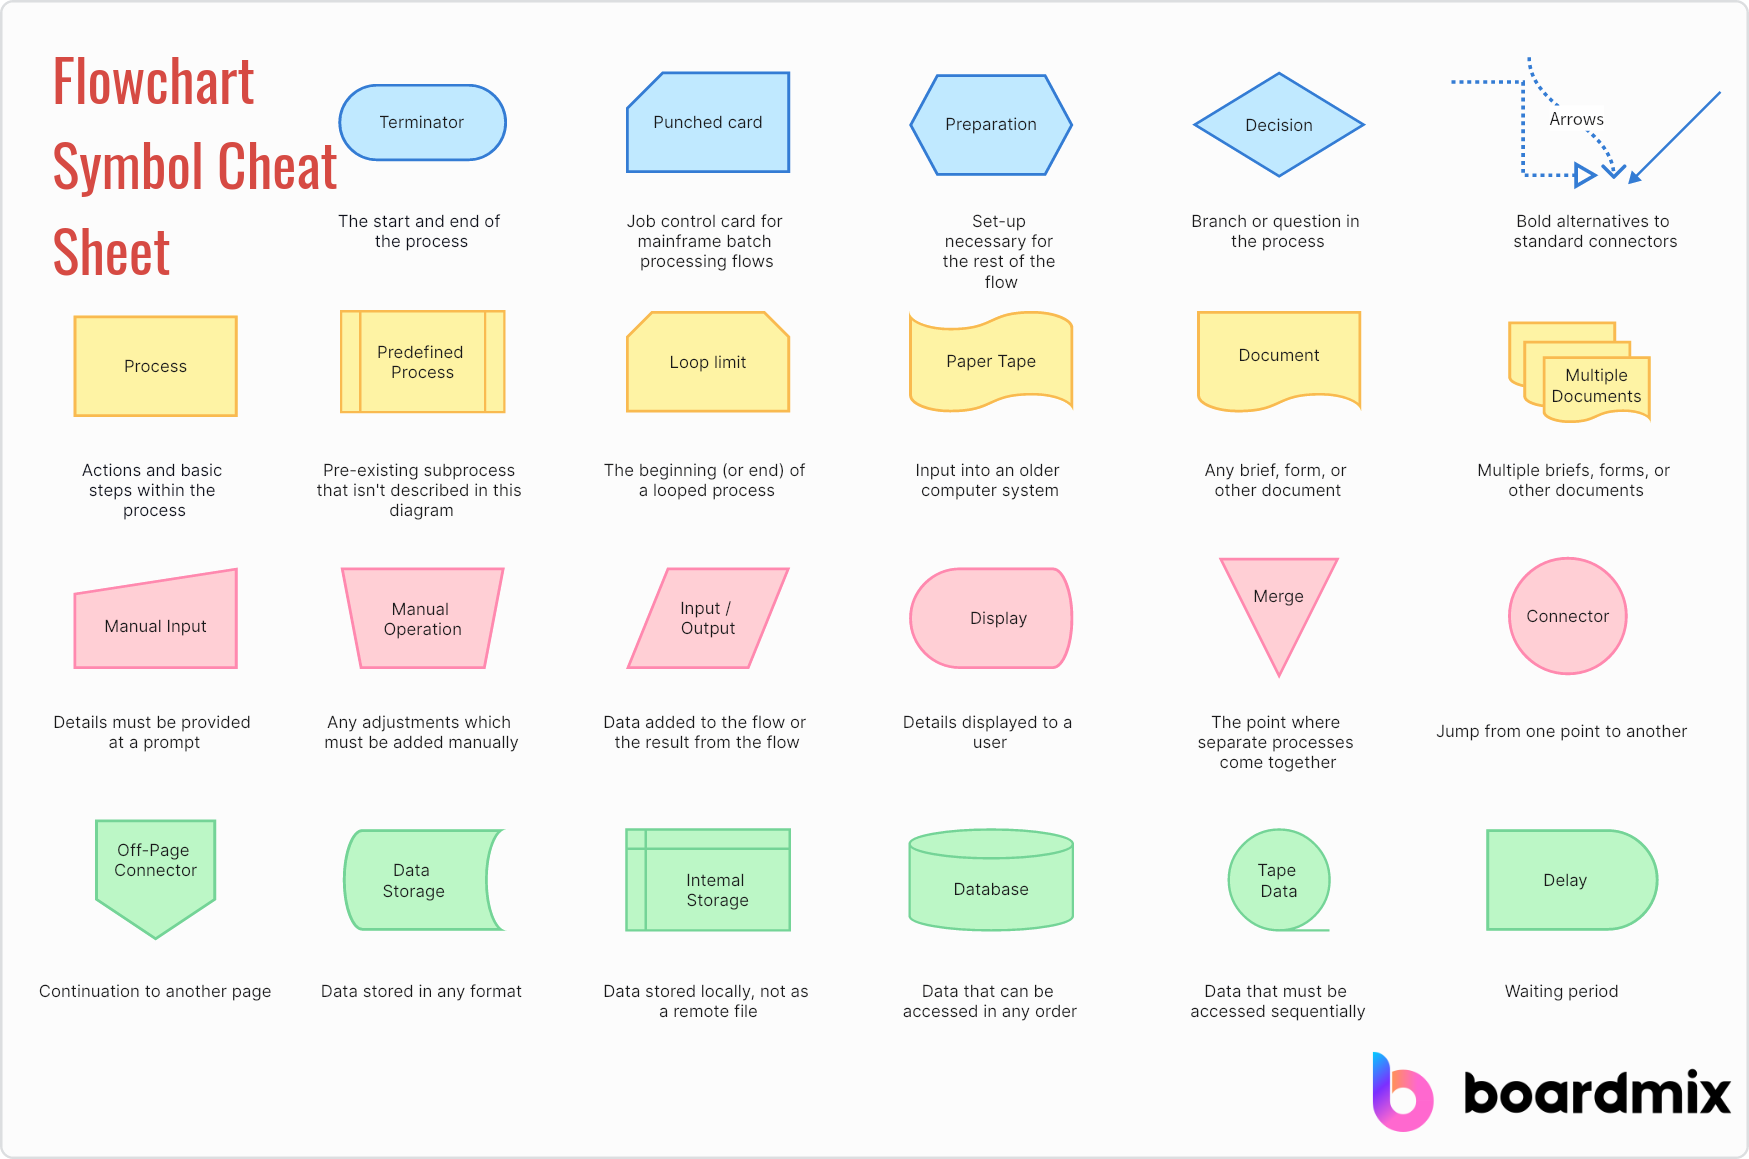
System Flowchart Symbols
When it comes to system flowcharts, symbols play a crucial role. They provide a universal language that enables people to understand the different steps and components of a process, regardless of their background or expertise. Below are some commonly used symbols in system flowcharts and what they represent:
- Oval: Ovals are typically used to denote the start and end points of a process. An oval symbol with the word 'Start' signals the initiation of the process, while an 'End' label indicates its conclusion.
- Rectangle: This is used to depict a process or action step. Any operation, task or activity that needs to be undertaken during the system's process is represented by a rectangle.
- Diamond: Decision points within the process are represented by diamonds. These could include any point where a yes/no question is asked or a choice needs to be made that will affect the direction of the process.
- Parallelogram: This symbol represents inputs or outputs within the system's process. Inputs might include resources or materials needed for the process, while outputs could be final products or results.
- Arrow: Arrows are used to indicate direction of flow, showing how the process moves from one step to another.
- Circle: This is used to denote an on-page connector, which means that the flow continues elsewhere on the same page.
Click Here to Create Flowcharts
These are just a few examples of the symbols that you might encounter when working with system flowcharts. While these are widely accepted standards, different fields or industries might use variations or additional symbols specific to their needs. The key is to always include a legend or key that clearly explains what each symbol represents to ensure clear communication and understanding.
System Flowchart Examples
Examining real-life examples of system flowcharts can provide valuable insights into how these diagrams work. Here, we will walk through three hypothetical flowcharts that represent different processes:
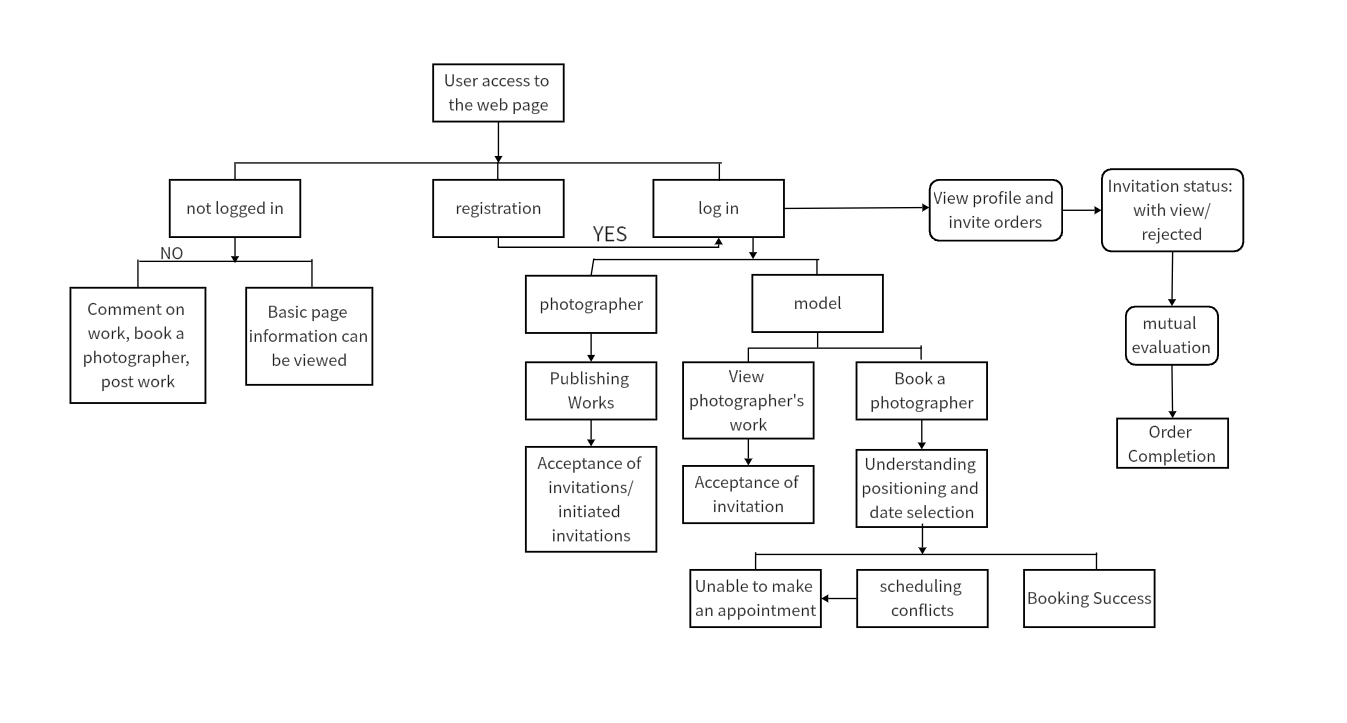
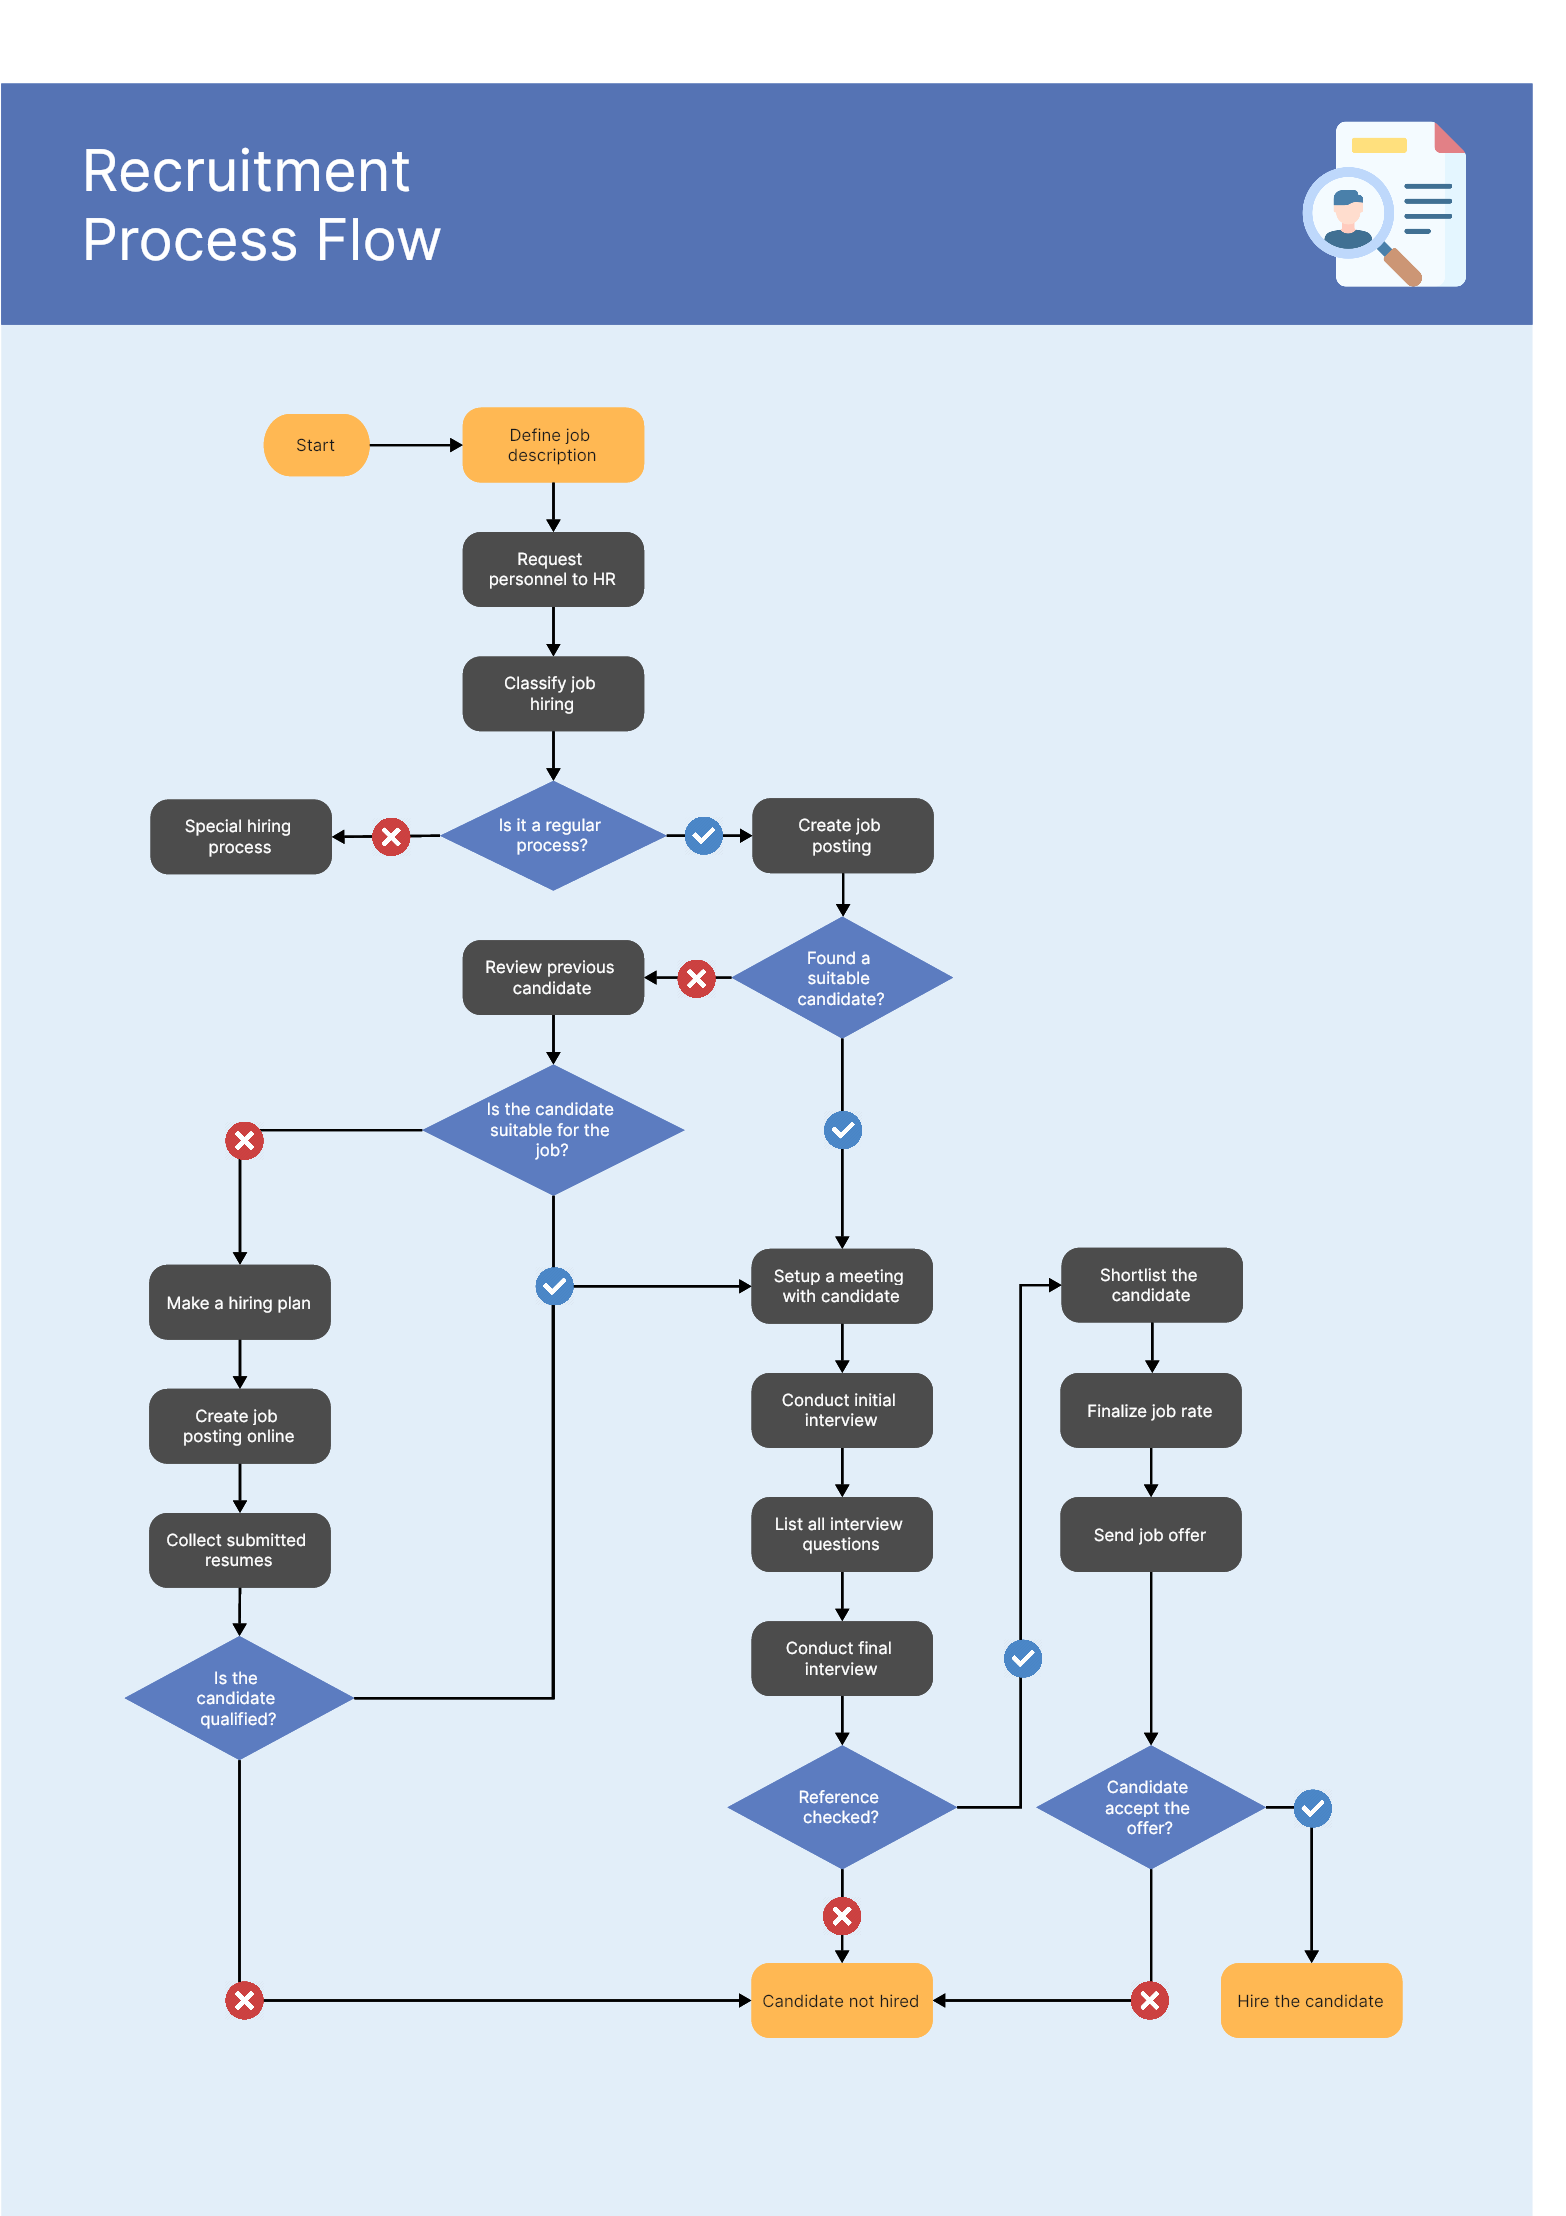
Example 1: Recruitment System Flowchart
In this example, the journey often starts with the "Start" oval indicating the job opening. It then progresses to a rectangle symbolizing the posting of the job advertisement. The next action could be represented by another rectangle, showing receipt of job applications.
Click Here to Create Flowcharts
A diamond could be used to indicate the first decision point – assessing whether an applicant meets the job criteria. If yes, the arrow leads to further steps like interviews and assessments. If not, another path would lead to a process, such as sending a rejection letter.
Following successful interviews, another diamond could indicate the final decision – to hire or not. Depending on the outcome, the chart would conclude at different 'End' points.
Example 2: University Emergency Response System Flowchart
This flowchart might start with an oval symbol representing an emergency occurrence. The following rectangle could indicate the first step – activating the emergency response team. Next might come a diamond for assessing the level of emergency and deciding on evacuation if necessary.
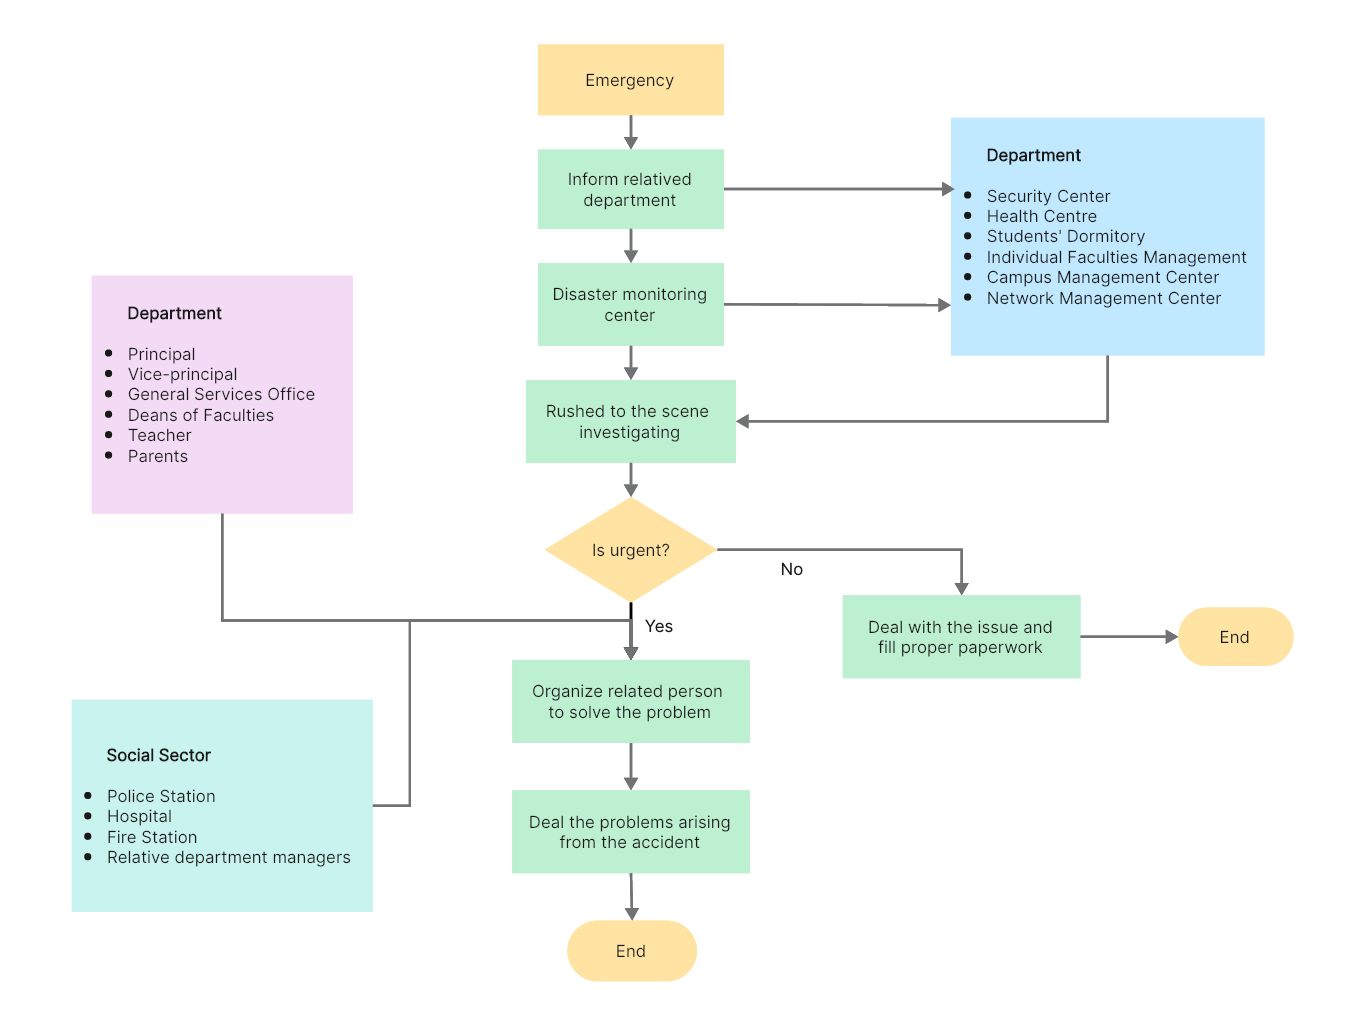
Click Here to Create Flowcharts
The chart could include various potential routes according to different emergency levels, each involving a unique set of actions like notifying authorities, evacuating premises, or providing first aid. Eventually, all paths would culminate at an 'End' oval when the situation is under control.
Example 3: Amazon Book Online Order System Flowchart
In this scenario, the flowchart might start with a customer choosing a book, depicted by a rectangle. The following step could be another rectangle showing the addition of the book to the shopping cart.
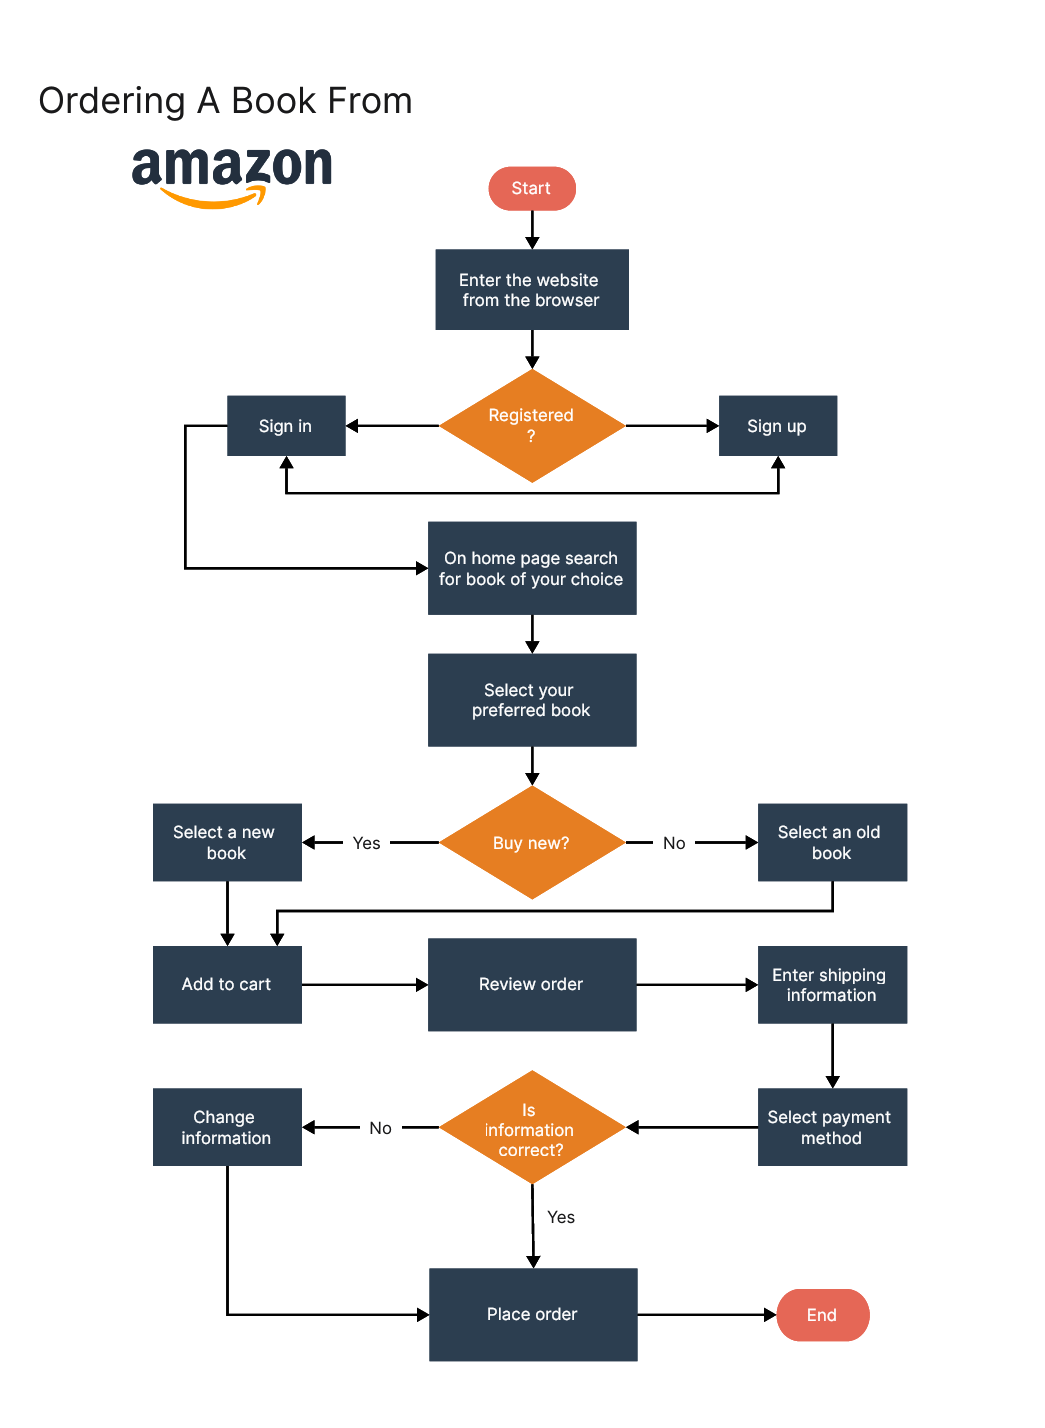
Click Here to Create Flowcharts
A decision diamond could be used for checking stock availability. If stock is available, the process would proceed to payment and order confirmation steps. If not, a different route could lead to a message notifying the customer about the unavailability.
After order confirmation, steps like packaging and shipping would follow. A final rectangle could represent customer receipt of the book, concluding the flowchart with an 'End' oval.
Each of these examples emphasizes how system flowcharts effectively map out processes, promoting comprehension and aiding decision-making.
How to Make a System Flow Diagram in Boardmix
Boardmix is a premier, high-end tool used for creating interactive and intuitive diagrams. It is primarily designed to support and enhance your strategic planning and implementation processes. Boardmix stands out with its extensive suite of features that allow you to create, modify, and present professional-quality diagrams. These diagrams serve multiple purposes, from planning workflows to mapping out complex systems. Boardmix's strength lies in its adaptability, whether you're a small business owner mapping out a new project or an enterprise-level manager overseeing complex systems.

One of the popular uses of Boardmix is the creation of system flow diagrams. System flow diagrams are critical in understanding the workflow and identifying potential bottlenecks or inefficiencies within the system. But the process of making these diagrams can often be a daunting task, especially for those who are new to it. However, with Boardmix, the process becomes more manageable and efficient.
To create a system flow diagram in Boardmix, you must first have a clear understanding of the system you want to illustrate. Once you've clarified the purpose and the key elements of your system, you're ready to get started with Boardmix.
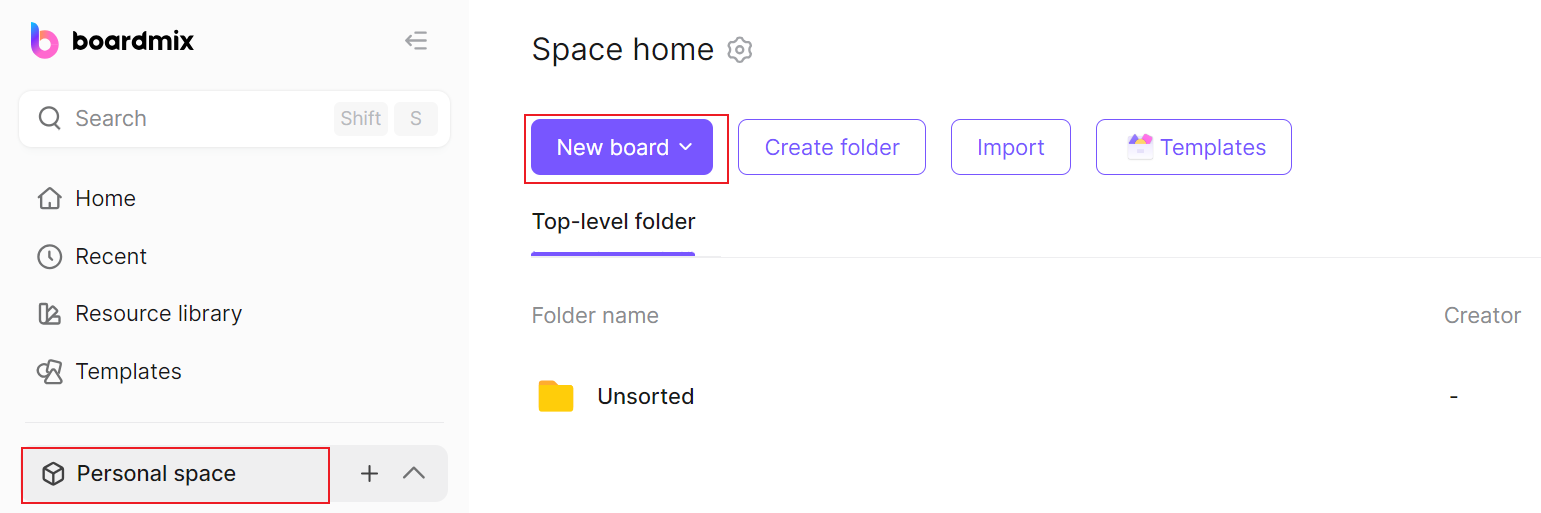
Step 1: Starting Your Boardmix Board
Upon launching Boardmix, start a new project by clicking on the "New board" button. This will open a blank workspace where you can start crafting your system flow diagram.
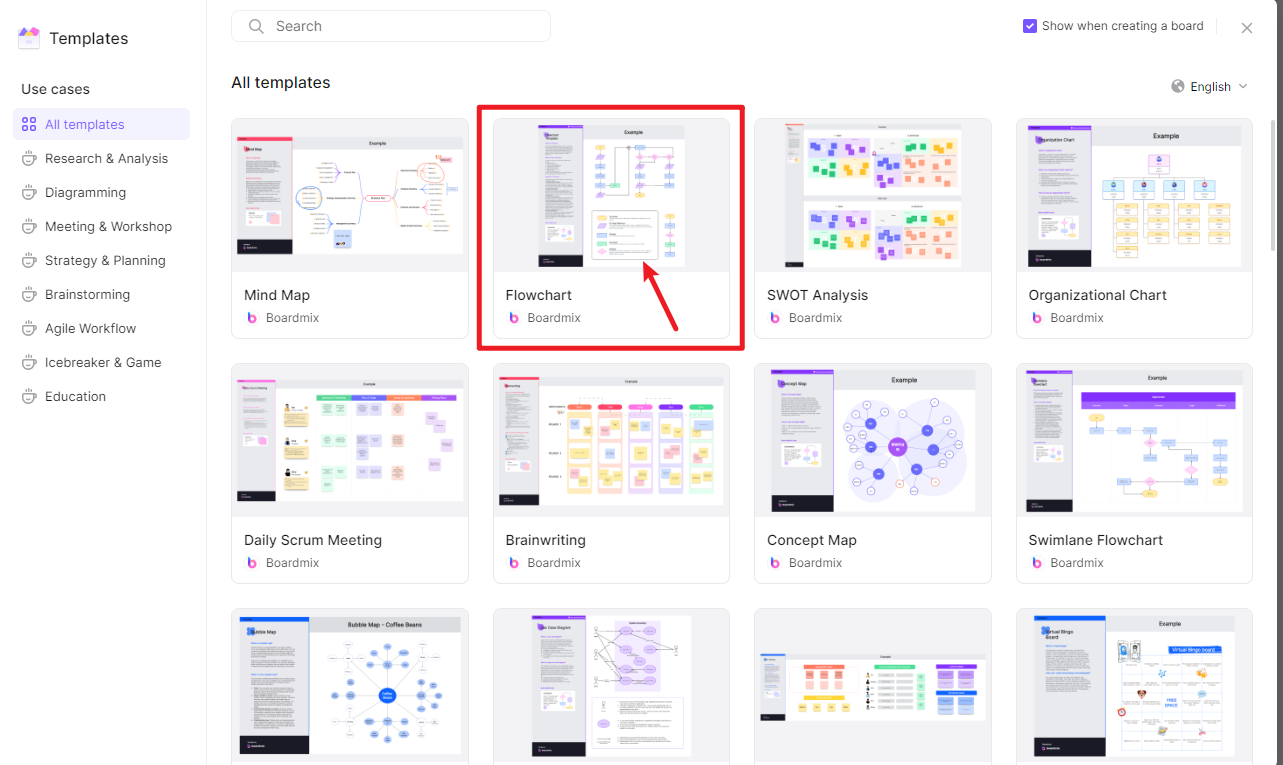
Step 2: Selecting the Right Template
Next, select the template for your diagram. Boardmix provides numerous templates that cater to various needs, from simple flow charts to intricate system diagrams. Choose the one that aligns with your needs. You can also start from scratch.
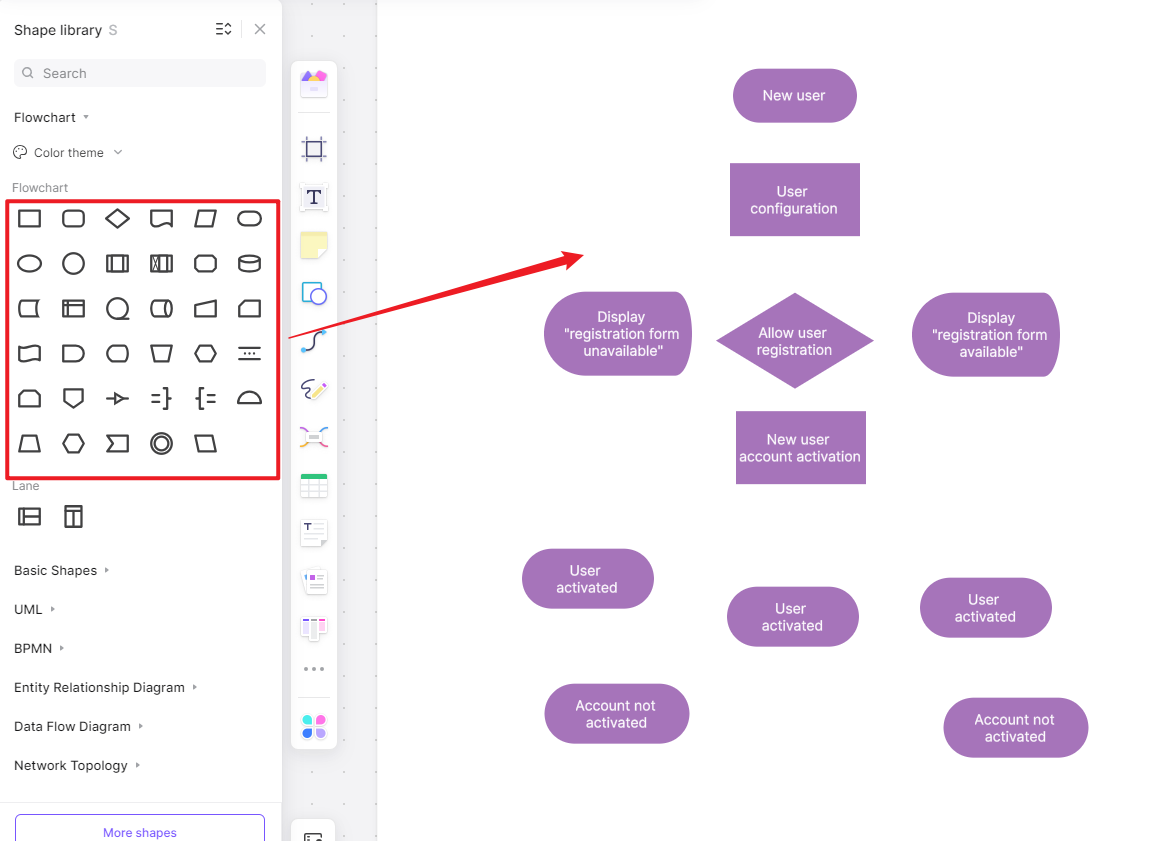
Step 3: Mapping Out Your System
With your template selected, begin by mapping out the major components of your system. You can use shapes to represent different components. For example, rectangles might represent tasks or processes, while diamonds might represent decision points.
Step 4: Connecting the Components
After mapping out all the components, start connecting them using arrows. The arrows indicate the flow or direction between different components.
Step 5: Finalizing and Refining Your Diagram
Once your diagram is complete, it's time to refine it. You can adjust the positioning of components, color code different parts, or add explanatory notes as necessary. Boardmix offers extensive editing tools to help you tailor your diagram to your exact needs.
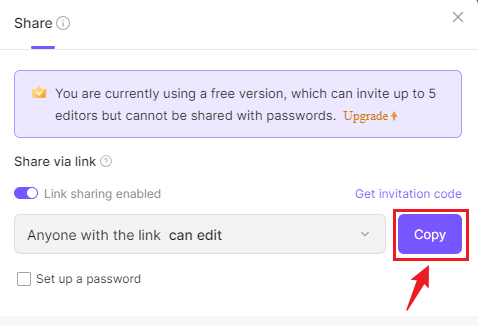
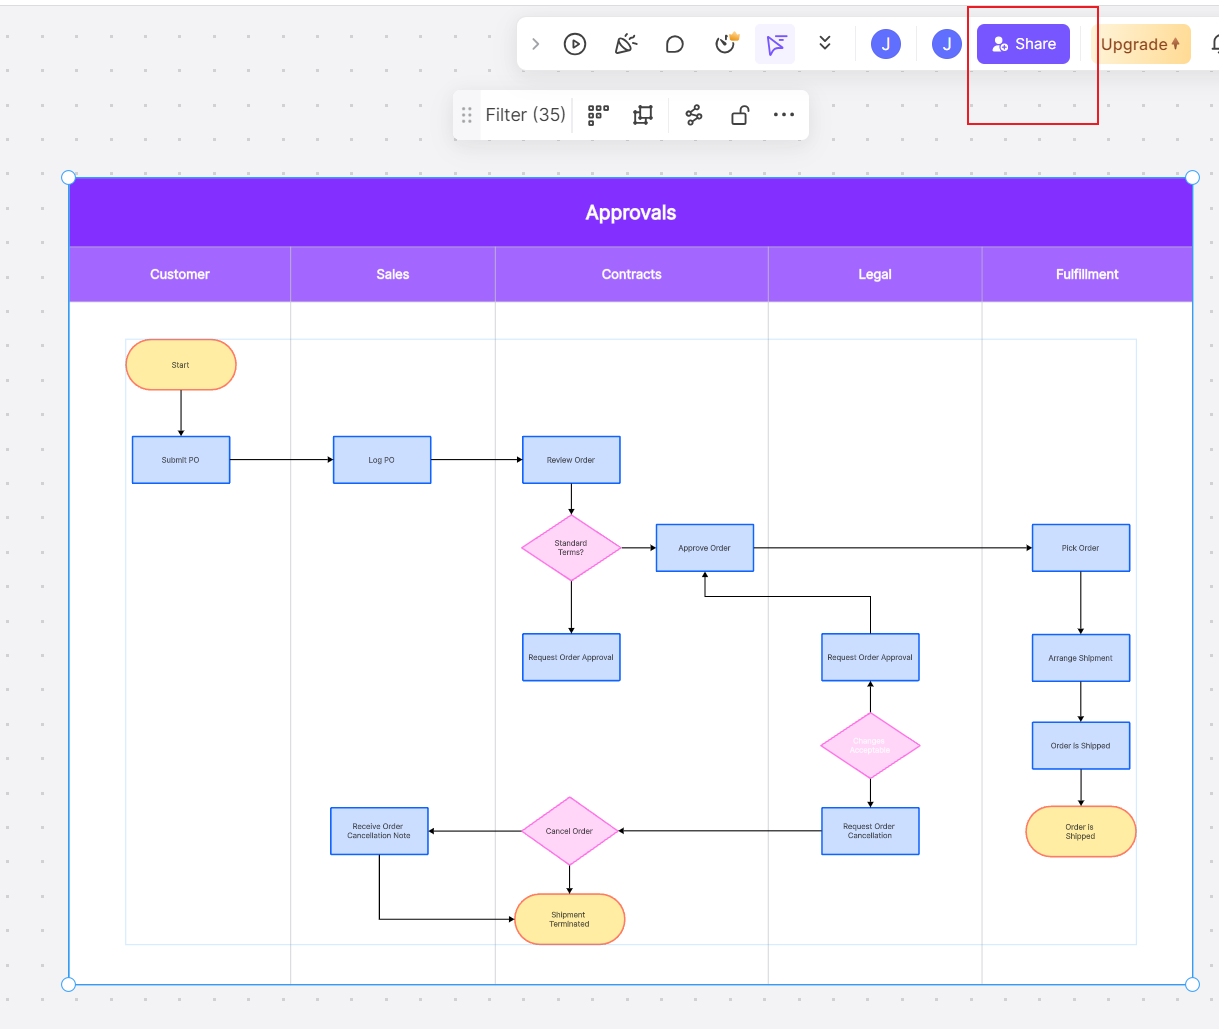
Step 6: Reviewing and Sharing Your Diagram
After finalizing your diagram, it's essential to review it for any possible errors or areas of improvement. Once you're satisfied with your system flow diagram, don't forget to save it.
Creating system flow diagrams can be a complex task, but with tools like Boardmix, this process becomes significantly more manageable. With its user-friendly interface and a comprehensive set of features, Boardmix is an invaluable tool for those seeking to create detailed, accurate, and visually appealing system flow diagrams.
Remember that creating effective system flow diagrams goes beyond just laying out steps and connecting them. You need a deep understanding of the system and the ability to accurately represent it visually. With Boardmix, you have a powerful tool to help you do just that. The ultimate goal is to use these diagrams to analyze, improve, and effectively communicate your system's functionality.
Read about How to Use A Free AI Flowchart Generator
FAQ: What are the 4 Main Flowchart Types?
Understanding the different types of flowcharts can help you choose the best one for your needs. In diagramming and visual representations, flowcharts play a critical role in displaying processes or systems. In essence, there are four main types of flowcharts: Process Flowchart, Workflow Chart, Data Flowchart, and Business Process Modelling Notation (BPMN). Each has a unique use and can provide different perspectives on a system or process.
1. Process Flowchart
The most common type of flowchart is the process flowchart. These diagrams are used to showcase the steps involved in a process. Each step is represented by a specific symbol like rectangles for tasks, diamonds for decisions, and arrows for direction of flow. Process flowcharts help illustrate the start, middle, and end of a process and can be helpful in identifying bottlenecks or areas for improvement.
2. Workflow Chart
Workflow charts are similar to process flowcharts, but they have a specific focus on the tasks and activities within an operational workflow. They provide insight into who does what, when they do it, and how tasks interrelate. Workflow charts are used primarily in understanding team and organizational workflows, and they are valuable in streamlining work processes.
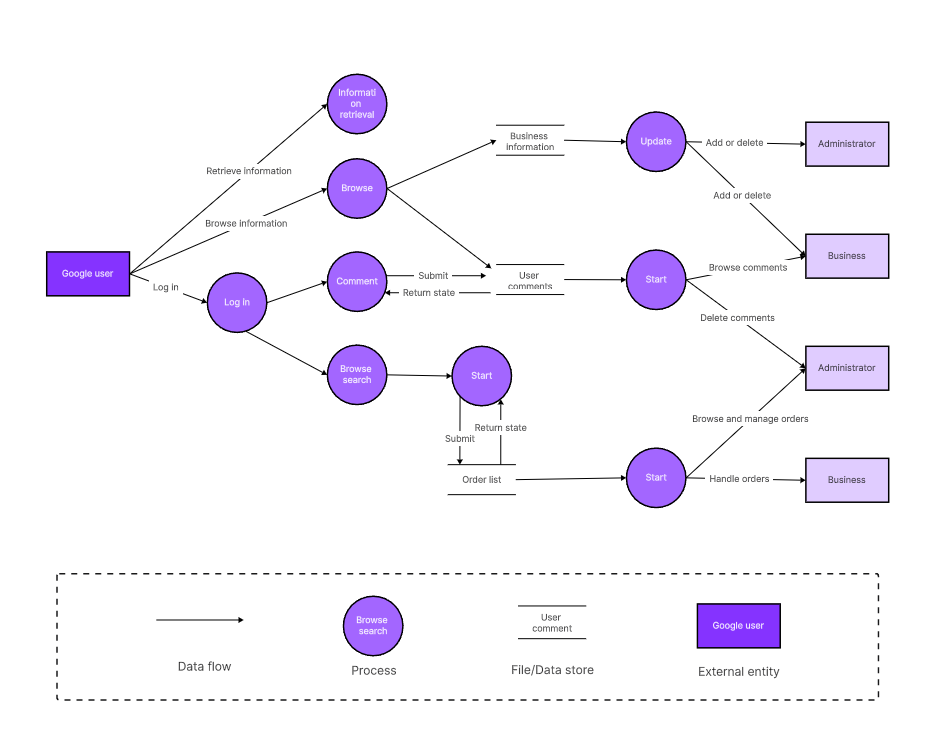
3. Data Flowchart
Data flowcharts are specialized charts used in system or software engineering to visualize how data moves through a system. They illustrate how inputs are transformed into outputs through a series of functional transformations. Each part of the process is clearly defined, and these charts are incredibly useful in identifying redundancies or gaps in a data management system.
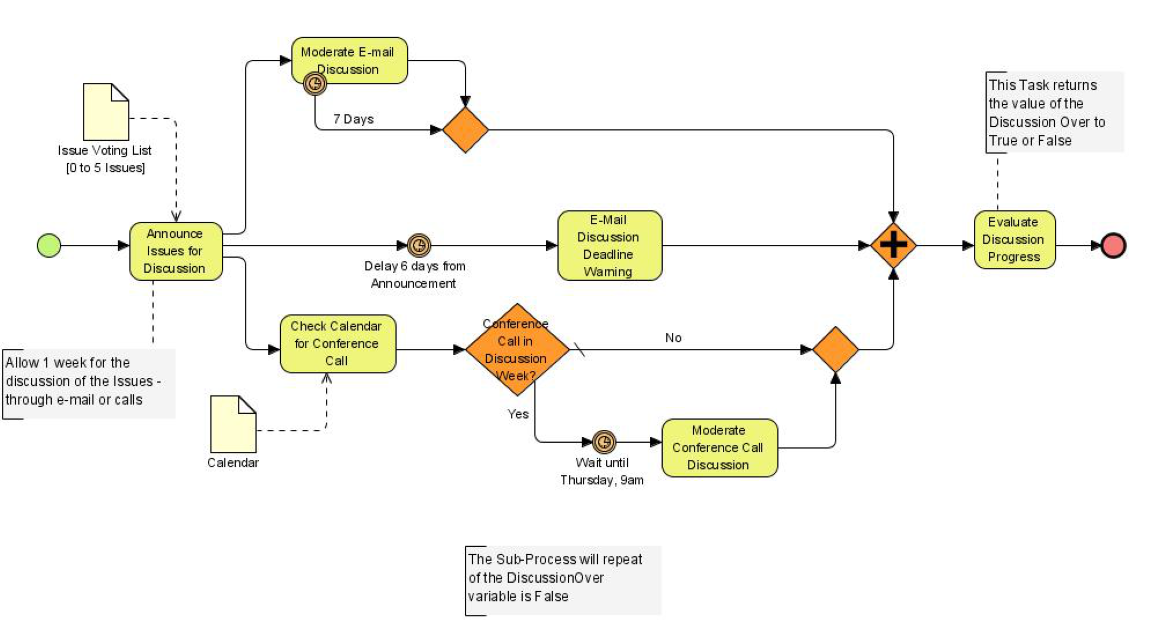
4. Business Process Modelling Notation (BPMN)
BPMN is a standardized graphical notation used mainly in business process modeling. It offers a more sophisticated range of symbols to depict complex corporate procedures, including event-driven process chains and sequence flows. BPMN provides a more detailed view of processes and enables communication across various stakeholders effectively.
Each type of flowchart serves its unique purpose, whether it's understanding a simple process or analyzing a complex system. Understanding these types will enable you to choose the appropriate chart for your particular needs and express your systems or processes most effectively.


