All types of companies deal with large amounts of data that require retrieval and presentation when required. To handle large data effectively, organizations use several structures of data like bar charts. Here is a list of 6 powerful bar graph makers that can help organize data into presentable charts in less time. Keep reading and find the one that suits you best!

What Is a Bar Graph
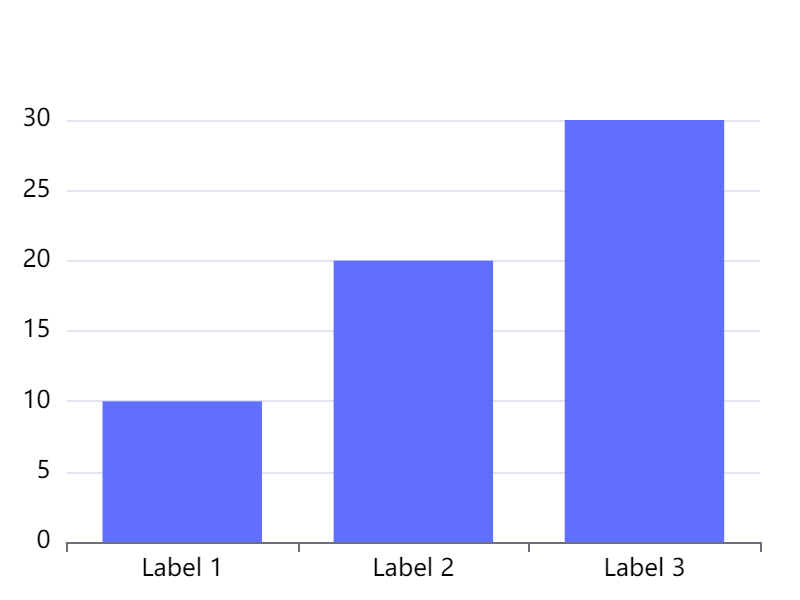
A bar graph, also known as a bar chart, is a graphical representation of data using bars of different heights. A bar chart is a simple chart that you can use to represent data pictographically. The bars are placed proportional to each other horizontally or vertically over the axis. In other words, a bar chart deals with categorical data, which is data in categories that need a comparison.
Why Do You Need a Bar Chart Maker
A bar chart maker helps create bar charts quickly and easily when comparing sales figures for different products or services in an organization as well as tracking the progress over time. With a bar chart maker template, you can easily make presentations and reports in a professional and appealing way. Bar chart makers also provide customization options to create charts that match your branding.
What to Look for in an Online Bar Graph Maker
The following are some essential factors to consider when choosing the best online bar graph maker.
- Ease of use: Some online bar graph makers are easy to use compared to others. If you are new to creating barcharts, you should consider selecting a user-friendly bar chart maker.
- Pricing: There are a wide variety of online bar graph makers available today. Some bar graph tools are free while others require subscription fees. Choose a bar graph creator that fits your needs and budget.
- Features: When selecting a bar chart maker, it is important to look for helpful features such as customization, sharing with others, the ability to remove or add data points, transitions, animations, and different export formats.
- Support: Technical support is another useful feature you should consider when choosing an online bar graph maker. Ensure your bar graph maker provides good support in case you need any assistance.
6 Powerful Bar Graph Makers
Let’s now have a look at the 6 powerful bar graph makers that you can use.
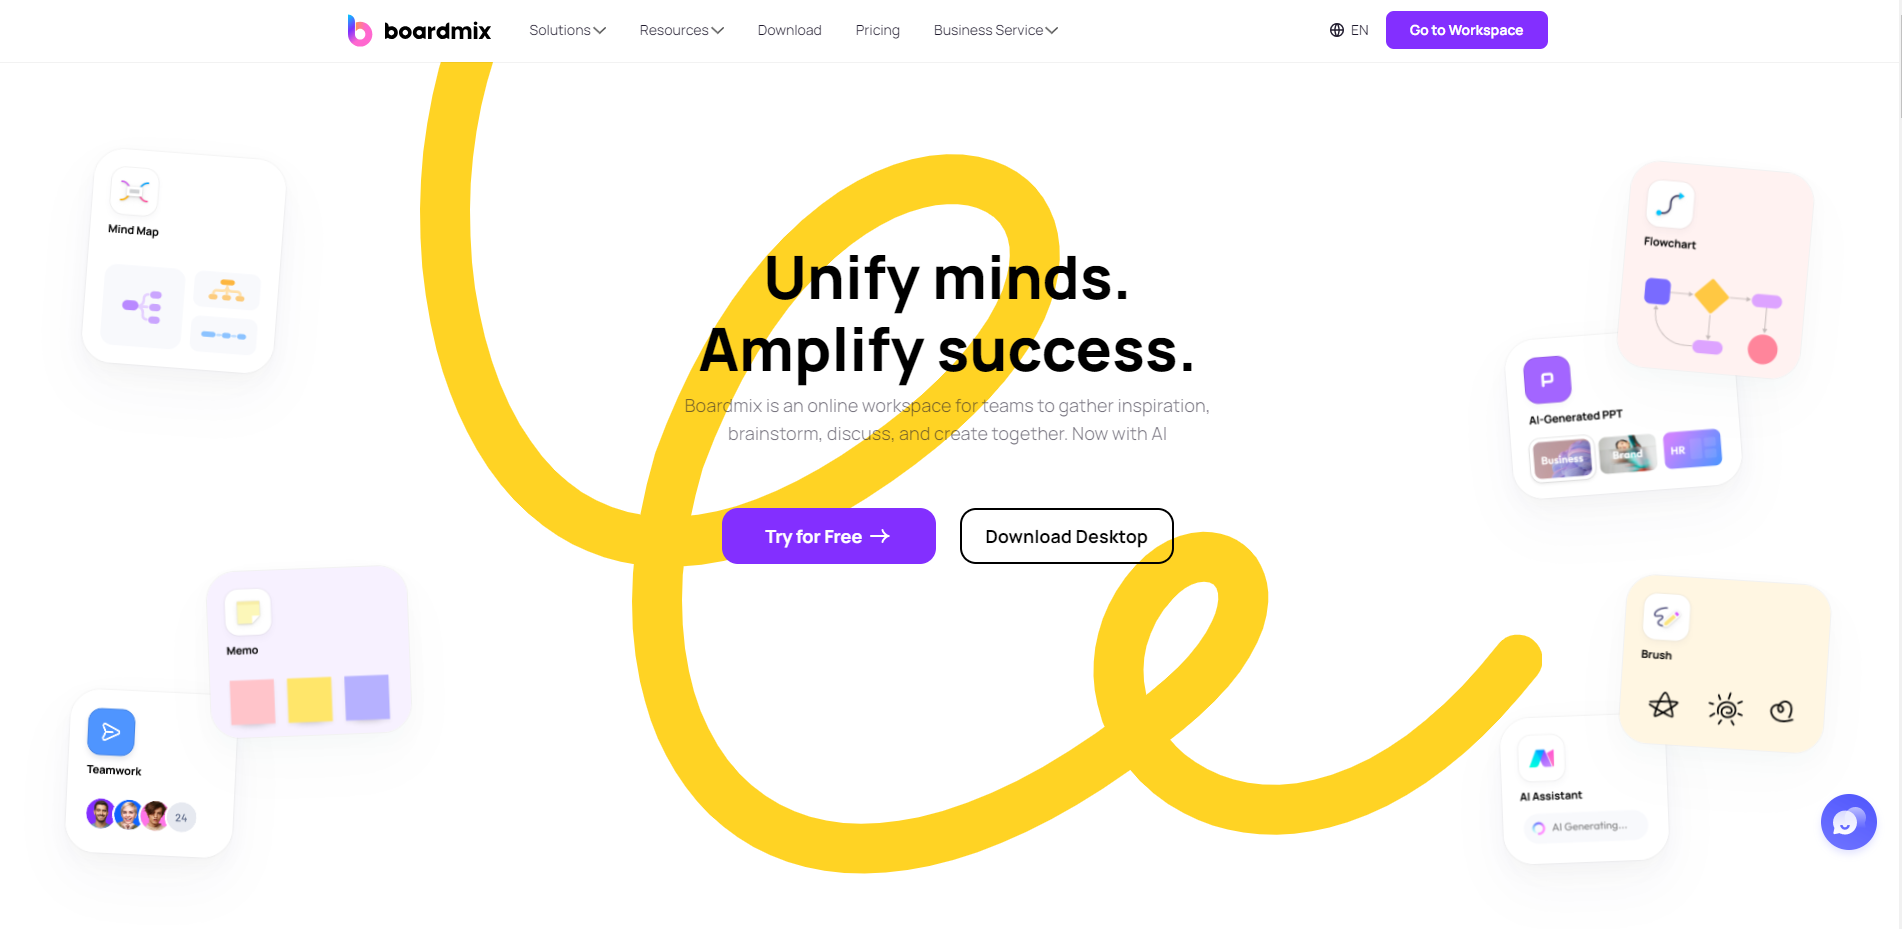
Boardmix
Boardmix is an online bar graph maker that allows you to add visual interest to your brand presentation. Whether you want to use a horizontal or vertical bar graph, Boardmix bar graph features allow you to simplify and present your data.
Key Features
- Ability to customize color, position, labels, and fonts.
- Easy to use interface: Unlike other bar graph makers, Boardmix has an intuitive interface that easily transforms your datasets into bar charts.
- Easy to collaborate with other members of your teamin real time.
- A wide range of graphs to choose from.
Pros and Cons
Pros
- Easy to use.
- Great real-time collaboration features.
- Great platform for beginners.
Cons
- The free plan has limited features.
- Limited offline functionality.
Pricing
Individual
- Free: $0
- Monthly Plan: $ 5.9 per month.
- Annual Plan: $ 4.9 per month, billed $58.8 annually.
- 3-Year Plan: $ 2.9 per month, billed $104.4 every 3 years.
Team
- Monthly Plan: $9.9 /month per member
- Annual Plan: $6.9/ month per member, billed $82.8 annually.
- 3-Year Plan: $3.9/month per member, billed $140.4 every 3 years.
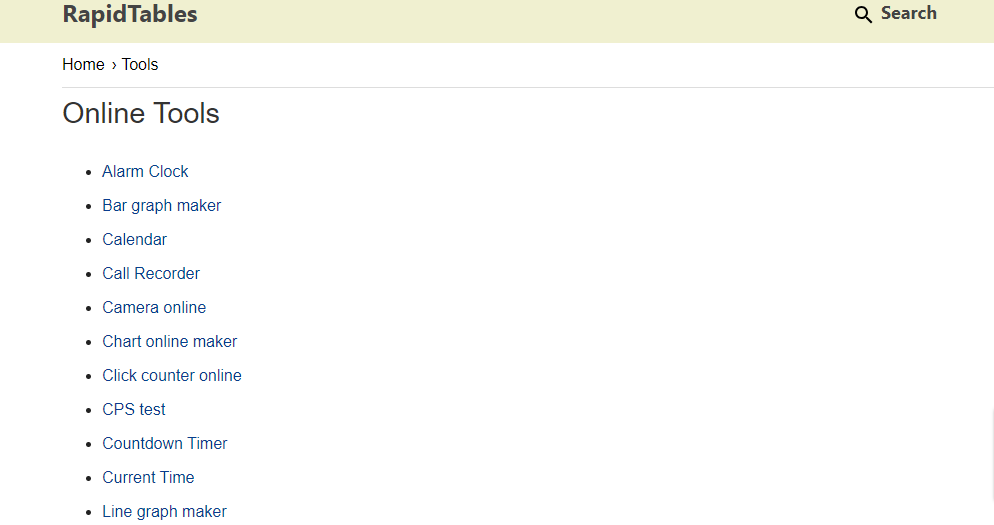
Rapid Tables
Rapid Tables is the online software that provides different diagramming tools including a bar chart maker. Rapid Tables bar graph maker is free and easy to use for all your bar chart needs.
Key Features
- Ability to make different types of bar charts.
- Customization feature.
Pros and Cons
Pros
- Easy to use.
- A wide range of bar graph maker features are available.
- Freeto use.
Cons
- Lacks collaboration features.
Pricing
Free
Visme
Visme is another online bar graph maker with advanced tools to enhance data processing. With Visme data presentation and visualization tools, you can make your content compelling and visually appealing.
Key Features
- A wide variety of graphs and templates to choose from.
- Ability to create animated charts and graphs.
- User-friendly interface.
Pros and Cons
Pros
- A free plan is available.
- Easy and versatile user interface.
- Offers a wide range of features.
- Allows live integration with other tools.
- Provides collaboration with other people.
Cons
- The basic plan has limited features.
- Requires internet connection.
Pricing
- Basic plan: Free
- Starter plan: $12.25 per month, billed yearly (or $29 monthly)
- Pro plan: $24.75 per month, billed yearly (or $59 monthly)
- Visme for Teams: Custom price depending on the size of your team.
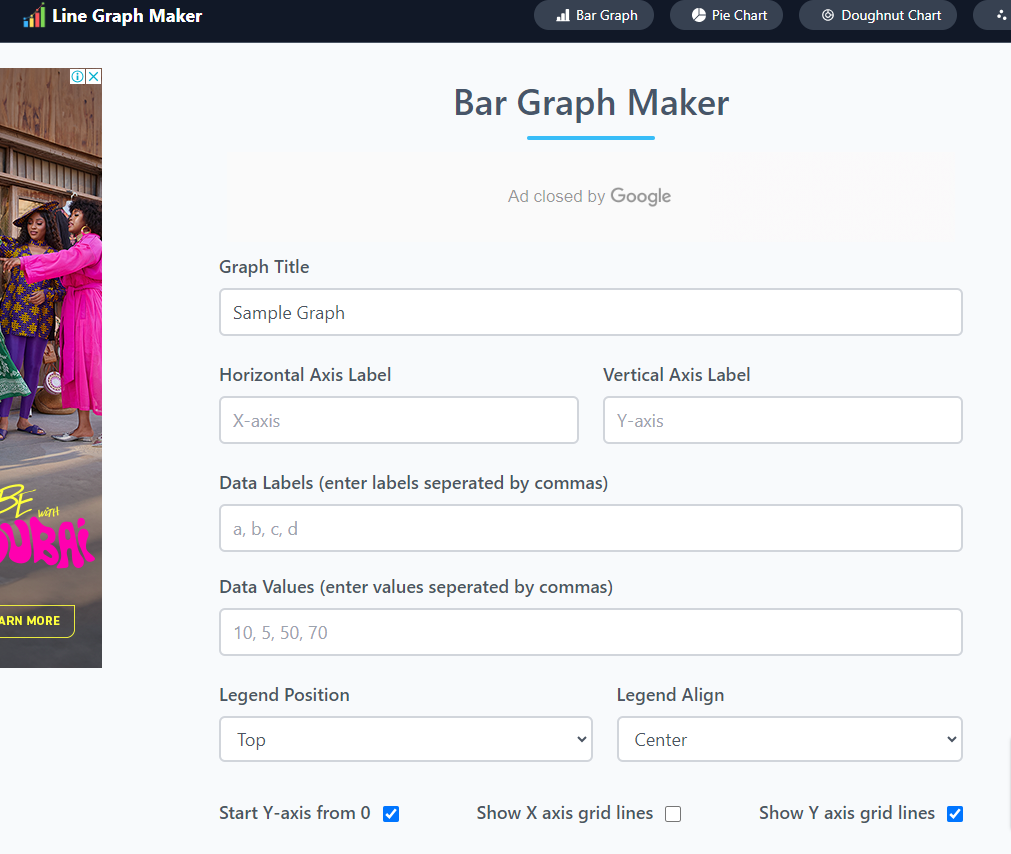
Line Graph Maker
Line Graph Maker is an online bar graph maker you can use to create simple bar charts easily. It has an easy-to-use interface with features for making bar graphs quickly.
Key Features
- Customization of charts.
- Creating different types of bar charts.
- Able to export chartsin various formats.
- Easy to share bar charts.
Pros and Cons
Pros
- Easy to use even for beginners.
- Freeto use.
- A wide range of features for creating bar charts are available.
- You can export bar charts in different formats including JPG, or PNG.
Cons
- Lacks templates for bar graphs, which means users need to create bar charts from scratch.
- Limitedof features compared to other bar chart makers.
- Does not offer collaboration with others.
Pricing
Free
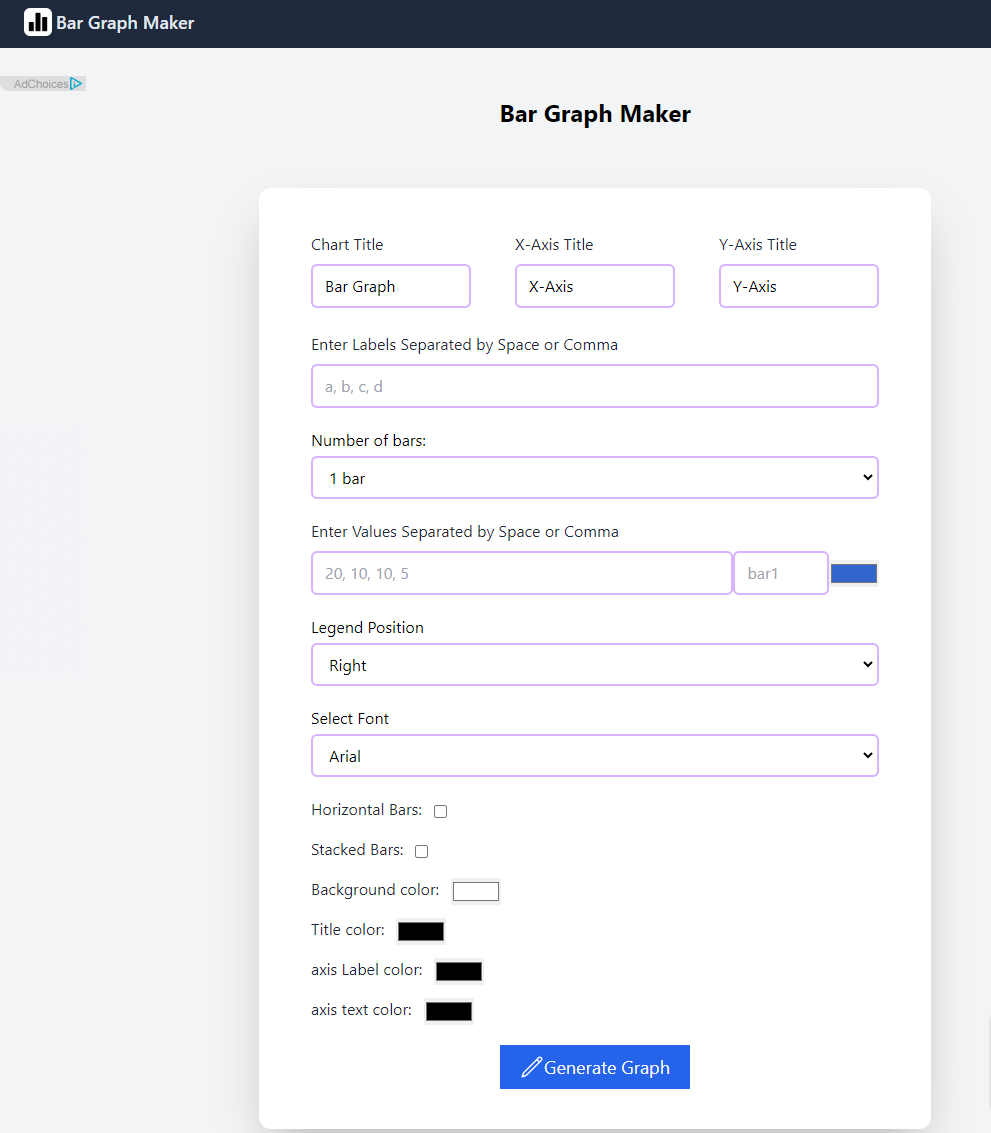
Bar Chart Generator
Bar Chart Generator is another online tool for creating different types of bar charts quickly and easily. While a bar chart generator is easy to use, it lacks essential features to create complex bar graphs.
Key Features
- Easy to createdifferent bar charts.
- Customization features.
- Can export charts in different formats.
Pros and Cons
Pros
- Easy to use interface.
- Ideal for beginners.
- Different export formats are available including SVG, JPEG, and PNG.
Cons
- Does not offer bar graph maker templates.
- Has limited features compared to other online bar chart makers.
Pricing
Free
Canva
Canva is also an online bar graph maker that helps users showcase data with the best visually appealing graphs.
Key Features
- Different types of professional graphs to choose from.
- Professionally designed templates.
- Drag and drop tools.
Pros and Cons
Pros
- Easy to use.
- Easy to customize bar charts fonts, colors, data, labels, and more.
- Ability to collaborate with your team.
- You can download, embed, and share your bar charts.
Cons
- Some bar charts come with watermarks if you are using a free plan.
- Requires an internet connection to access all the features.
Pricing
- Free Plan: $0
- Pro Plan: $6.49 per month or $54.99 per year for one person.
How to Make a Bar Chart in Boardmix
To make a bar chart with Boardmix, use the following simple steps:
- Sign up for free with Boardmix using your email.

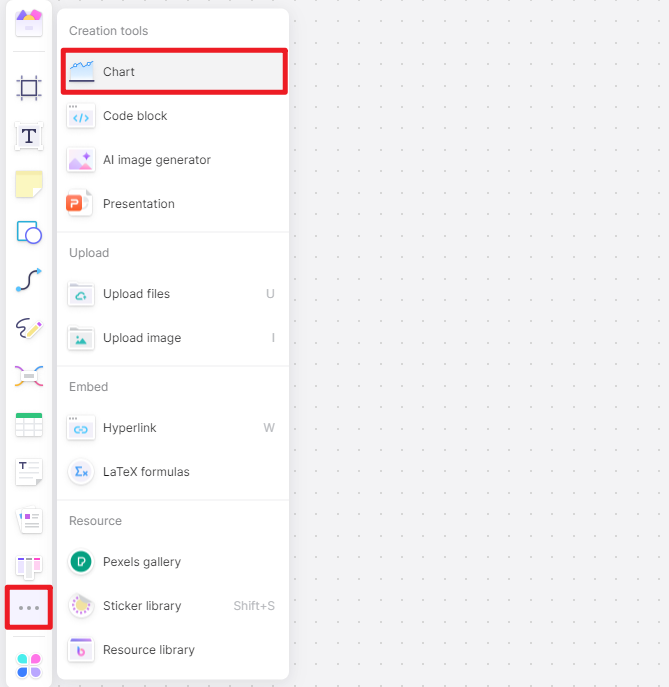
- Create a new board and click the 3-dot menu on the left side, from which select the Chart feature.
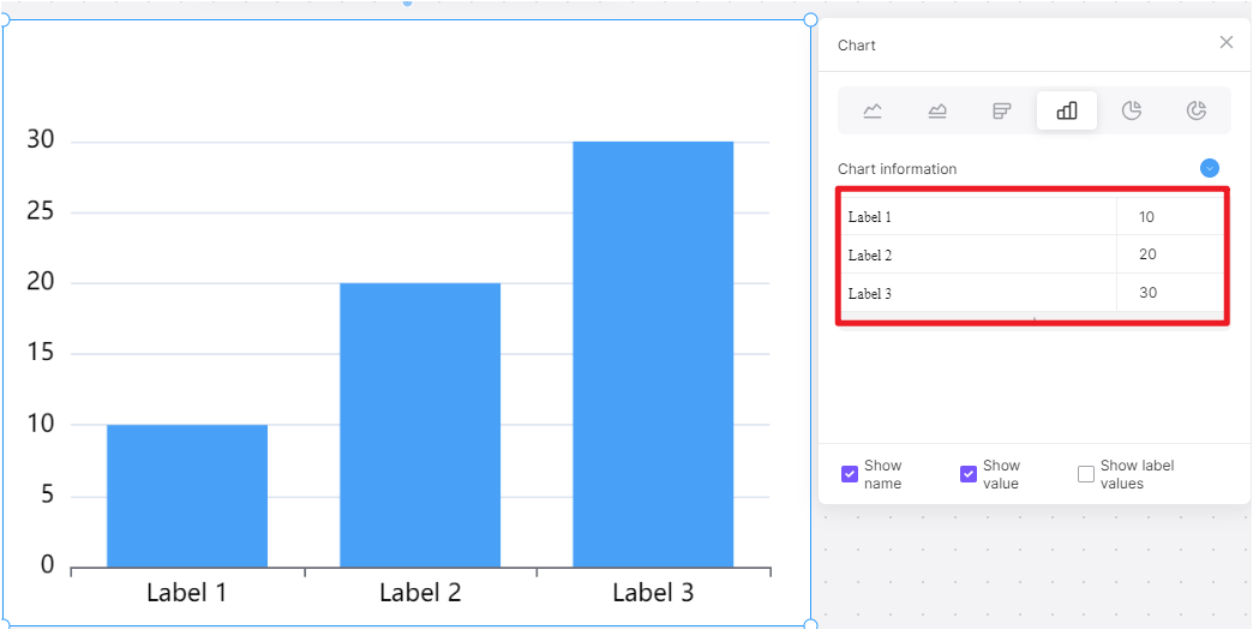
- Apply your data or import it from Google Worksheet.
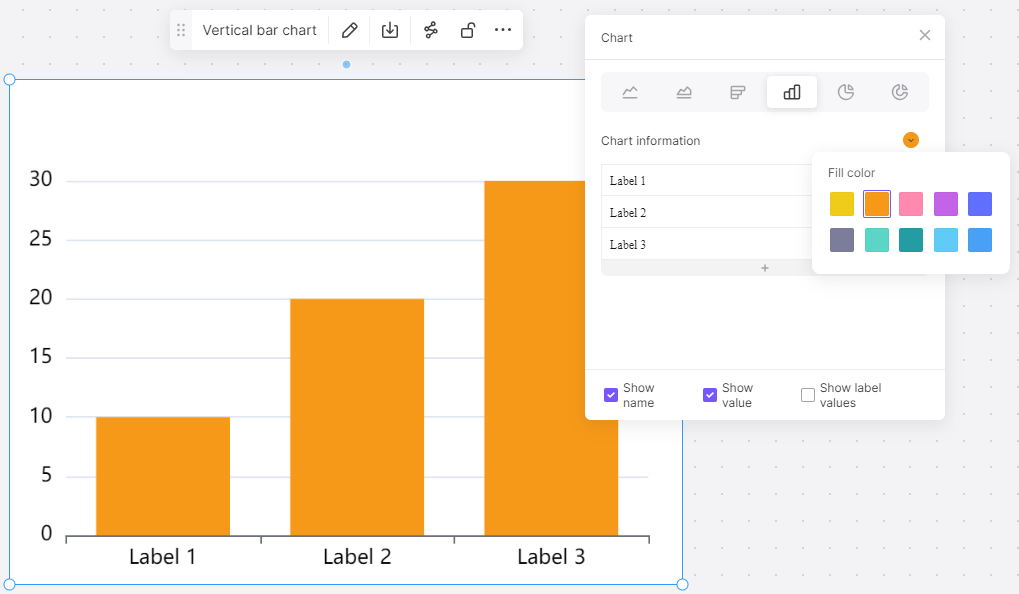
- Customize your bar charts by adding colors, fonts, and design elements like images, shapes, and illustrations.
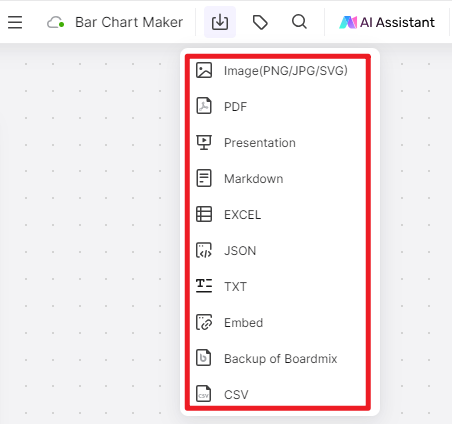
- Download your bar chart in your preferred file formats such as PNG, JPG, or PDF, and add it to an existing project. You can also share the bar graph with your teammates via a sharing link.