


Data visualization is an effective way to understand and present complex data. Bubble charts are a popular data visualization tool due to their ability to display multiple dimensions of data in a simple and understandable format. They are particularly effective in presentations, where visual aids can help audiences grasp the concepts being discussed more easily.
This article will explore what bubble charts are, how to create a bubble chart in PowerPoint, and the advantages and disadvantages of using PowerPoint for this purpose. You’ll also learn a advance bubble charting tool. Keep reading.
What Is a Bubble Chart
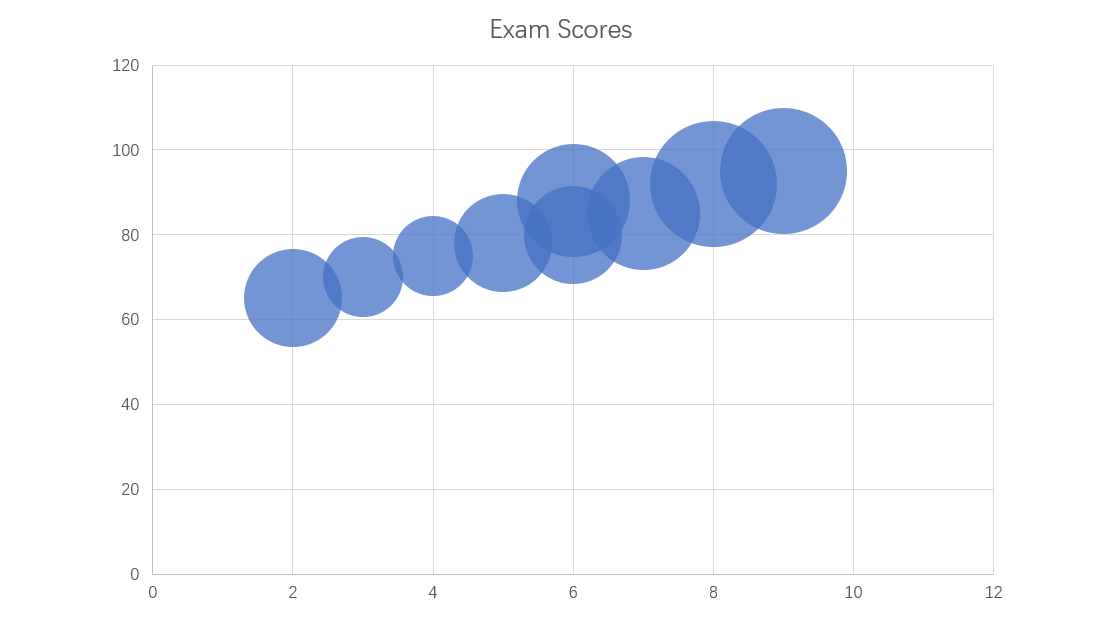
A bubble chart is a type of data visualization that displays three or more dimensions of data. Each entity with its triplet (v1, v2, v3) of associated data is plotted as a disk that expresses two of the vi values through the disk's xy location and the third through its size. This allows the viewer to compare and understand complex data sets at a glance.
How to Create a Bubble Chart in PowerPoint
Creating a bubble chart in PowerPoint is straightforward. Follow these steps to create one:
Step 1: Open PowerPoint, create a blank slide and click on the "Insert" tab.
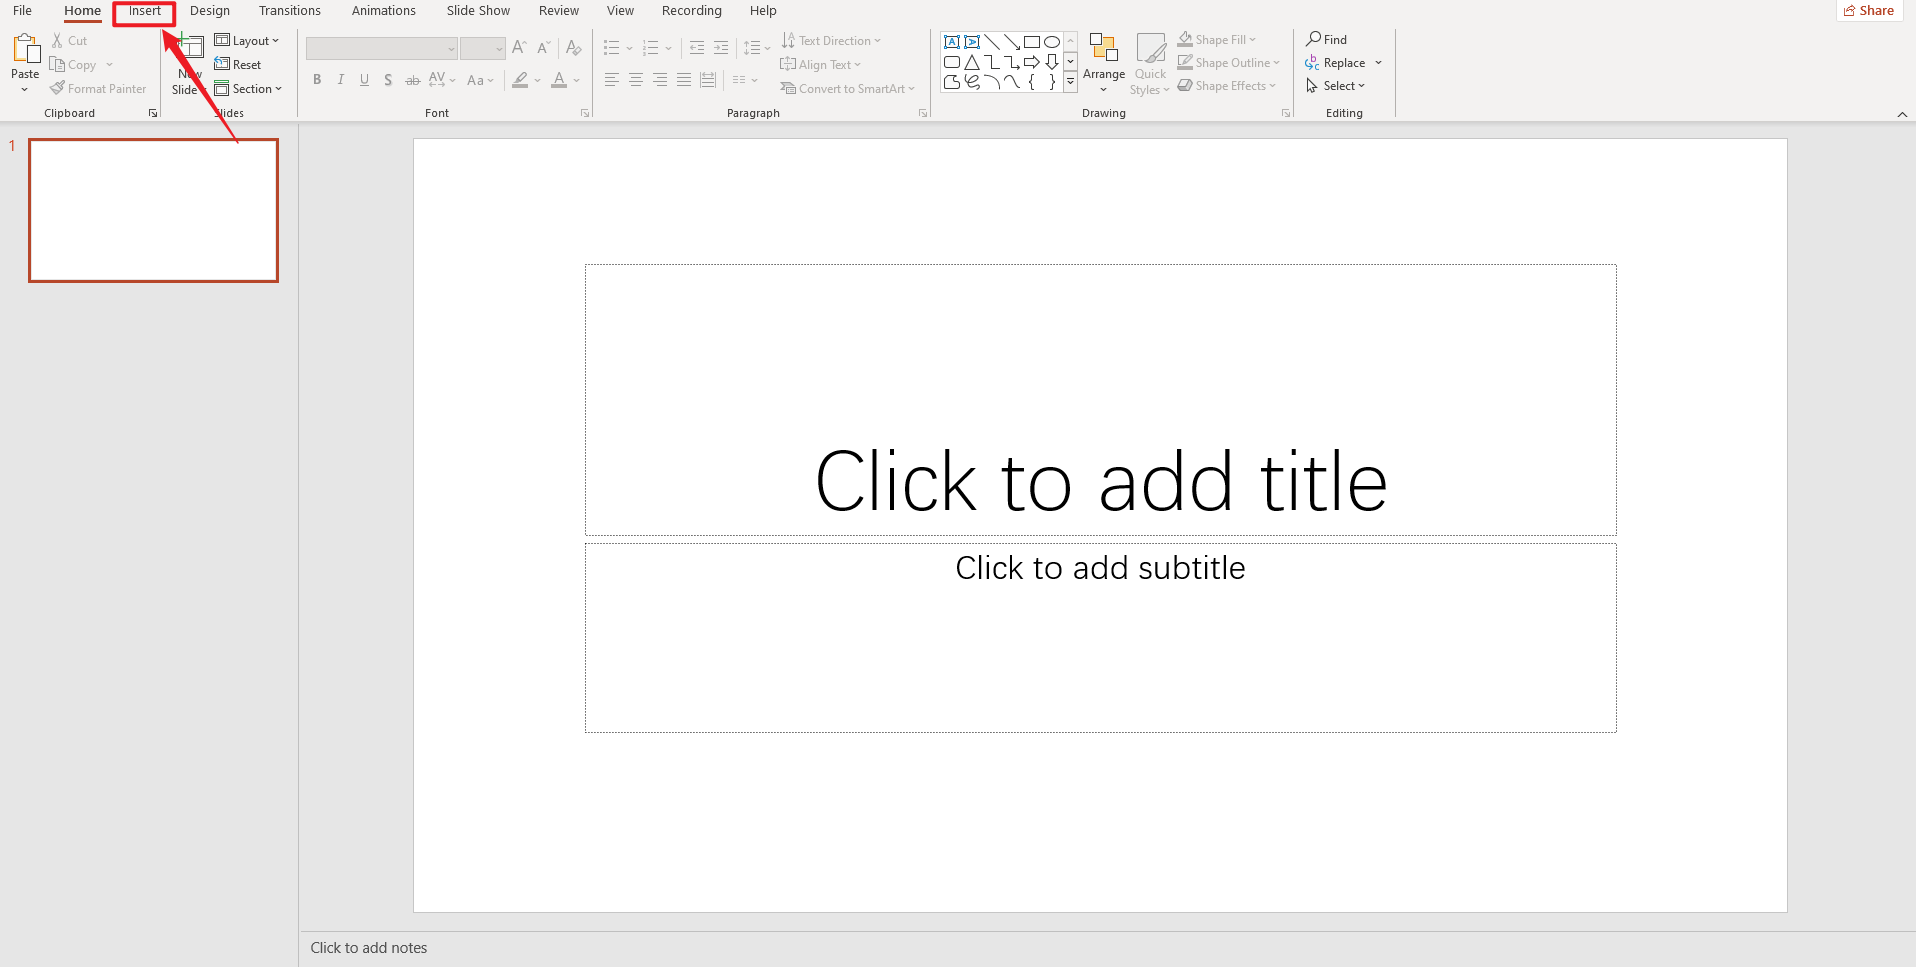
Step 2: Click on "Chart" in the Illustrations group.

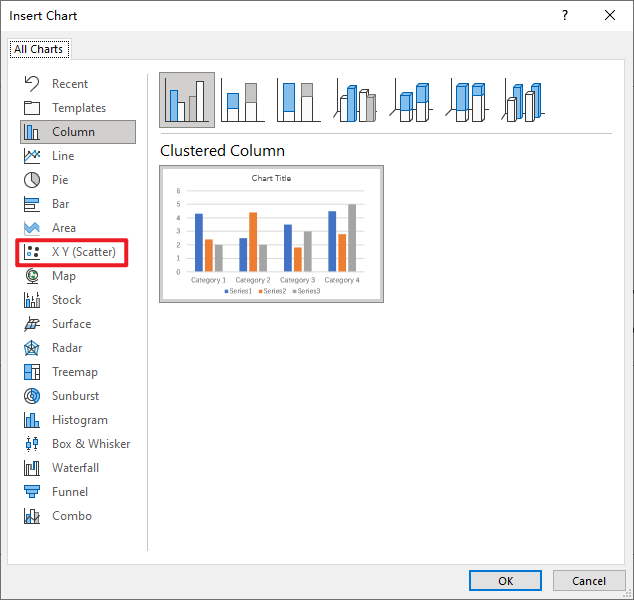
Step 3: In the Insert Chart dialog box, select 'X Y (Scatter)' in the list on the left.
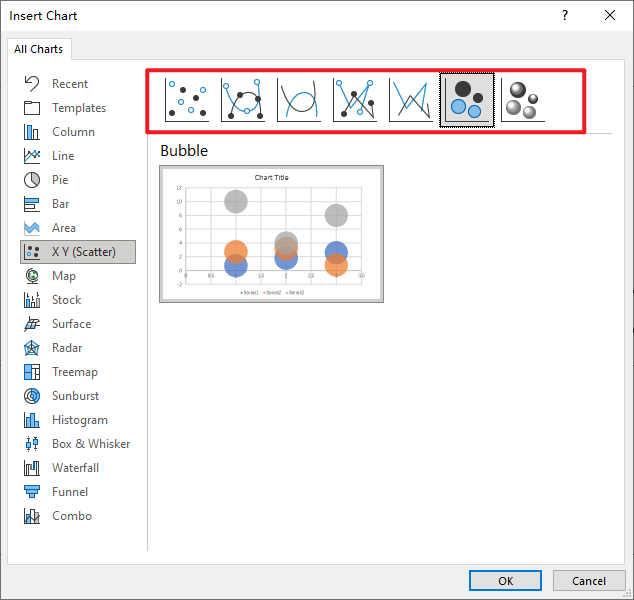
Step 4: Choose your preferred bubble chart type and click 'OK'.
Step 5: Enter your data into the Excel worksheet that opens in the new window.
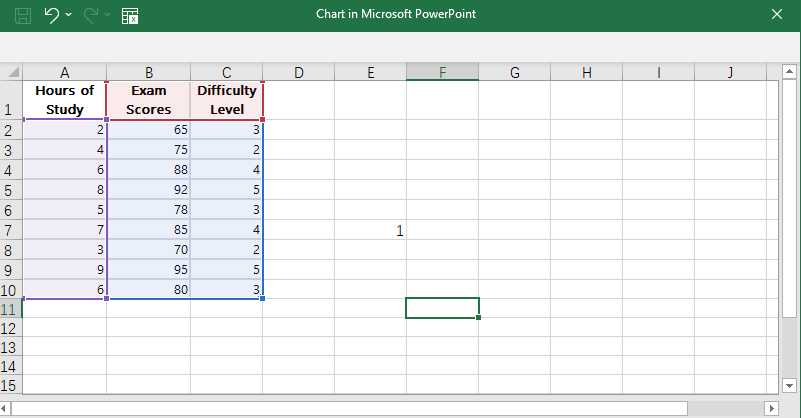
Step 6: Close Excel to view your chart in PowerPoint.
Pros and Cons of Creating a Bubble Chart in PowerPoint
While PowerPoint provides a convenient and familiar platform for creating Bubble Charts, it does come with its set of advantages and disadvantages.
Pros
- Ease of use: PowerPoint's user-friendly interface allows even those without much technical knowledge to create charts with ease.
- Integration with presentations: Since presentations often include visual aids, creating Bubble Charts directly in PowerPoint makes it easier to incorporate them into your slides.
- Customizability: You can easily adjust colors, sizes, and labels of the bubbles to enhance readability and aesthetic appeal.
Cons
- Limited functionality: Compared to specialized charting software, PowerPoint has limited options for customization and data analysis.
- Data input limitations: PowerPoint does not support real-time data integration, so data must be manually updated if changes occur.
- Limited sharing options: While PowerPoint charts can be saved and shared as images or PDFs, they lack the interactive features of charts created with specialized tools.
While PowerPoint is a versatile tool for creating simple bubble charts, you may want to consider specialized software if you require more complex data visualizations or interactive features. Regardless of your choice of tool, bubble charts can serve as an invaluable resource for making sense of complex data sets.
A Top-notch Bubble Chart Maker - Boardmix
In the realm of data visualization tools, the name Boardmix stands out. It is lauded as a top-notch bubble chart maker due to its superior functionality, interactive features, and user-friendly design. In this article, we delve into why Boardmix is such a standout tool and how it can enhance your data visualization process.
Overview of Boardmix
Boardmix is a web-based application that provides an all-in-one platform for project management, collaboration, and data visualization. One of its notable features is its Bubble Chart creator, which enables users to visualize complex multi-dimensional data with ease and sophistication.

Key Features of Boardmix Bubble Chart Creator
Efficiency and Automation
The foremost feature of Boardmix is its ability to automate most parts of the bubble chart creation process. This drastically reduces manual effort, making it ideal for those who need to create complex charts frequently.
Easy Data Input
Boardmix supports direct data import from multiple file formats such as CSV, Excel, and Google Sheets, enabling users to easily input their data for chart creation. This feature bypasses the cumbersome process of manual data entry, making it a user-friendly choice.
Customizability
Boardmix provides several customization options allowing users to adjust colors, bubble sizes, labels, and more according to their preference. This feature enhances the readability and aesthetic appeal of the created bubble charts.
Collaborative Features
The platform also boasts of extensive collaborative features. Multiple users can collaborate on the same project, facilitating sharing and editing rights seamlessly. This makes Boardmix an excellent tool for team projects.
Secure Data Handling
Boardmix adheres to high standards of data security. User data is handled securely and privately, providing peace of mind for businesses that handle sensitive information.
Using Boardmix for Your Data Visualization Needs
By leveraging Boardmix's robust features, you can create high-quality bubble charts that clearly represent your complex datasets. The intuitive interface ensures a smooth chart creation process even for beginners. In addition, the tool's collaborative features facilitate seamless teamwork on projects, making it a versatile choice for both individuals and businesses.


