


The journey through the world of fishbone diagram makers online has unveiled a plethora of options catering to diverse needs and preferences. The fishbone diagram, a powerful tool for problem-solving and process improvement, serves as the backbone for teams striving to enhance efficiency and quality in various industries.
So, what are these top 10 online Fishbone Diagram Makers? How do they simplify the process of creating a Fishbone Diagram? And most importantly, how can these tools enhance your problem-solving and decision-making process? Let's set sail on this exploration together, charting our course through the realm of online Fishbone Diagram Makers.
Part 1: What is a fishbone diagram and why is it useful
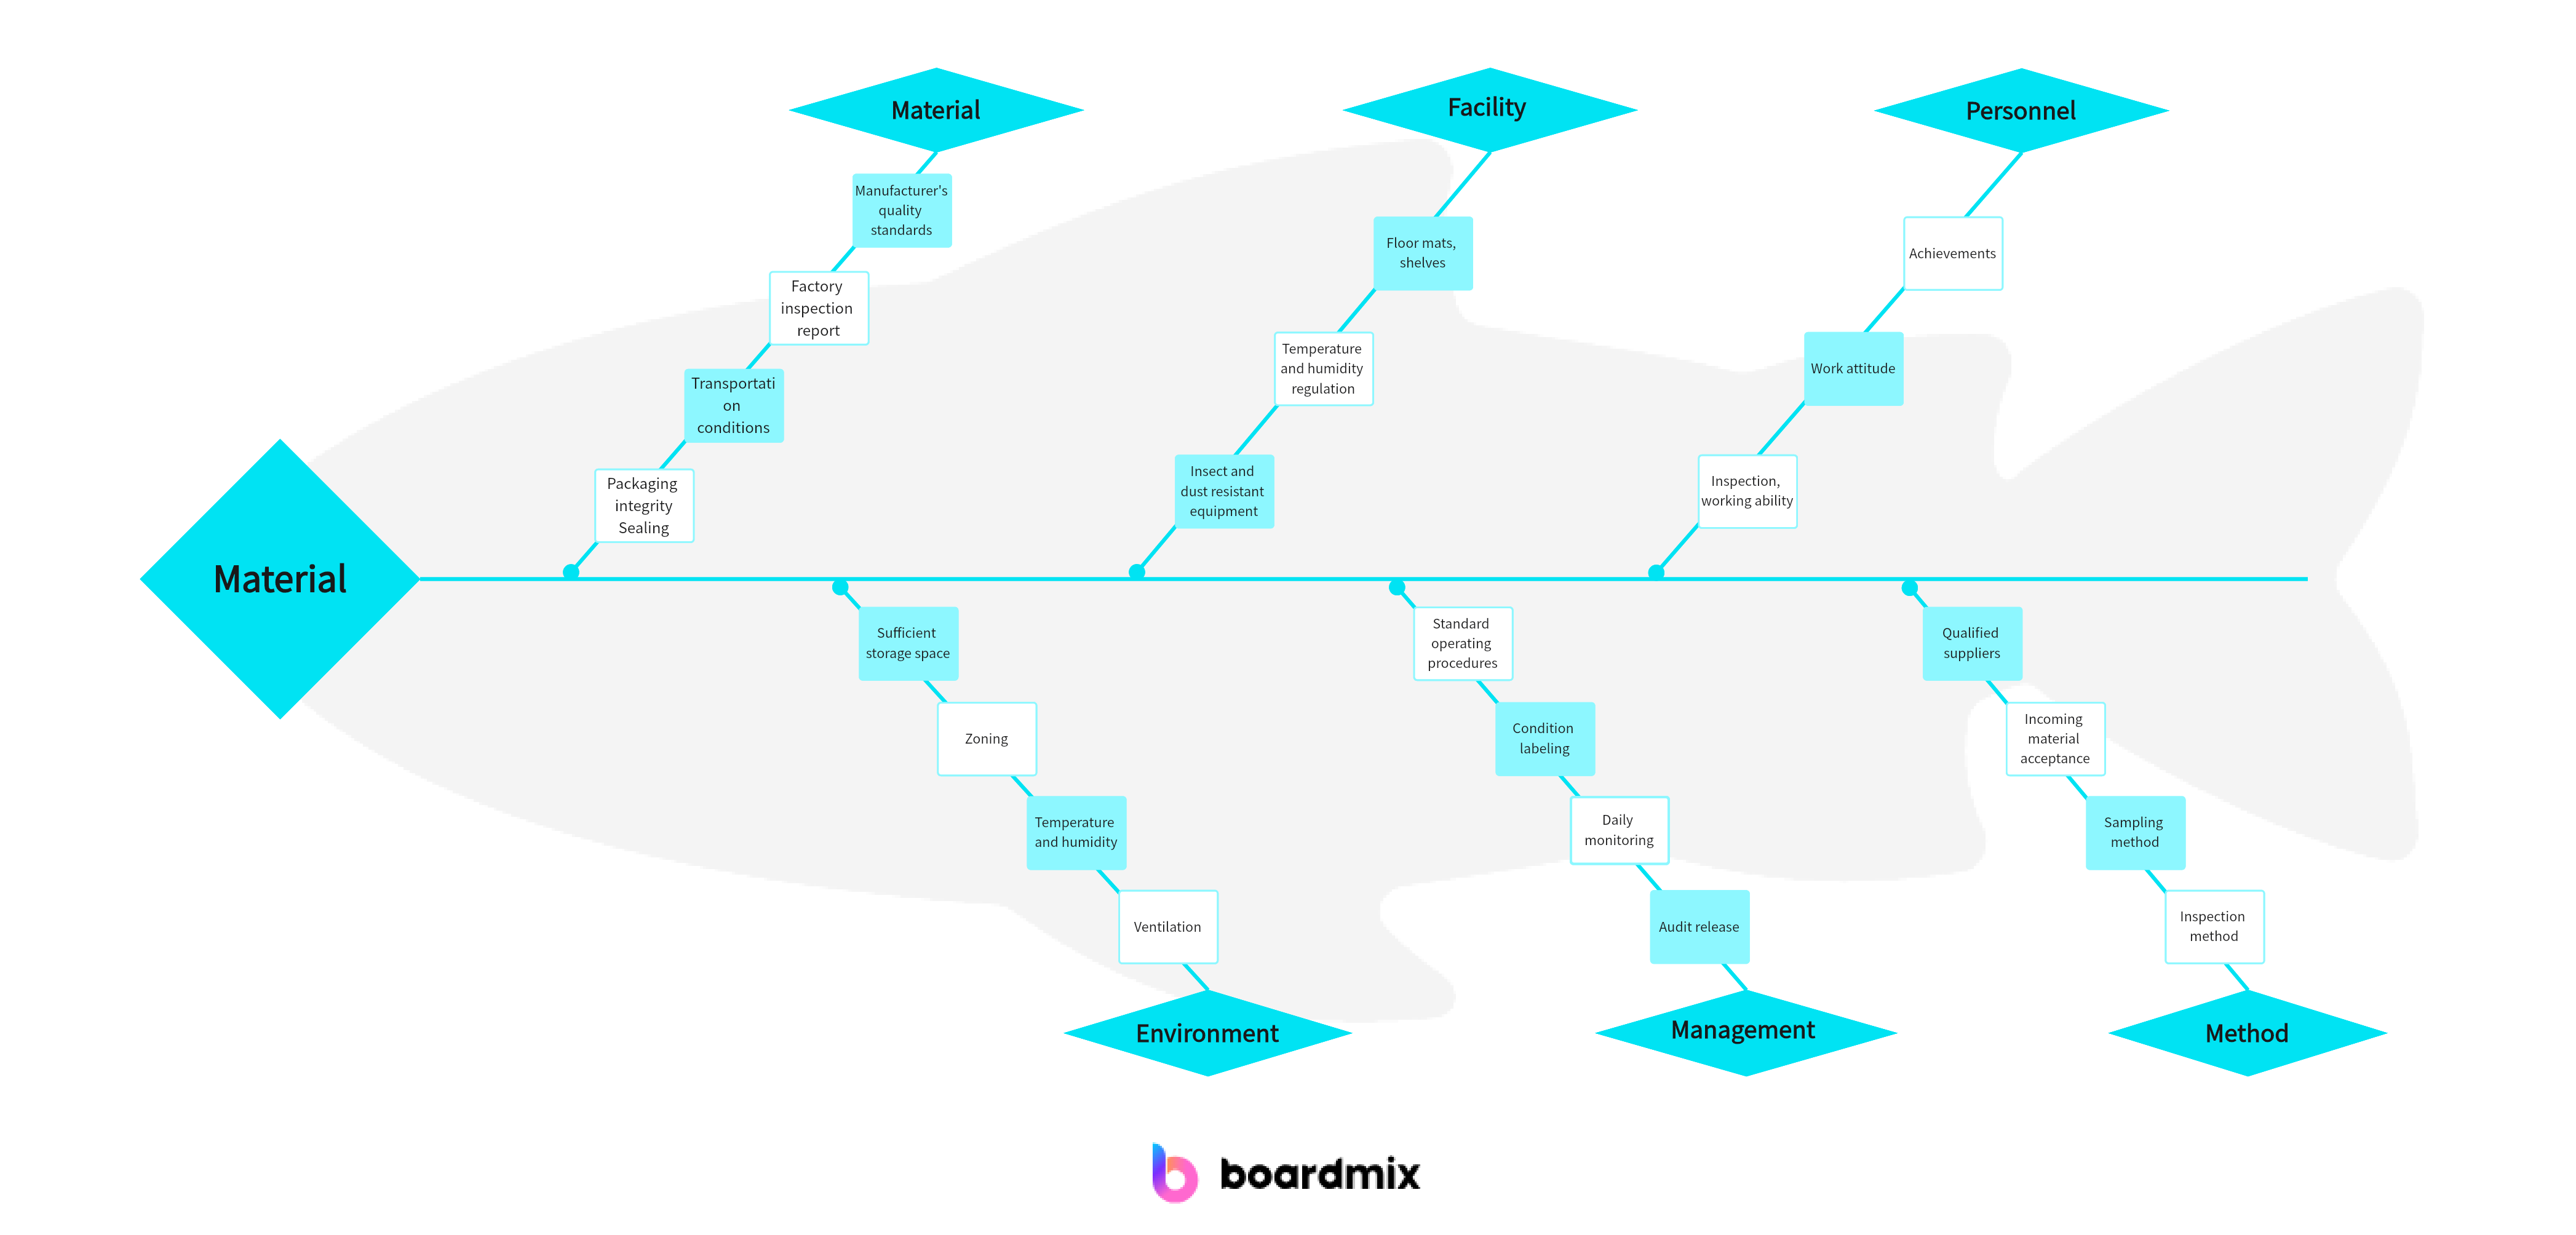
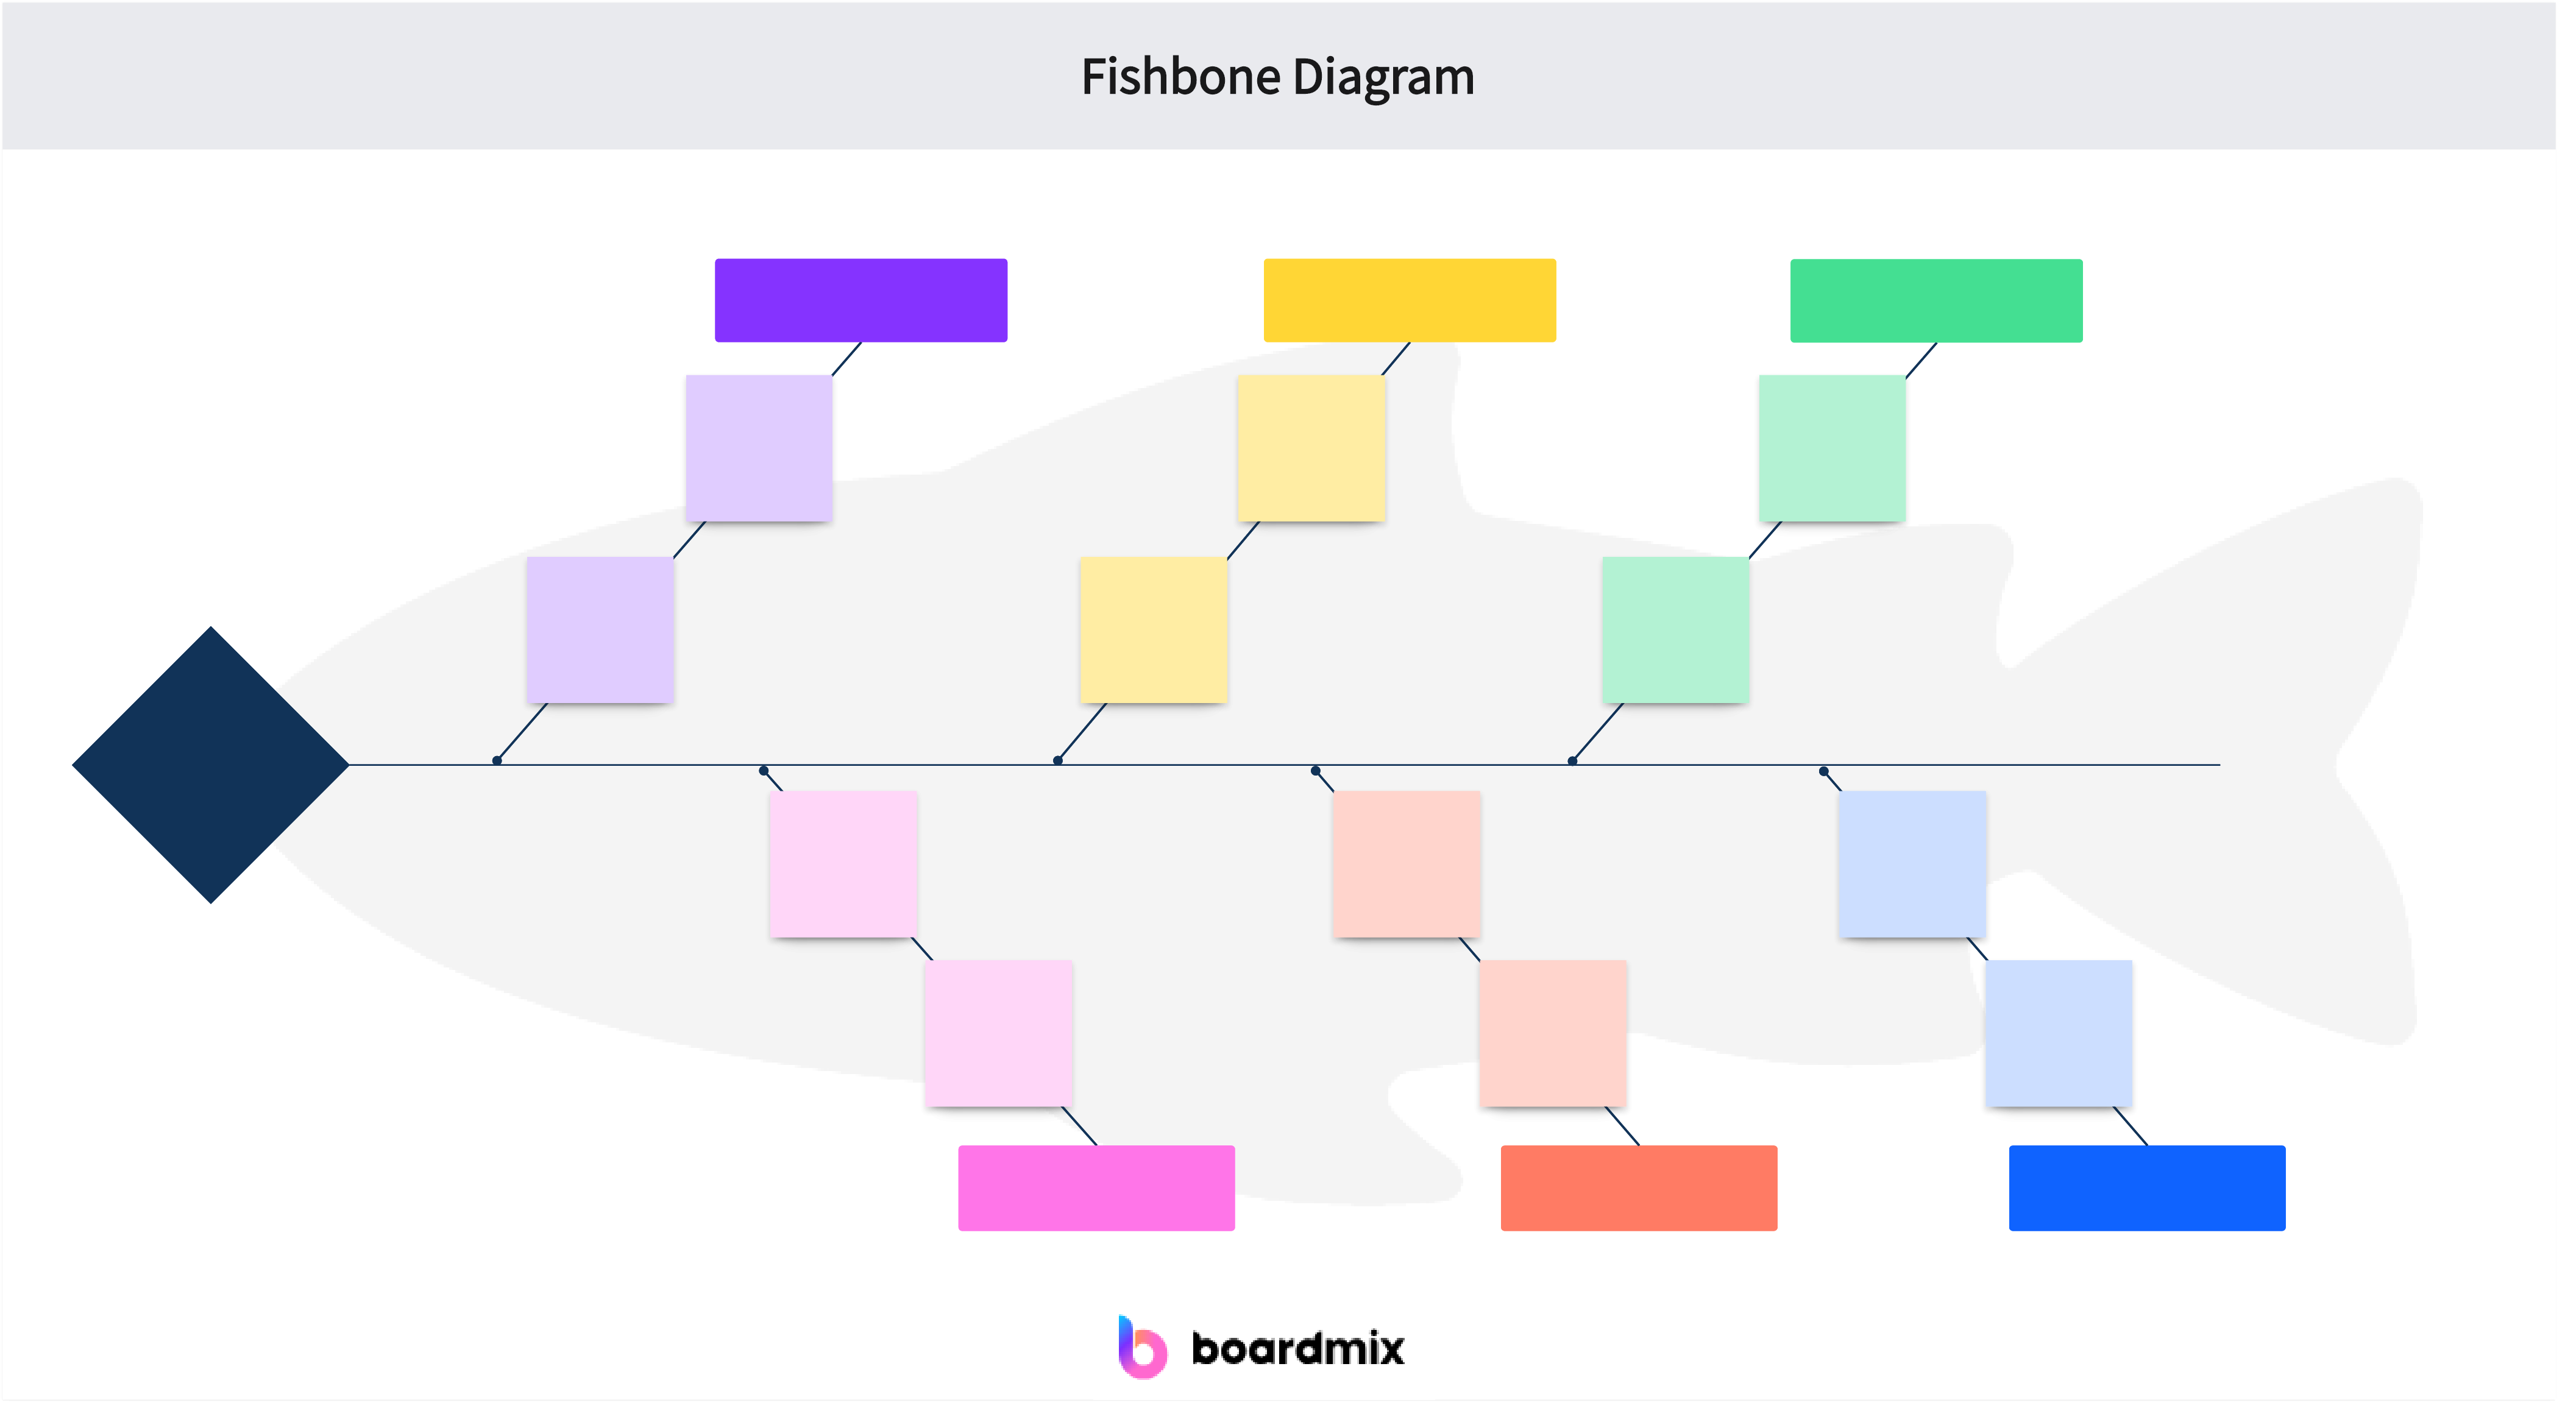
A fishbone diagram, also known as Ishikawa or cause-and-effect diagram, is a visual representation that helps identify the root causes of a problem. It resembles the skeleton of a fish, with the problem at the head and the potential causes branching off like fishbones. This method is widely used in various industries for problem-solving and process improvement. Its visual nature facilitates a systematic analysis of factors contributing to an issue, making it an invaluable tool for teams striving to enhance efficiency and quality.
Part 2: Criteria for selection of the top 10 fishbone diagram maker online
Choosing the right fishbone diagram maker is crucial for effective problem-solving. The criteria for selecting the top 10 online tools include user-friendliness, collaborative features, customization options, integration capabilities, and overall functionality. A user-friendly interface ensures accessibility for all team members, while collaborative features promote effective teamwork. Customization options allow tailoring the diagrams to specific needs, and integration capabilities enable seamless collaboration with other project management tools.
Part 3: Top 10 fishbone diagram maker online
When looking for a fishbone diagram maker online, there are several options available. Here are the top 10 fishbone diagram makers along with their features, pros, and cons:
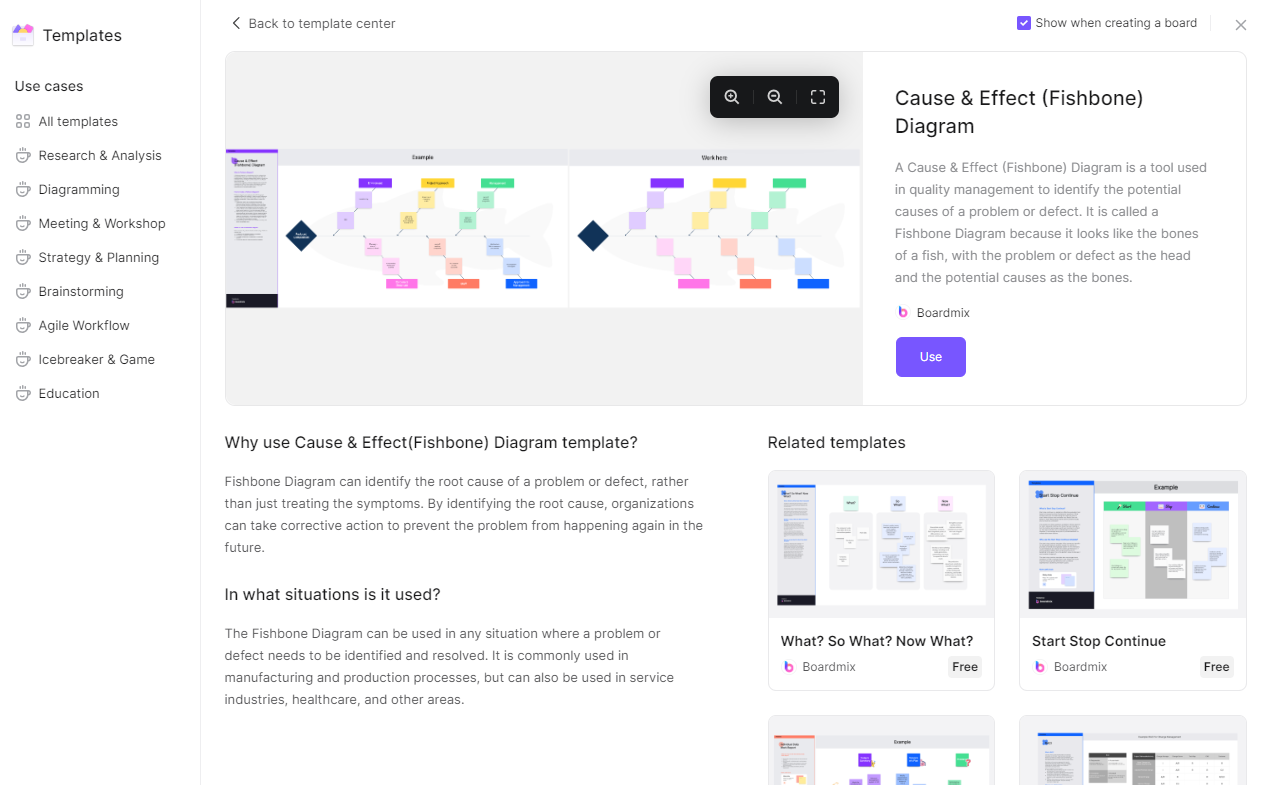
1. Boardmix
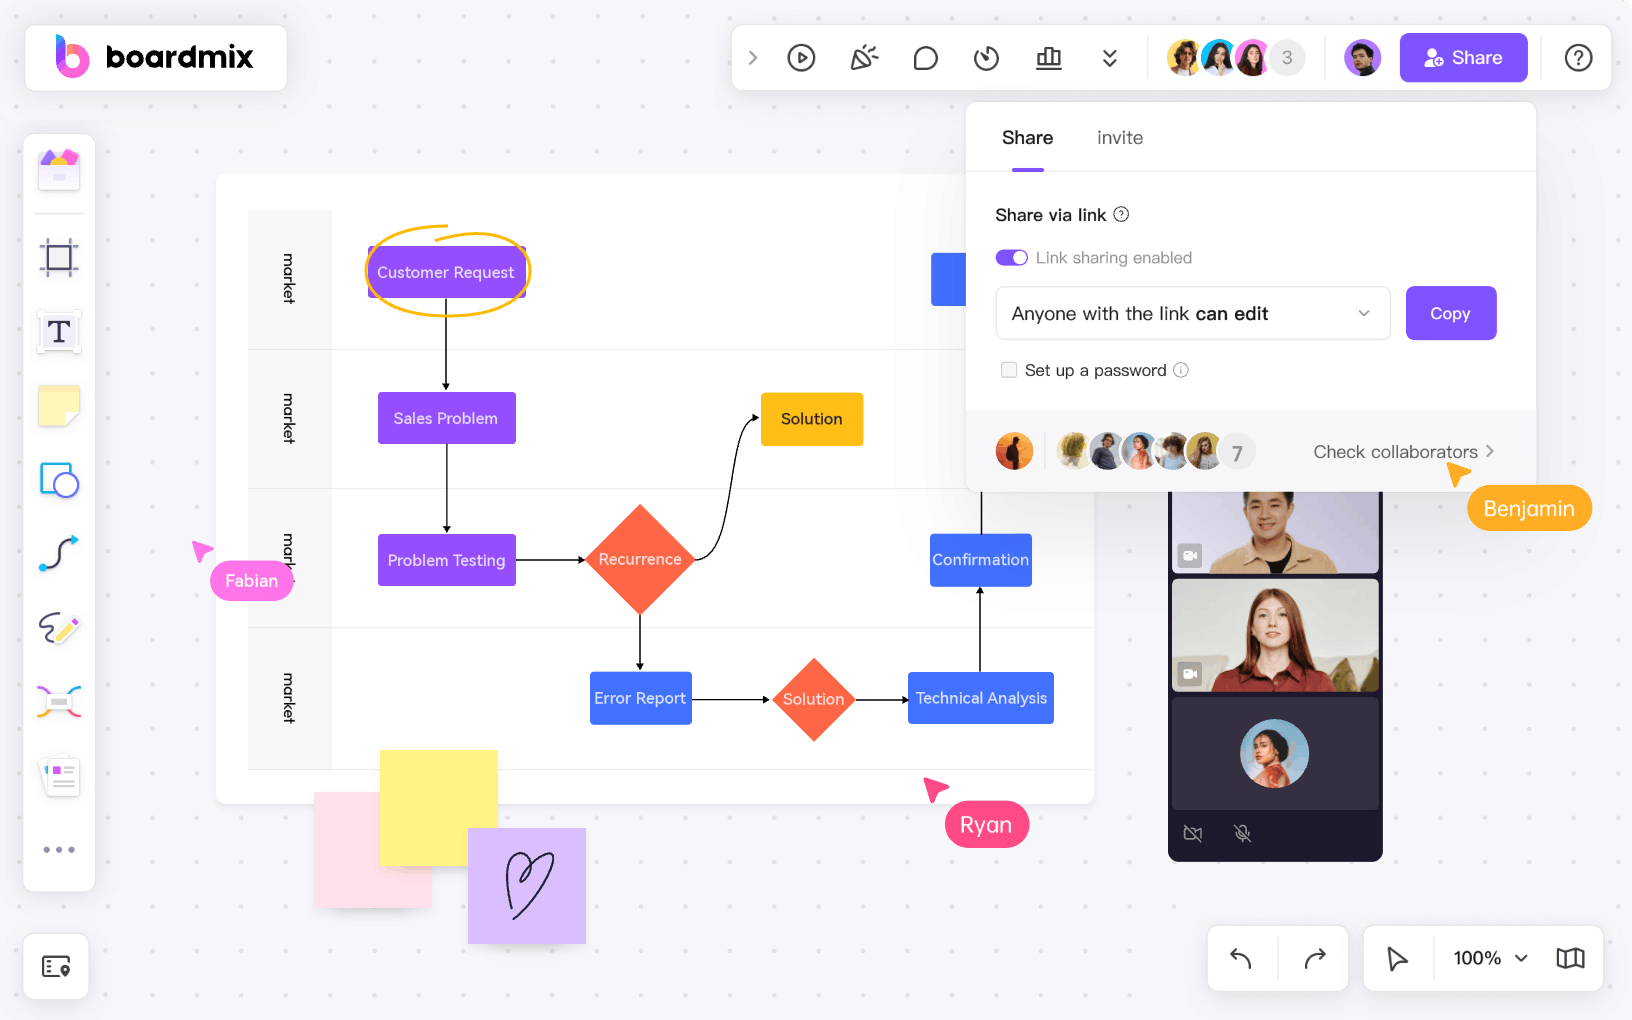
Feature: Provides AI-powered online whiteboard that facilitates quick and efficient diagram creation. Its collaborative editing capabilities and real-time updates ensure seamless teamwork.
Pros: Intuitive and drag-and-drop interface, AI-powered feature, cloud-based, extensive customization options, integration with popular platforms, extensive shape library, easy import/export options,
Cons: Limited free version, advanced features may require a subscription.
2. Lucidchart
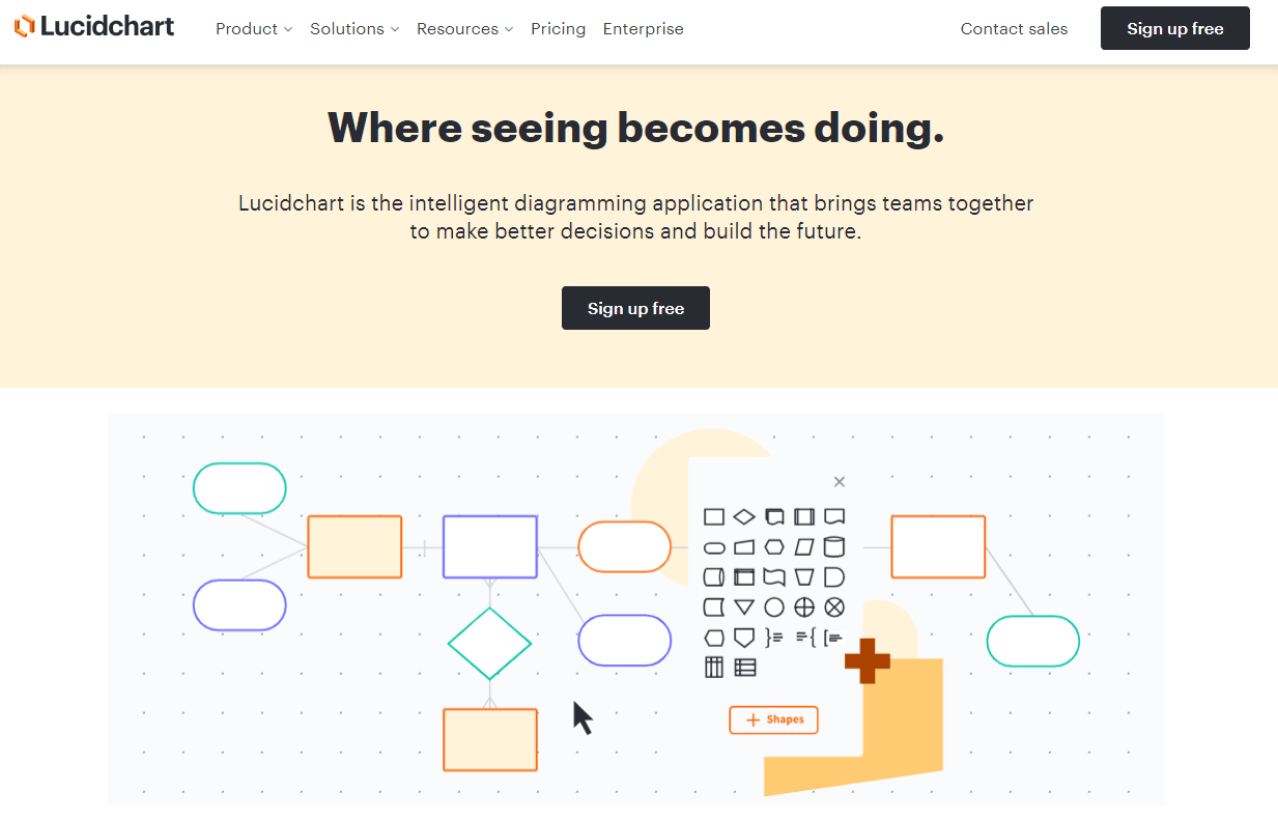
Features: Offers a wide range of diagram templates, collaborative editing, and integration with other tools.
Pros: User-friendly, easy sharing and collaboration, extensive shape library,
Cons: Some advanced features require a paid subscription.
3. Canva
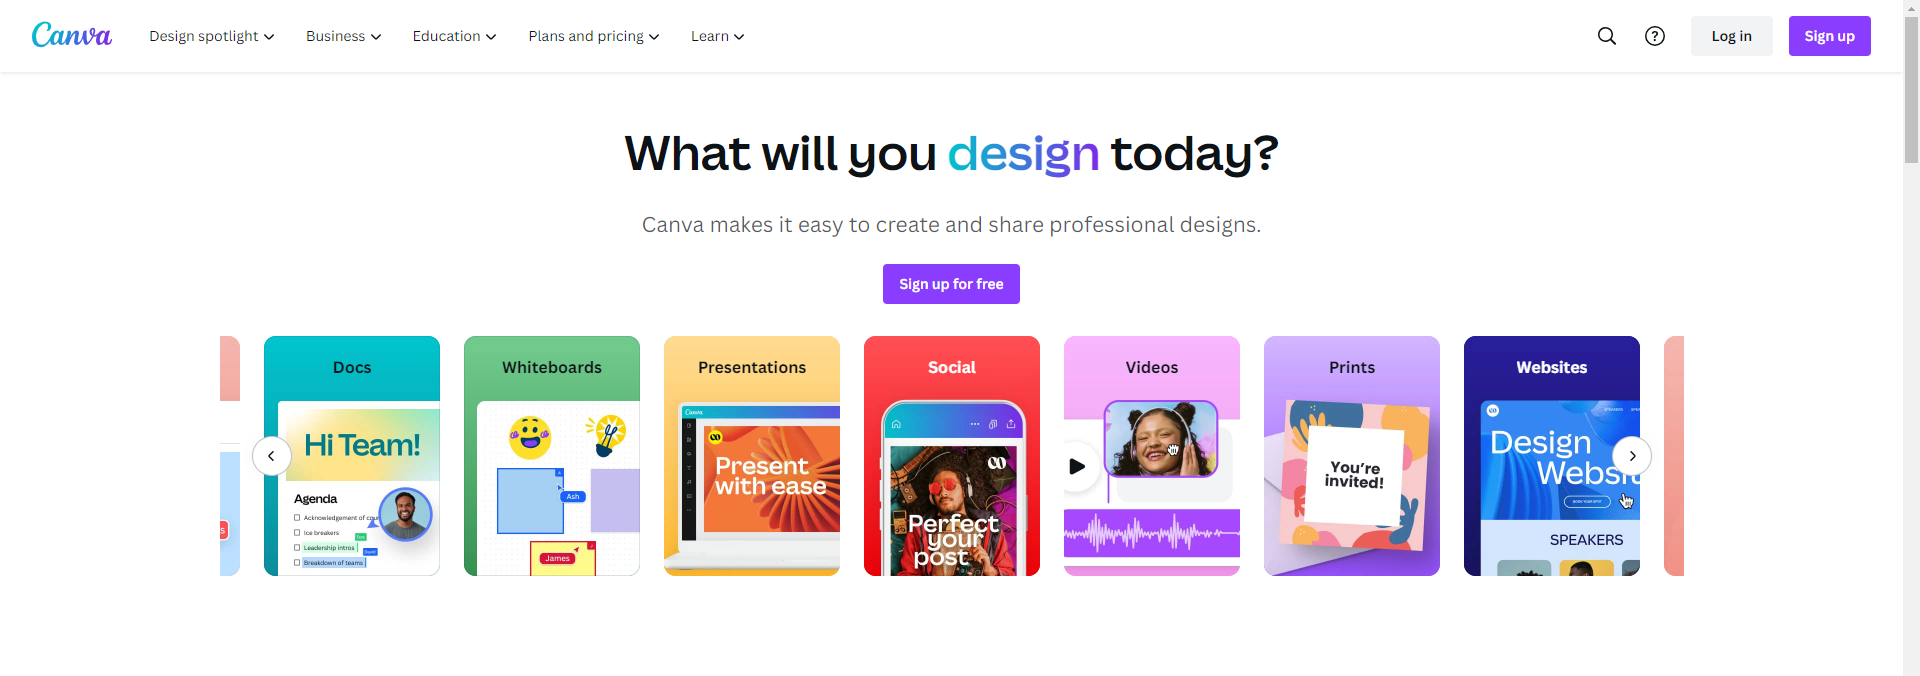
Features: Provides customizable templates, drag-and-drop interface, and a wide selection of design elements.
Pros: User-friendly interface, free version available, great for visual design.
Cons: Limited customization options for diagram elements.
4. Creately
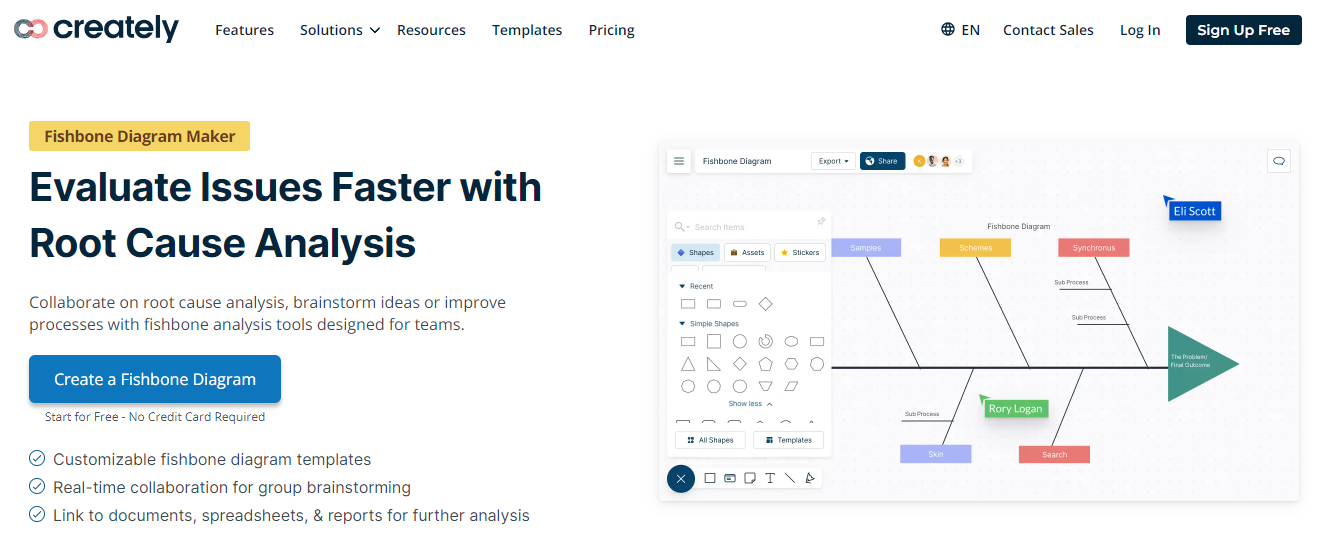
Features: Offers a variety of templates and shapes, real-time collaboration, and integration with popular platforms.
Pros: User-friendly interface, extensive library of shapes and icons, great for team collaboration.
Cons: The free version has limited functionality.
5. SmartDraw
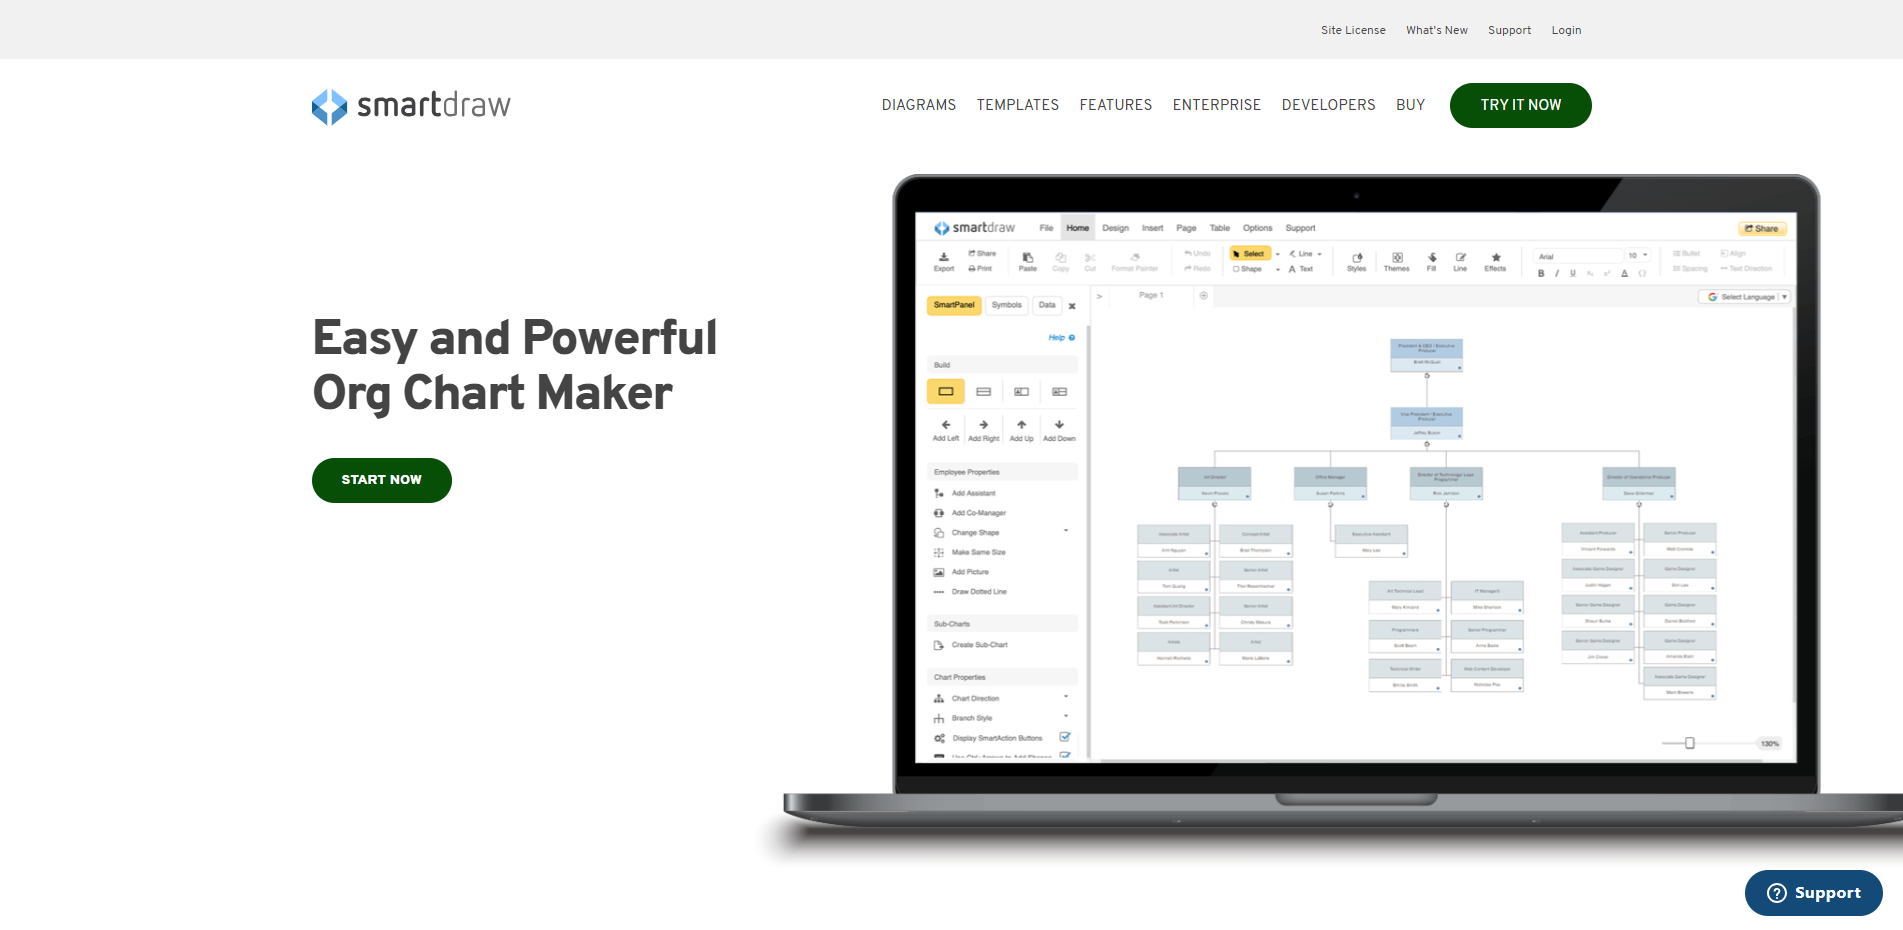
Features: Provides a vast collection of templates, automated formatting, and integration with Microsoft Office.
Pros: Easy to use, extensive template library, great for creating professional diagrams.
Cons: Expensive subscription plans.
6. Draw.io

Features: Offers a simple and intuitive interface, easy import/export options, and real-time collaboration.
Pros: Free to use, no account required, supports multiple file formats.
Cons: Limited template library.
7. Mindomo
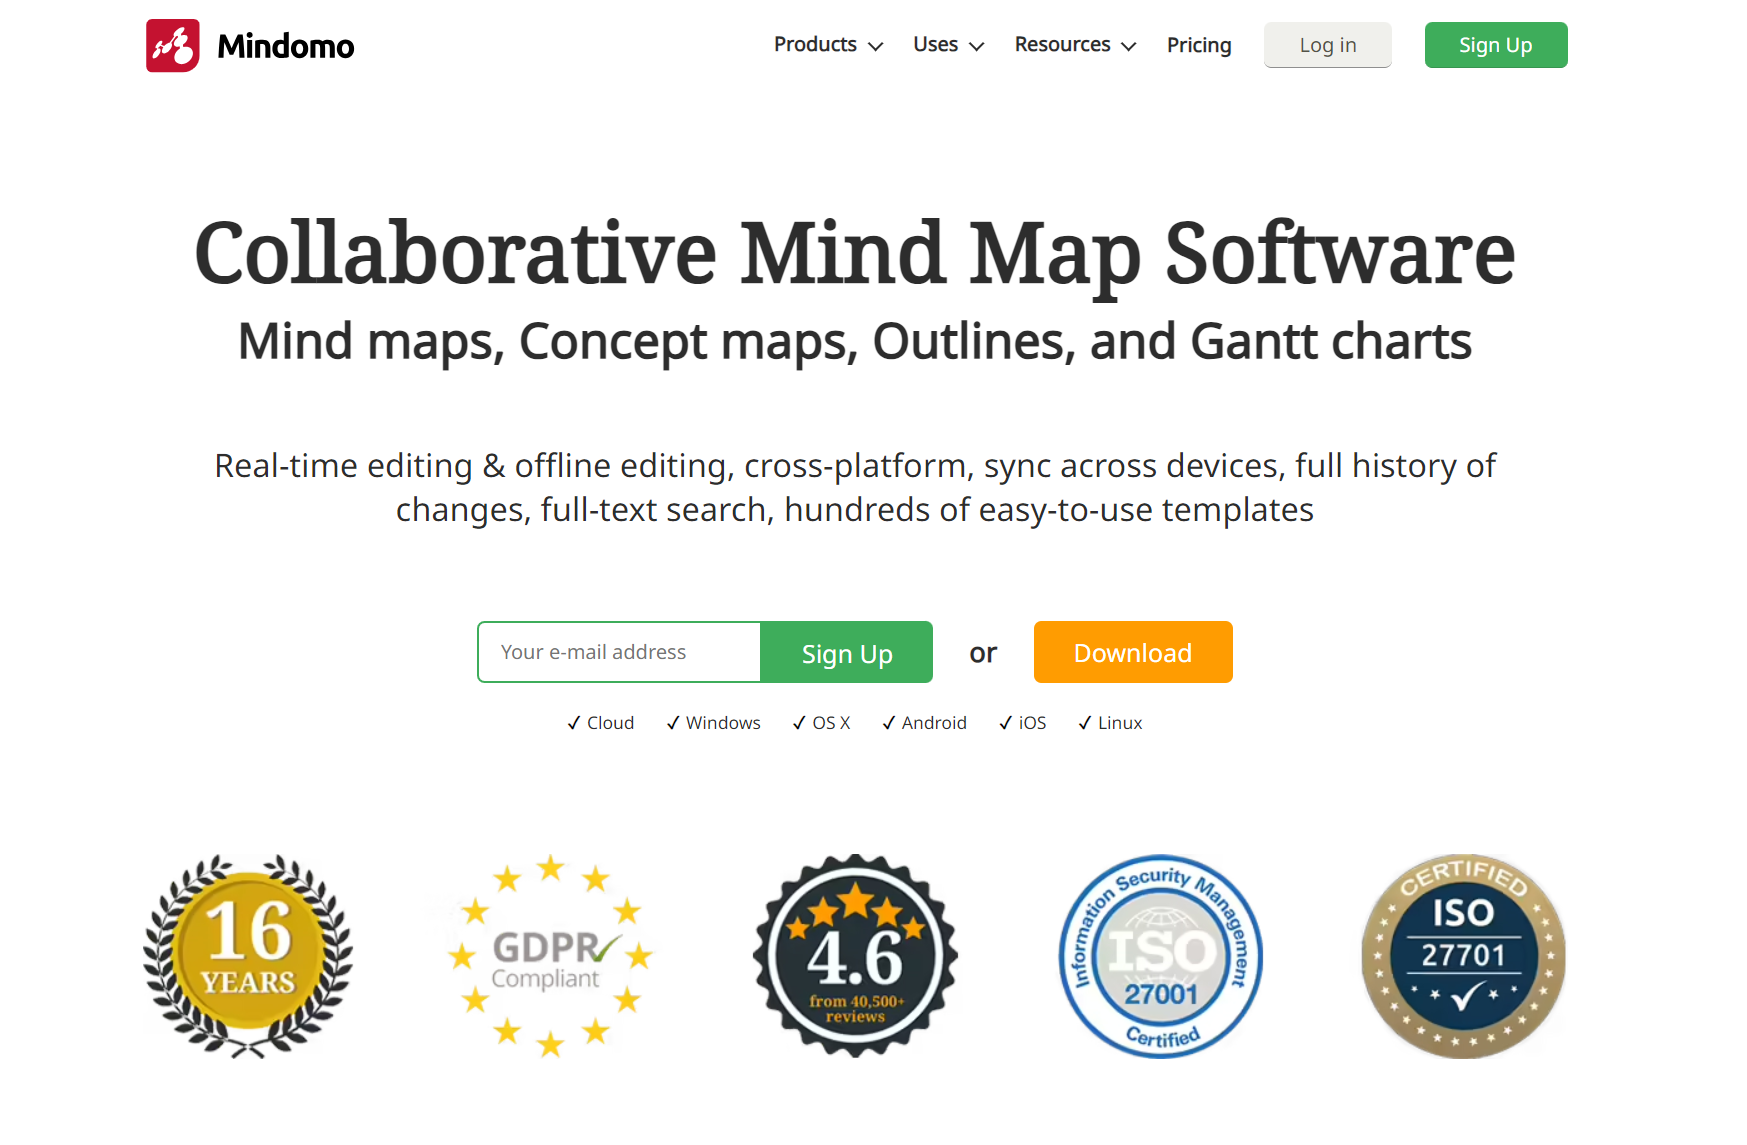
Features: Offers mind mapping and diagramming capabilities, real-time collaboration, and integration with other tools.
Pros: User-friendly interface, supports various diagram types, great for brainstorming.
Cons: Limited customization options for diagram elements.
8. Cacoo
Features: Provides real-time collaboration, extensive shape library, and integration with popular platforms.
Pros: User-friendly interface, great for team collaboration, supports multiple languages.
Cons: The free version has limited functionality.
9. EdrawMax
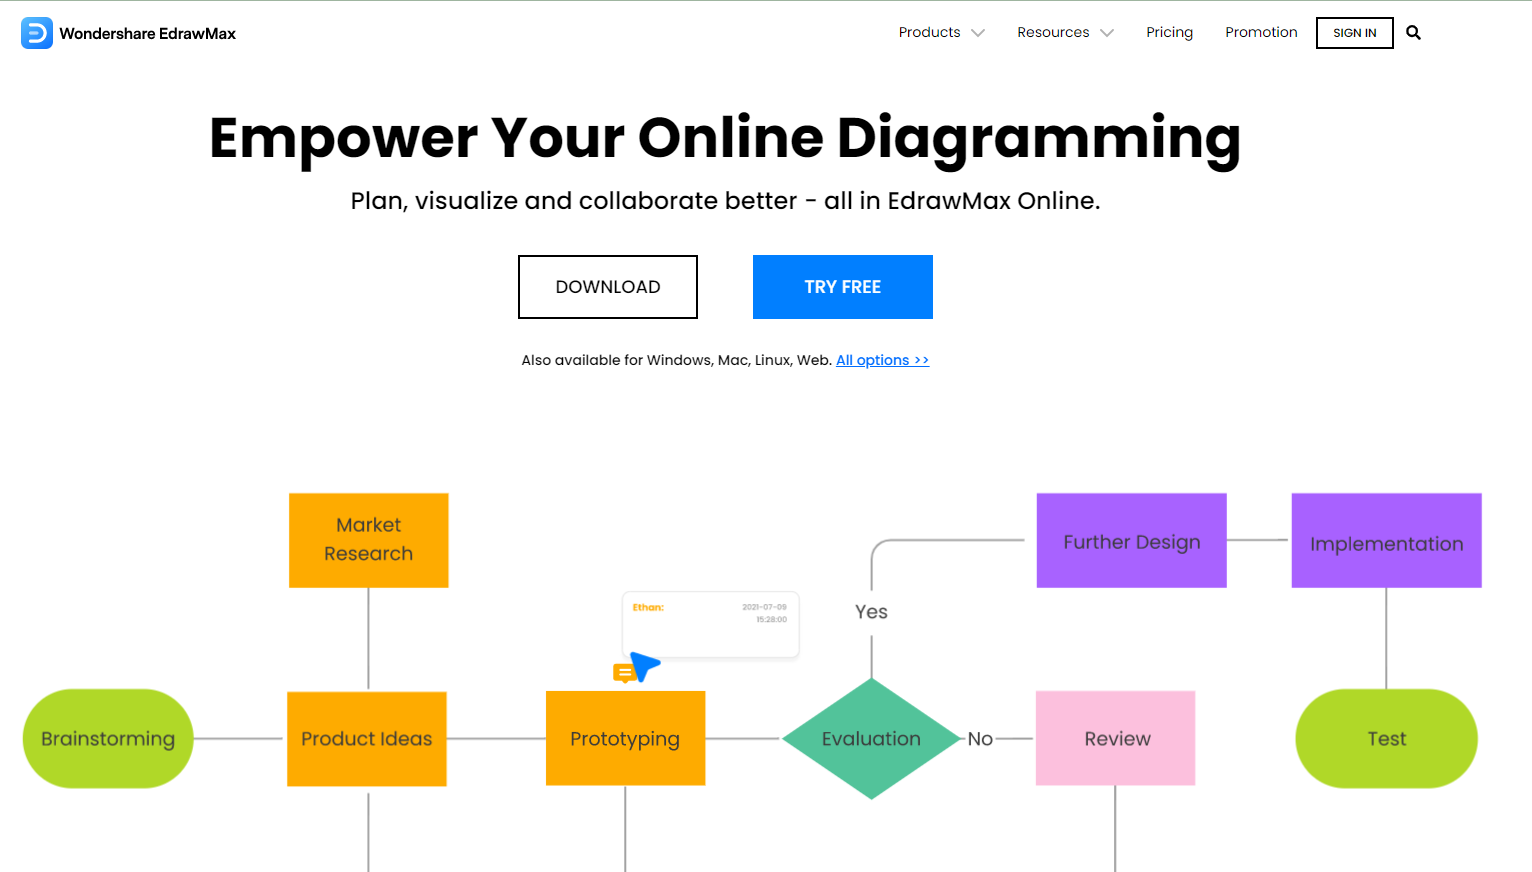
Features: Offers a wide range of diagram templates and shapes, a drag-and-drop interface, and extensive customization options.
Pros: Professional-looking diagrams, advanced formatting options, great for various diagram types.
Cons: Expensive subscription plans.
10. MindManager
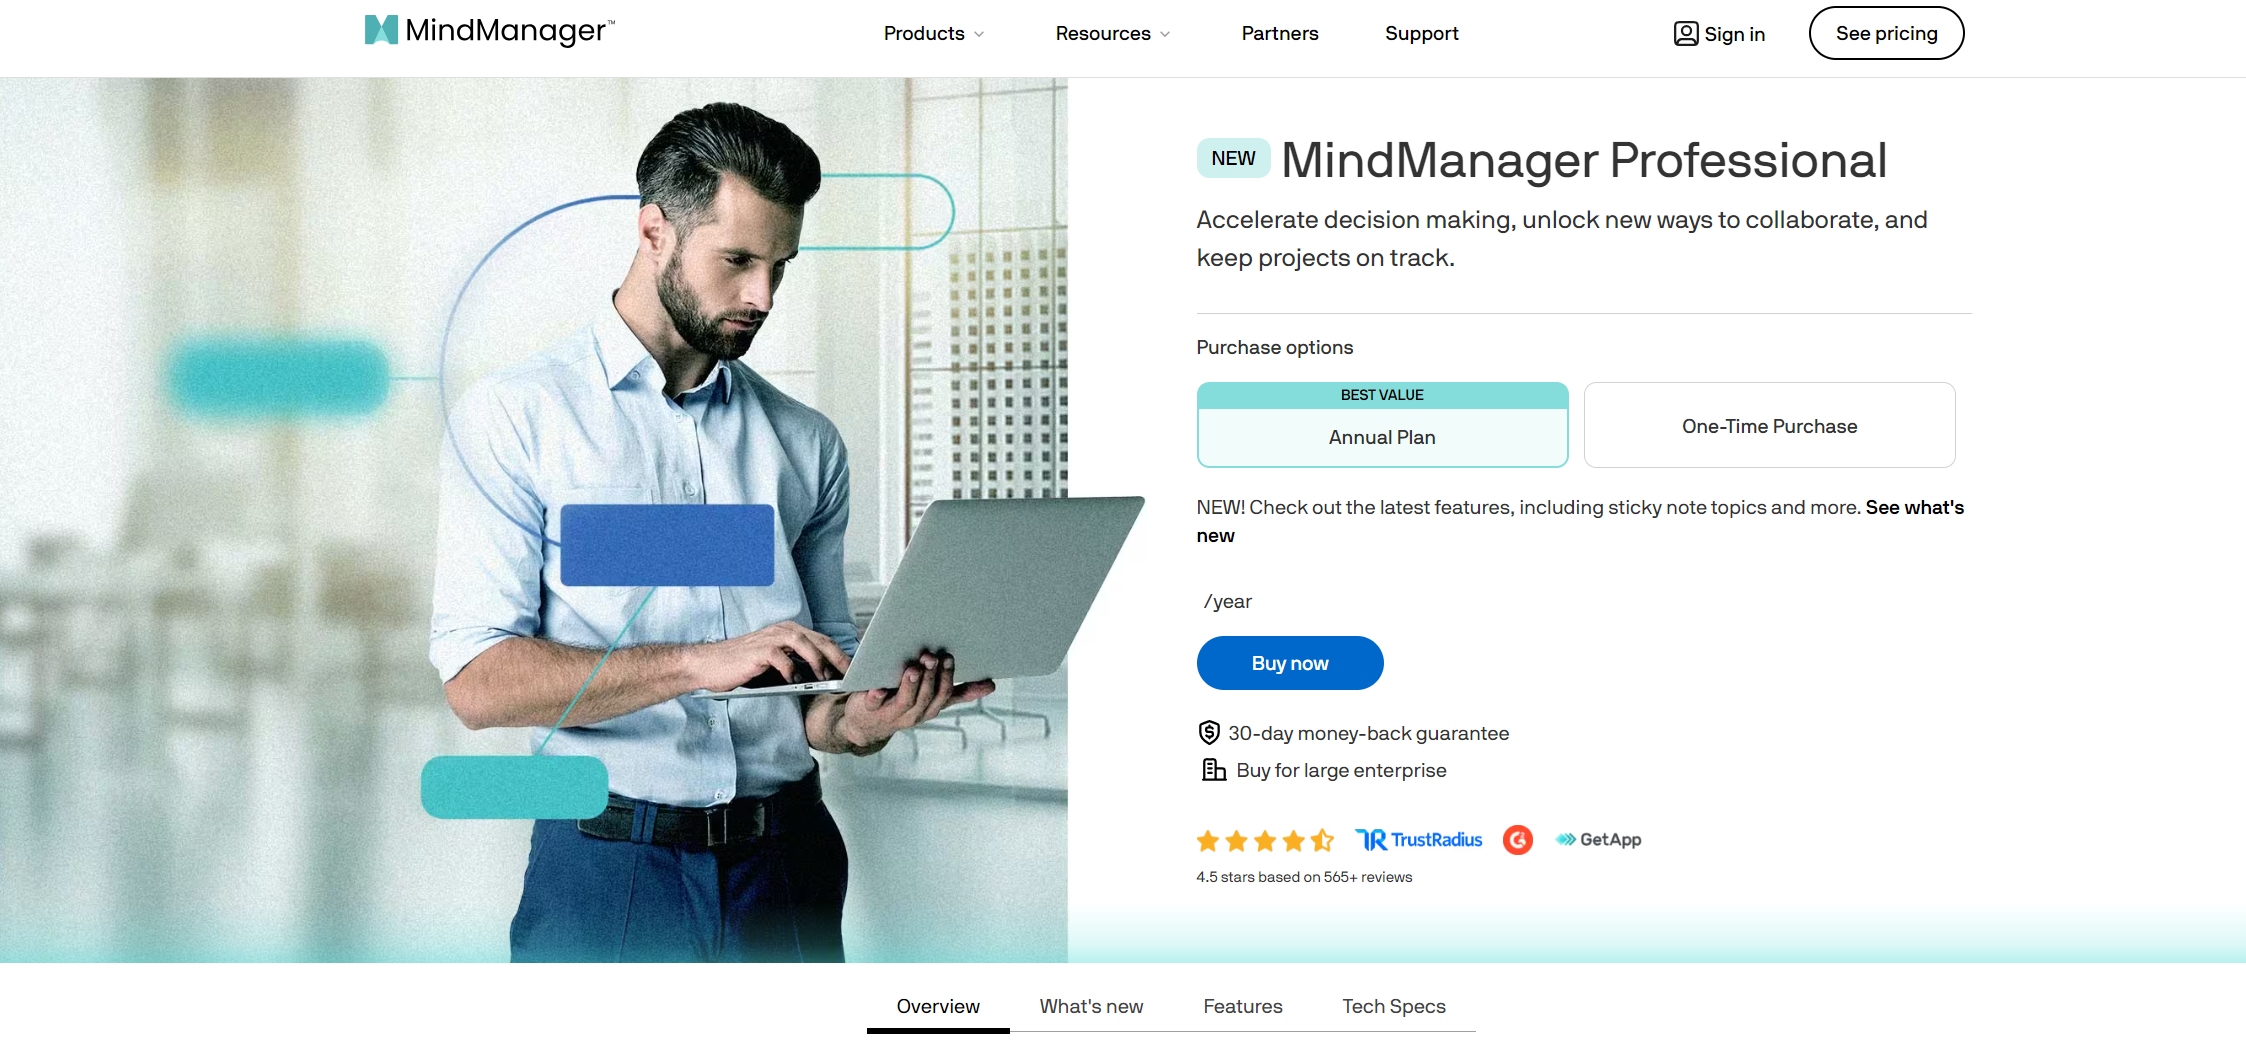
Features: Provides mind mapping and diagramming capabilities, integration with Microsoft Office, and advanced presentation options.
Pros: Comprehensive mind mapping features, great for project management, supports various platforms.
Cons: Expensive subscription plans.
These are just a few of the top fishbone diagram makers available online. Consider your specific needs and preferences when choosing the most suitable option for your requirements.
Part 4. How to choose the right fishbone diagram maker?
As we explored the top 10 fishbone diagram makers, it became evident that selecting the right tool is pivotal for effective problem-solving. The criteria we considered - user-friendliness, collaborative features, customization options, integration capabilities, and overall functionality - provide a comprehensive framework for evaluation.
Each tool has its strengths and weaknesses. Lucidchart, Canva, Creately, SmartDraw, Draw.io, Mindomo, Cacoo, EdrawMax, and MindManager all offer unique features, that cater to specific needs. Lucidchart, for instance, provides a wide range of diagram templates, while Canva excels in visual design. Draw.io stands out for its simplicity and free-to-use model, appealing to users with budget considerations.
Among the distinguished fishbone diagram makers, Boardmix emerged as a standout choice. Its intuitive interface, AI-powered features, and seamless collaboration capabilities set it apart. The cloud-based platform not only facilitates quick and efficient diagram creation but also fosters real-time updates, ensuring teams work collaboratively with the latest information.
Part 5. How to use fishbone diagrams?
Fishbone diagrams can be effectively used to enhance problem-solving and decision-making processes in the following steps.
- Define the problem: Clearly define the problem or outcome you want to address. This will serve as the main issue for analysis.
- Identify categories: Identify the major categories or branches that are relevant to the problem. Common categories include people, processes, materials, machinery, measurement, and environment. Choose categories based on the nature of the problem.
- Brainstorm causes: Gather a team of individuals with different perspectives and expertise. Conduct a brainstorming session to identify potential causes within each category. Encourage participants to think broadly and consider all possible factors.
- Analyze causes: Once potential causes are identified, analyze each cause by asking "why" repeatedly. This helps in identifying the root cause of the problem. Use the fishbone diagram to visually represent the causes and their relationships.
- Determine the root cause: By analyzing the causes and their interrelationships, determine the root cause or causes of the problem. The root cause is the underlying factor that directly contributes to the problem.
- Validate and prioritize: Validate the identified root cause(s) by gathering data or evidence to support your analysis. Prioritize the root causes based on their impact and importance to the problem.
- Generate solutions: Based on the identified root causes, generate potential solutions or actions that address each cause. These solutions should aim to eliminate or mitigate the root causes of the problem.
- Implement and monitor: Implement the selected solutions and monitor their effectiveness. Evaluate whether the solutions effectively address the root causes and improve the problem or outcome.
- Continuous improvement: Use the insights gained from the fishbone diagram analysis to continuously improve your processes and prevent similar problems in the future. Regularly review and update your fishbone diagram to reflect any changes or improvements made.
Remember, fishbone diagrams are not a standalone solution but a tool to facilitate problem-solving and decision-making processes. They provide a visual framework that encourages structured analysis and collaboration among team members. By using fishbone diagrams effectively, you can enhance your problem-solving capabilities and make informed decisions.
Conclusion
As you embark on the journey of selecting the ideal fishbone diagram maker, consider your team's specific needs, budget constraints, and desired functionality. Explore the features of each tool and leverage trial or free versions before committing to a subscription. The combination of Boardmix in user-friendliness, collaboration prowess, and integration capabilities positions it as a top recommendation, but the ultimate choice should align with your team's unique requirements. Whether it's intuitive interfaces, extensive customization options, or seamless integration, the right fishbone diagram maker will empower your team in its quest for efficient problem-solving and process improvement.


