


Visual representation of data is crucial in today's fast-paced and information-rich world. Among various visualization forms, the pie chart stands as one of the simplest yet most powerful tools. It gives viewers an immediate grasp of proportions and divisions within a dataset. This article dives deep into the concept of pie charts, the method of creating them in Microsoft Word, and its advantages and disadvantages. Keep reading.
What Is a Pie Chart
A pie chart, also known as a circle chart, represents data in the form of a circle divided into various segments or 'slices'. Each slice signifies a proportion of the whole, symbolizing a numerical contribution towards a total quantity or sum. The larger the slice, the bigger its share of the whole.
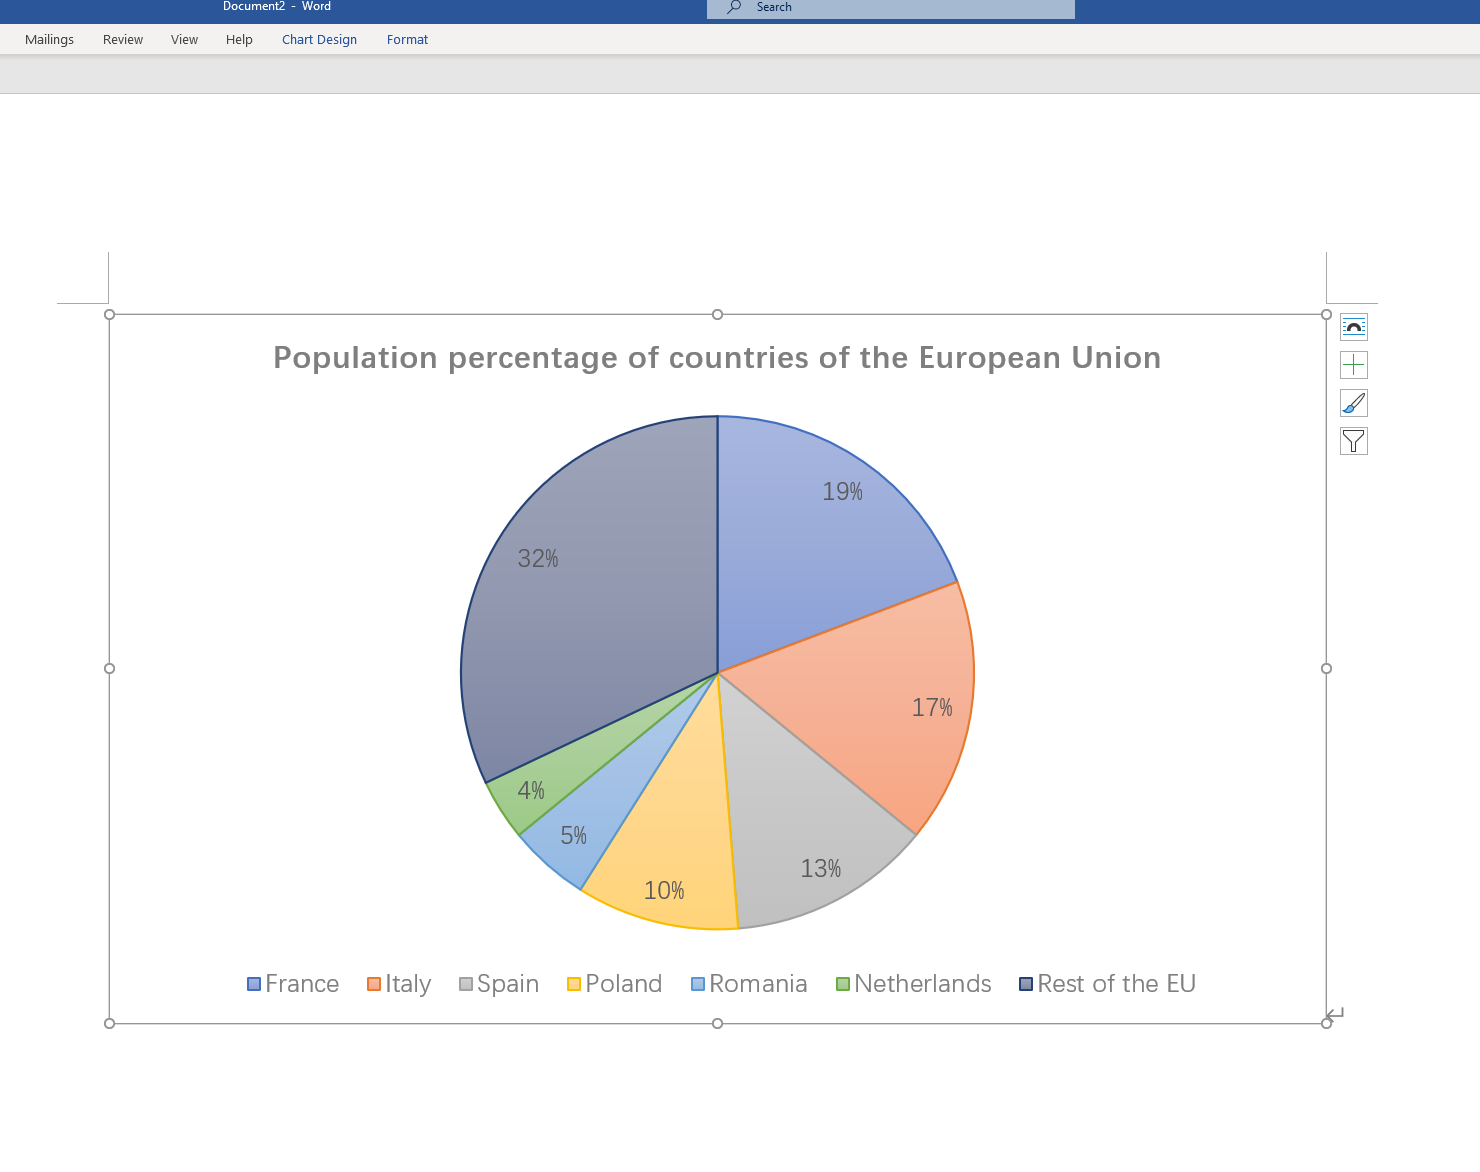
Pie charts are primarily used when data can be represented in percentage form or when there is a clear whole comprised of several components. They are popular due to their simplicity, immediate impact, and their capability to visually communicate complex data points.
How to Create a Pie Chart in Microsoft Word
Microsoft Word is not the first tool that comes to mind for creating pie charts; however, it has the necessary features to make decent basic pie charts. Here's a simple step-by-step guide:
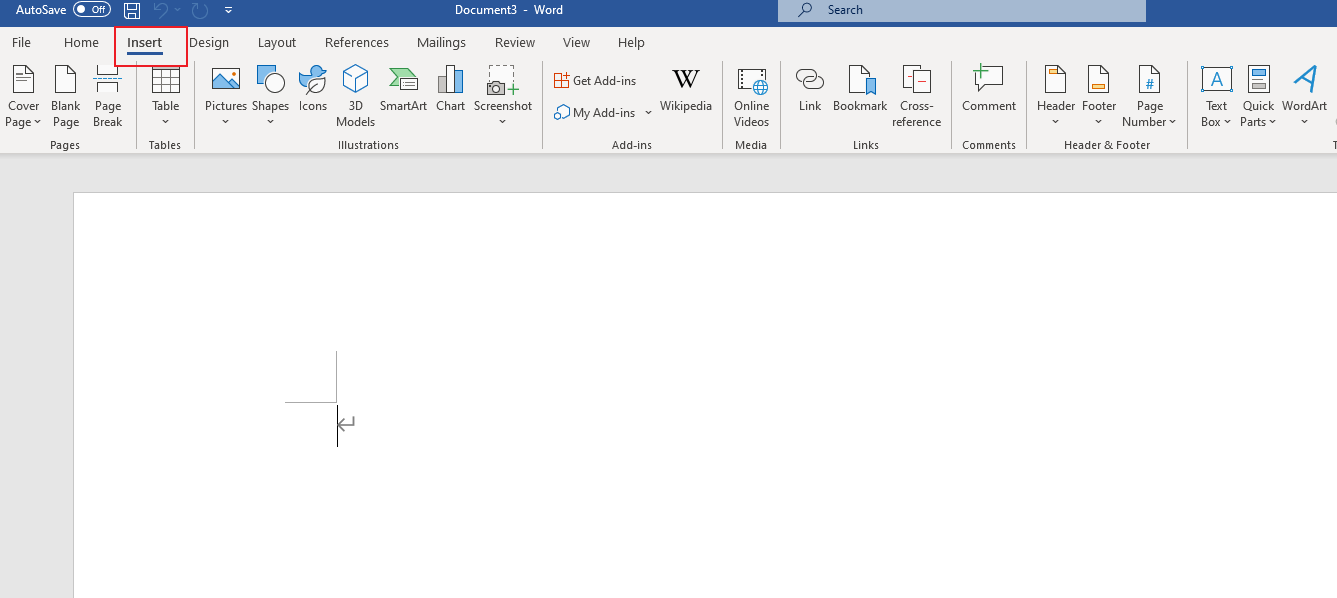
Step 1: Open Microsoft Word and navigate to the 'Insert' tab.
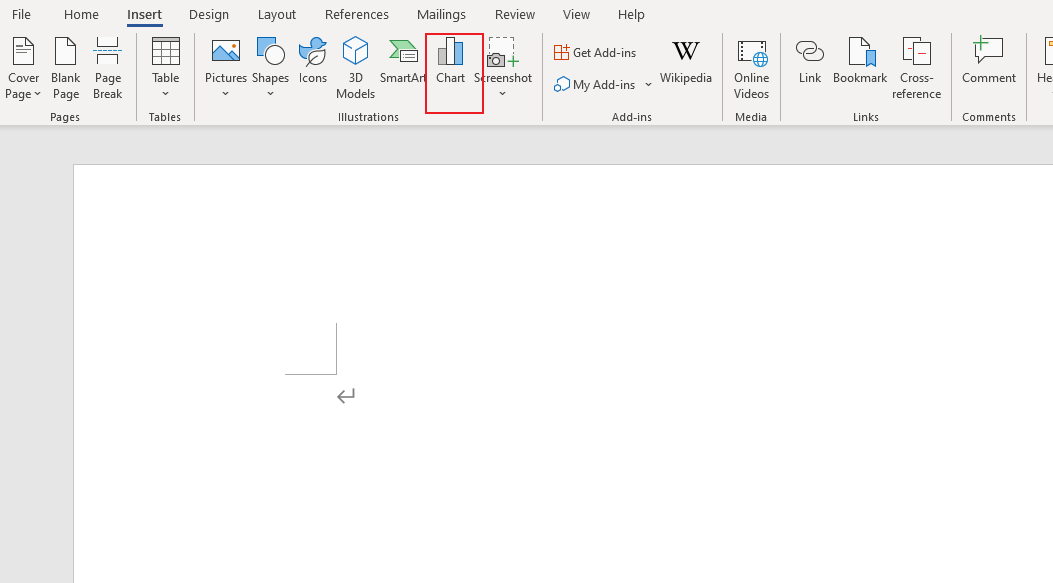
Step 2: Click on 'Chart' in the Illustrations group.
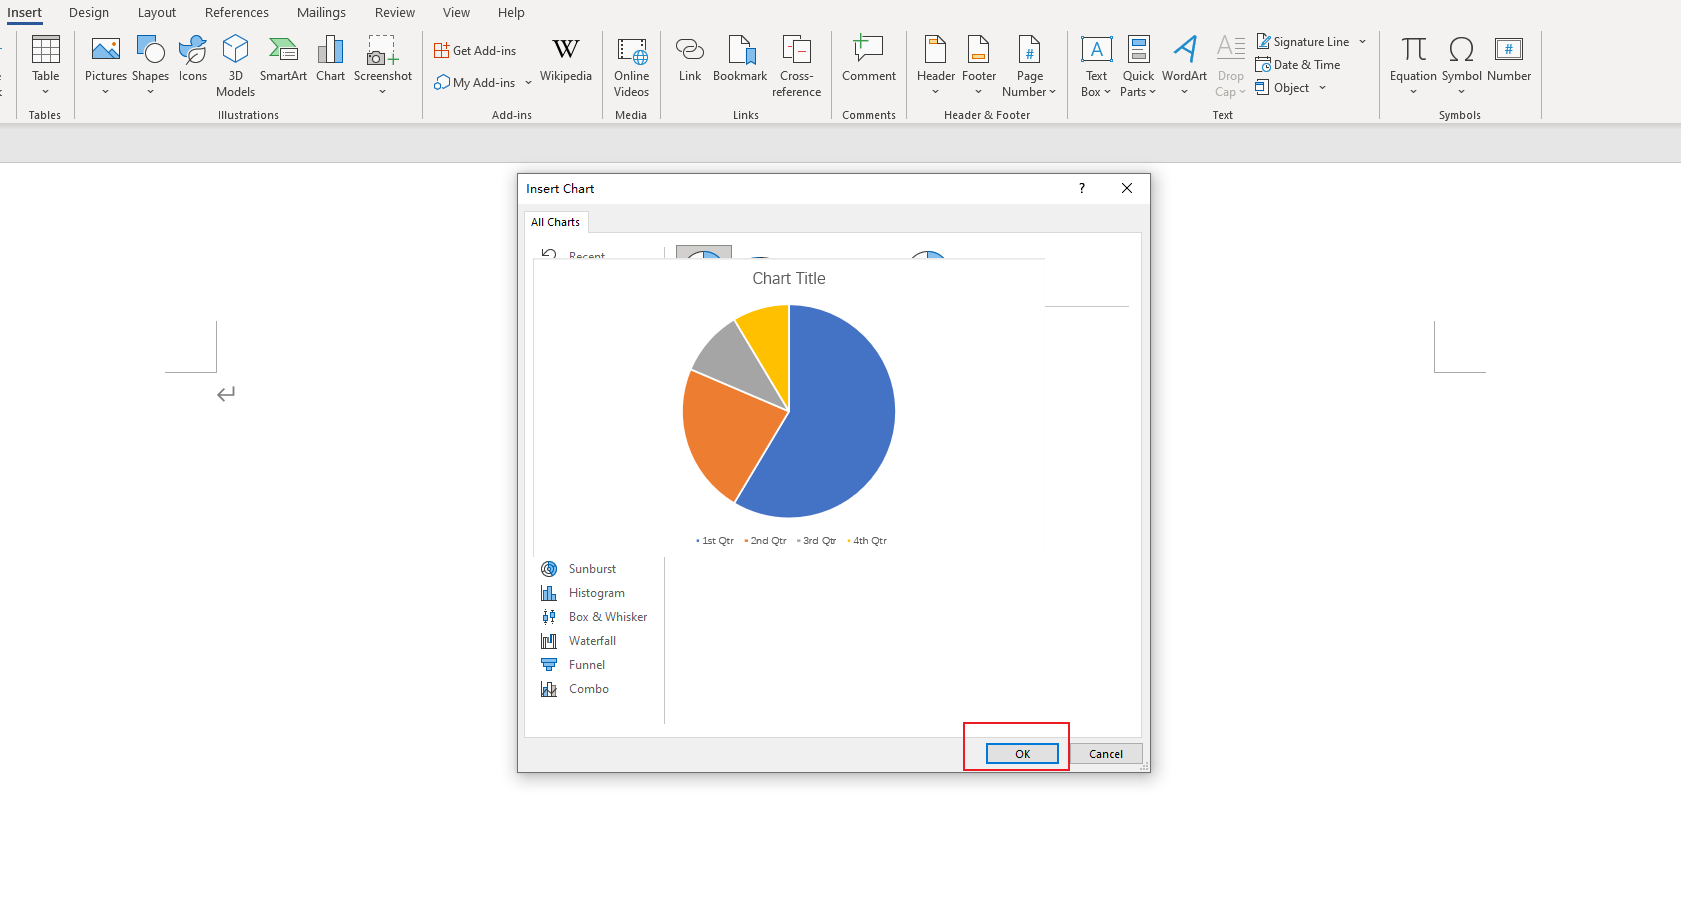
Step 3: In the 'Insert Chart' dialog box that appears, click 'Pie' in the list on the left.
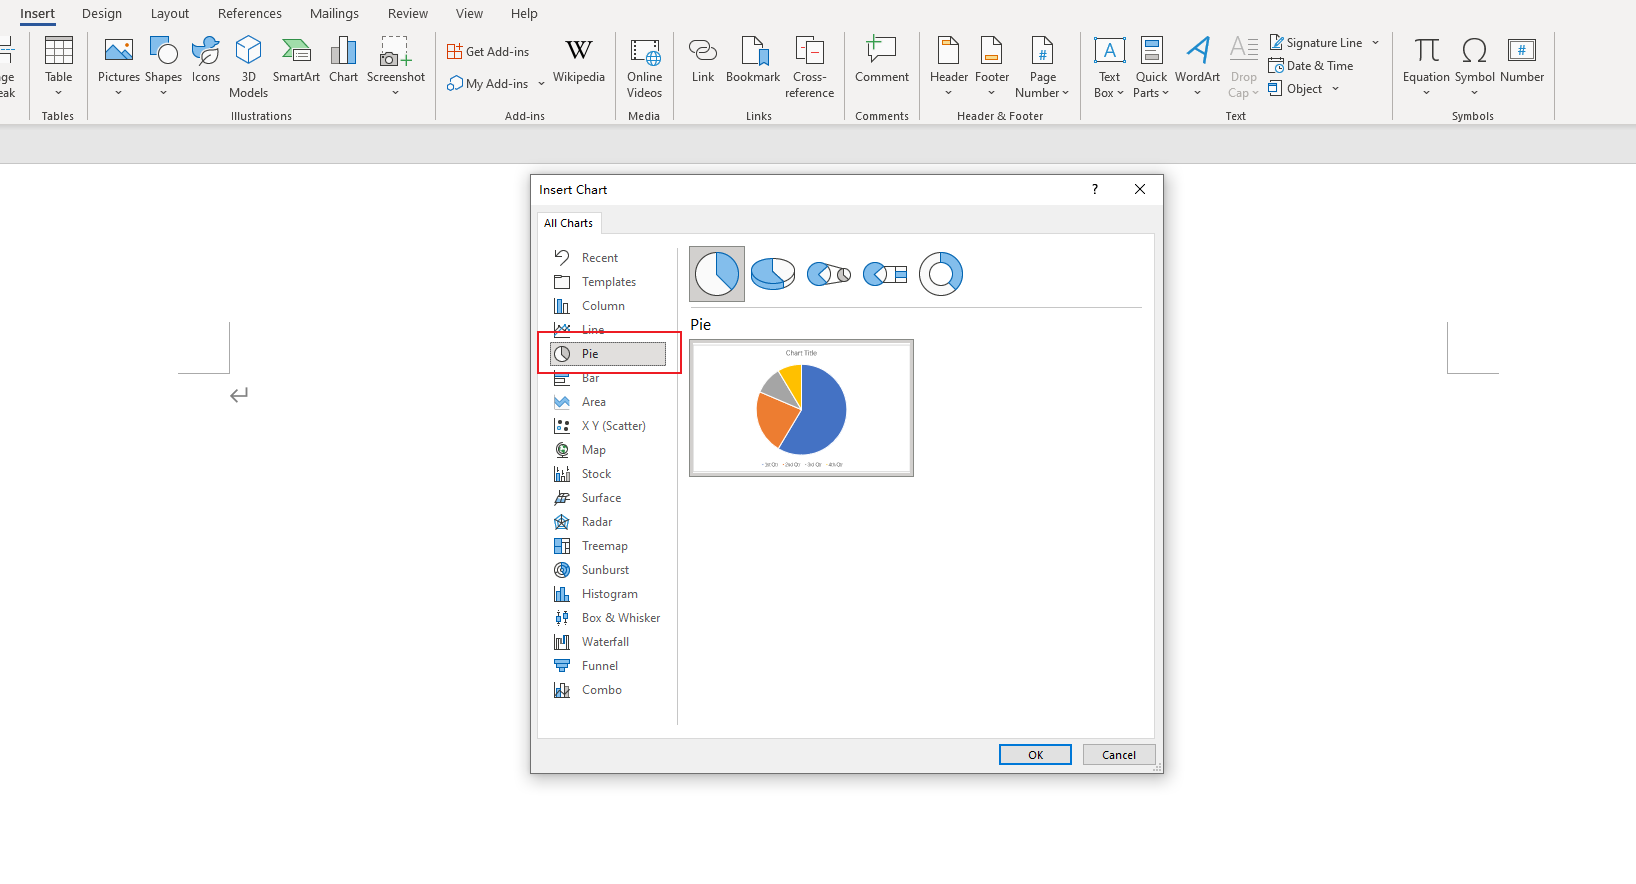
Step 4: Select the type of pie chart you want to create, then click 'OK'.
Step 5: An Excel sheet will pop up with some default data. Replace this data with your own.
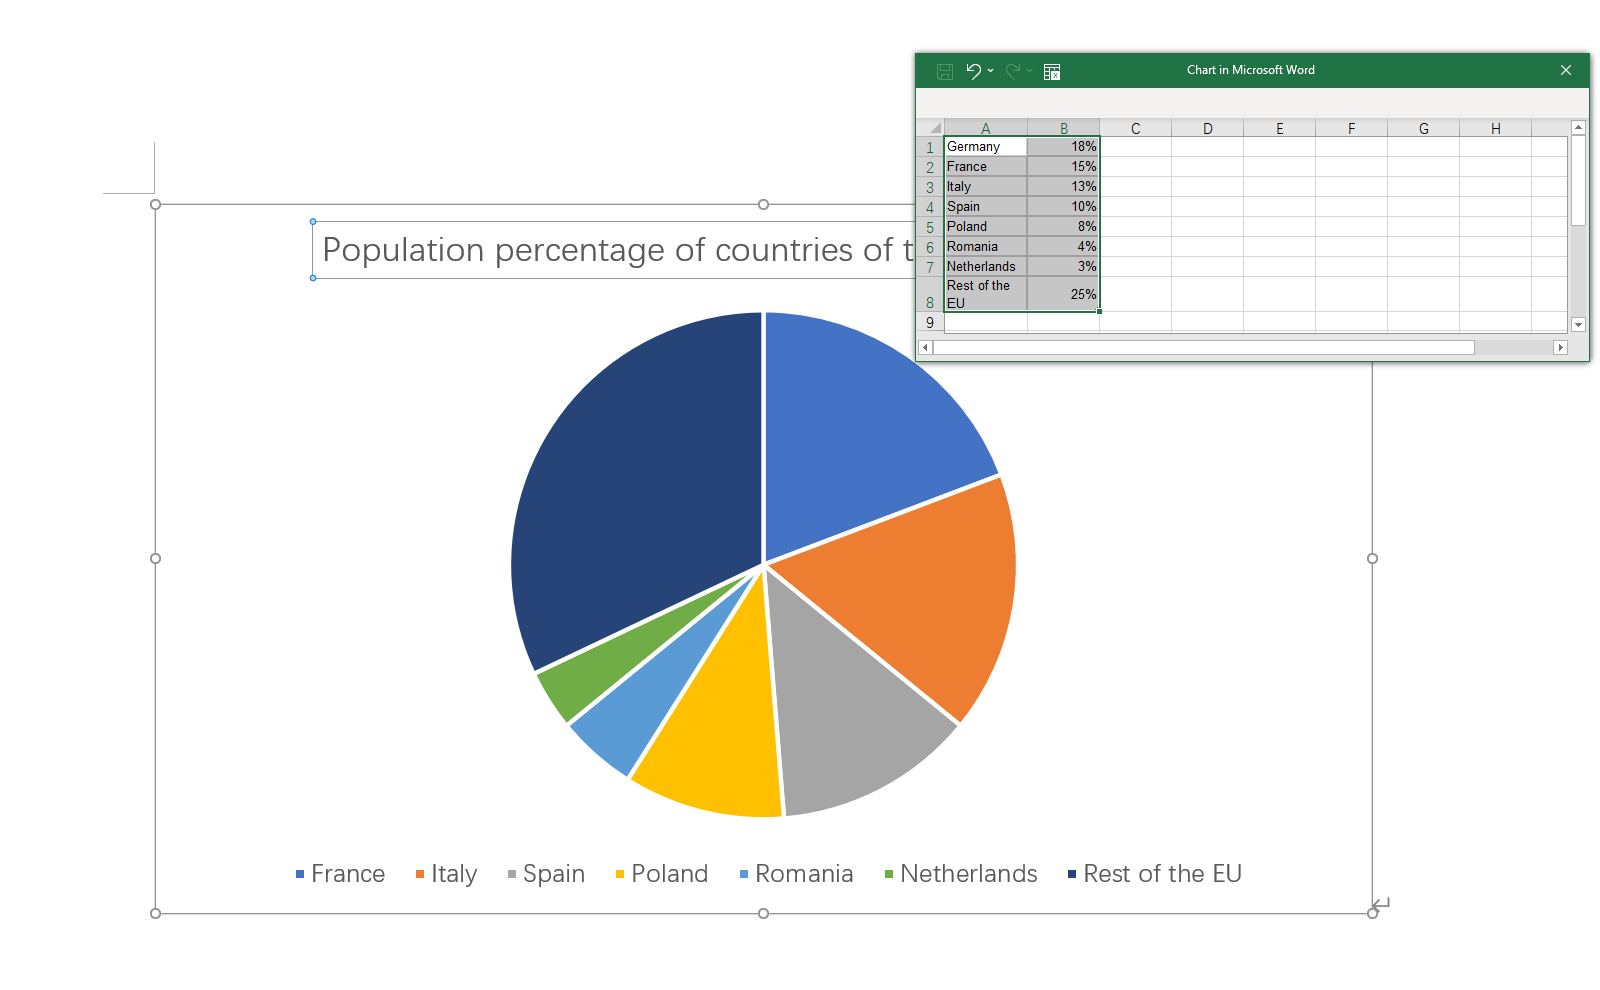
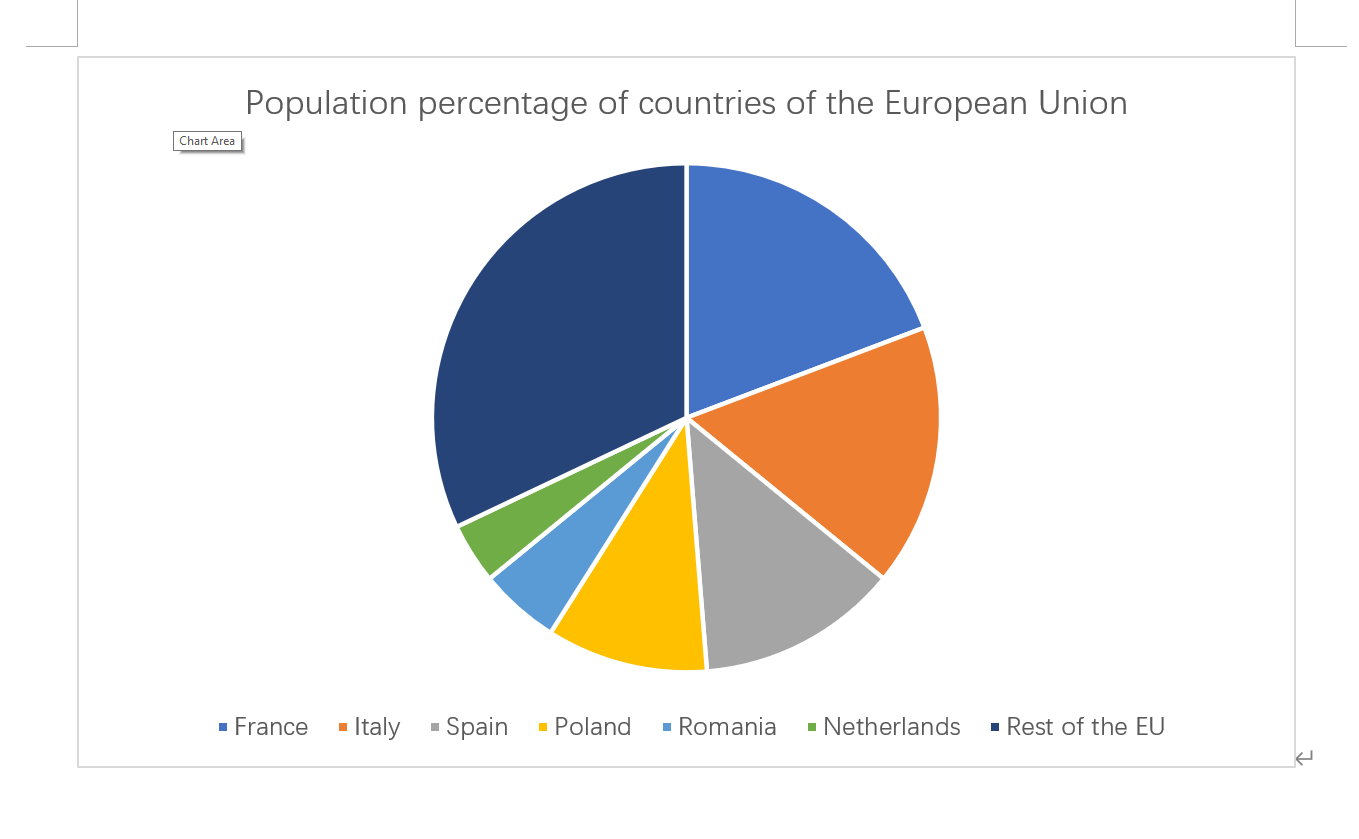
Step 6: After entering your data, close the Excel window. Your pie chart will appear in your Word document reflecting your entered data.
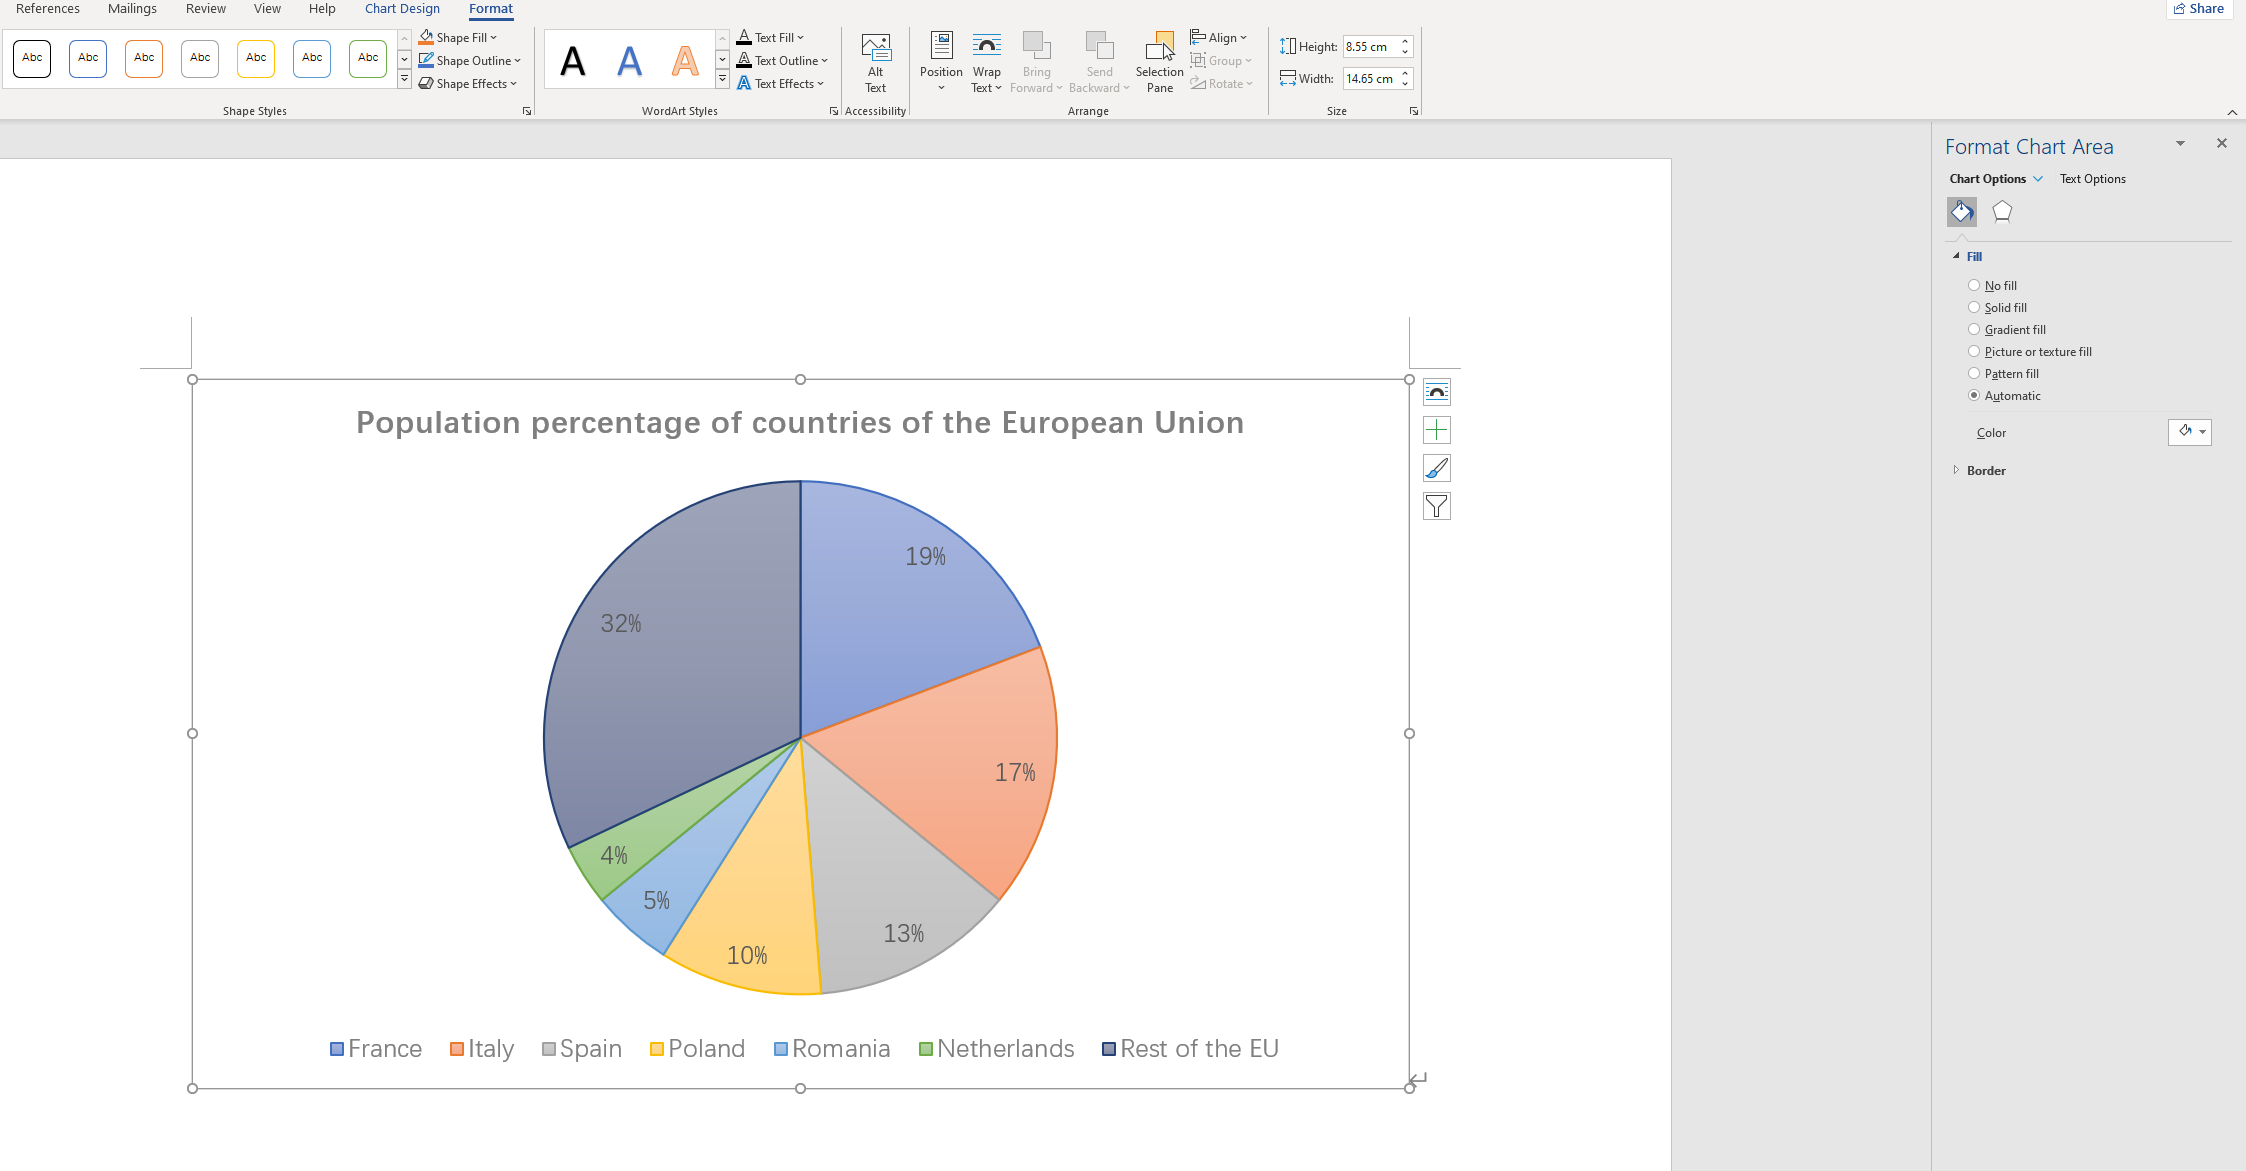
Step 7: To customize your chart (like changing colors, adding labels, etc.), use the Chart Tools available in Word.
Pros and Cons of Making a Pie Chart in Word
Creating pie charts in Microsoft Word has its unique set of advantages and disadvantages:
Pros
- Familiar Interface: If you're accustomed to Microsoft Office Suite, you'll find it easier to navigate and use Word's charting features.
- Integration with Text Content: Being primarily a text editor, Word lets you seamlessly integrate your charts with your document's written content.
- Consistency: Using Word for both text content and data visualization ensures consistency in the design and style of your document.
Cons
- Limited Features: While Word offers basic charting options, it falls short of advanced data visualization tools' capabilities.
- Lacks Interactivity: Unlike some specialized tools, Word does not offer interactive features for its charts.
- Less Intuitive: While manageable, the process of creating a pie chart is less intuitive in Word compared to dedicated charting software.
Understanding pie charts' functionality, creation process in Word, and evaluating its pros and cons can guide you to make an informed decision on whether Word is the right tool for your pie chart visualization needs.
How to Create a Pie Chart in Boardmix
Boardmix is a powerful, web-based tool designed for creating visually appealing and interactive charts, graphs, and infographics. It's packed with numerous features and customization options that let you present your data in the most intuitive manner possible. Boardmix stands out with its capabilities to create interactive and dynamic visuals that keep your audience engaged.

Whether you need to create straightforward pie charts or complex multi-level ones, Boardmix offers the right set of tools to make it happen. Its versatility extends beyond just creation, allowing for easy sharing, collaboration, and embedding, making it a popular choice amongst professionals looking to convey their data in the most effective manner.
Creating a pie chart in Boardmix is straightforward. Here's a step-by-step guide to help you through the process:
Step 1: Log into Boardmix
Access the Boardmix website and log into your account. If you don't have one, create an account first.

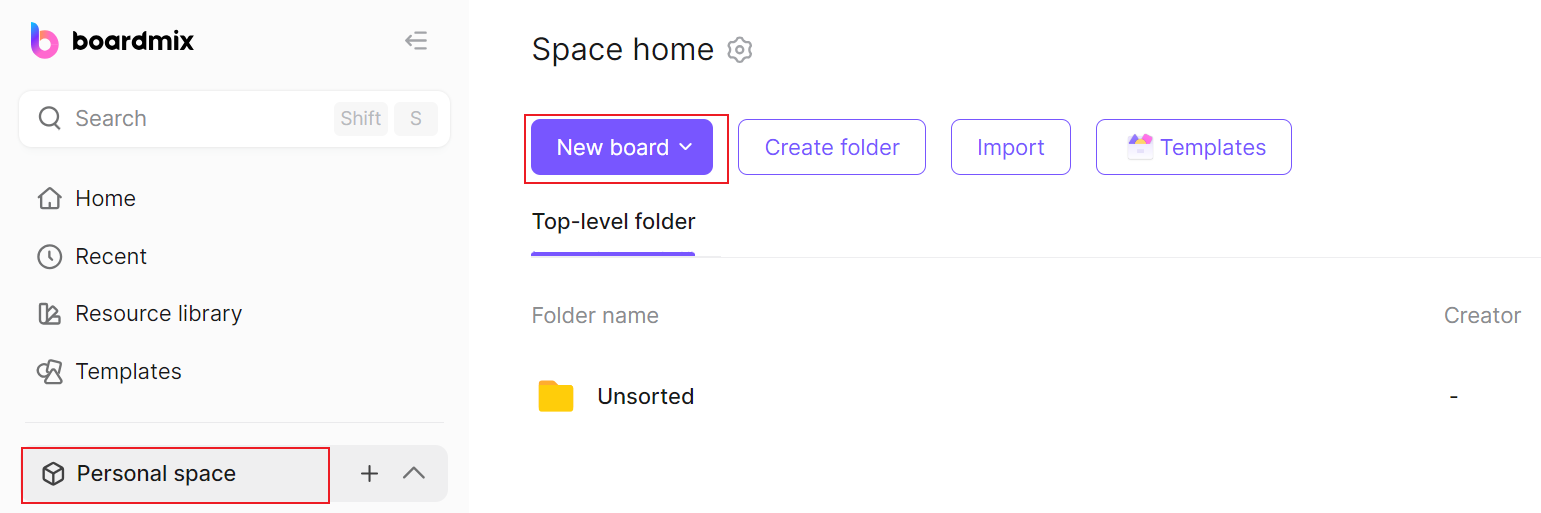
Step 2: Create a New Board
Once logged in, click on 'New board' to start.
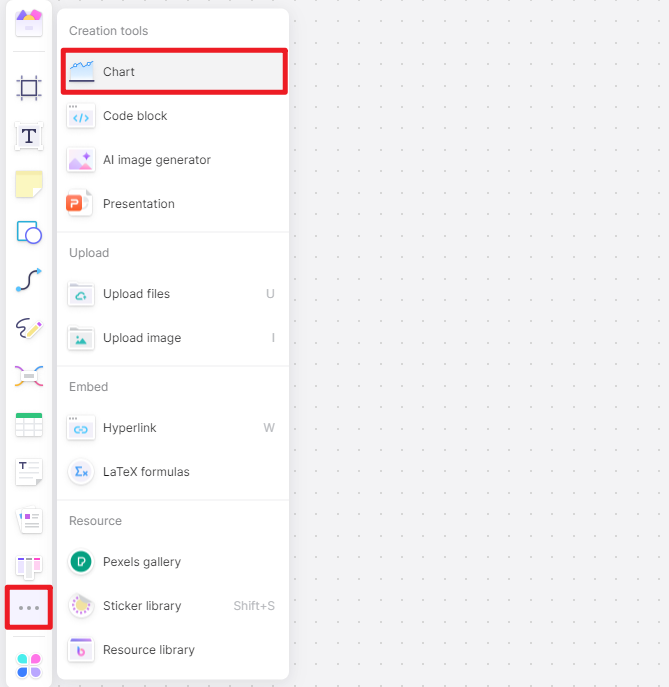
Step 3: Choose Pie Chart
In the chart selection screen, choose 'Pie Chart' from the list of available chart types.
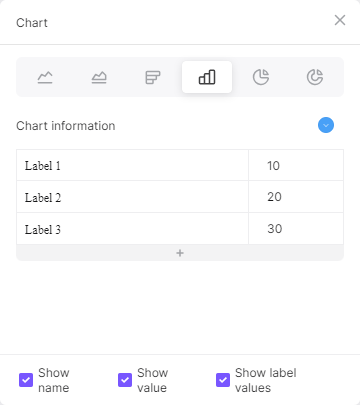
Step 4: Import or Enter Data
Next, click the pen icon to enter your data used in the pie chart.
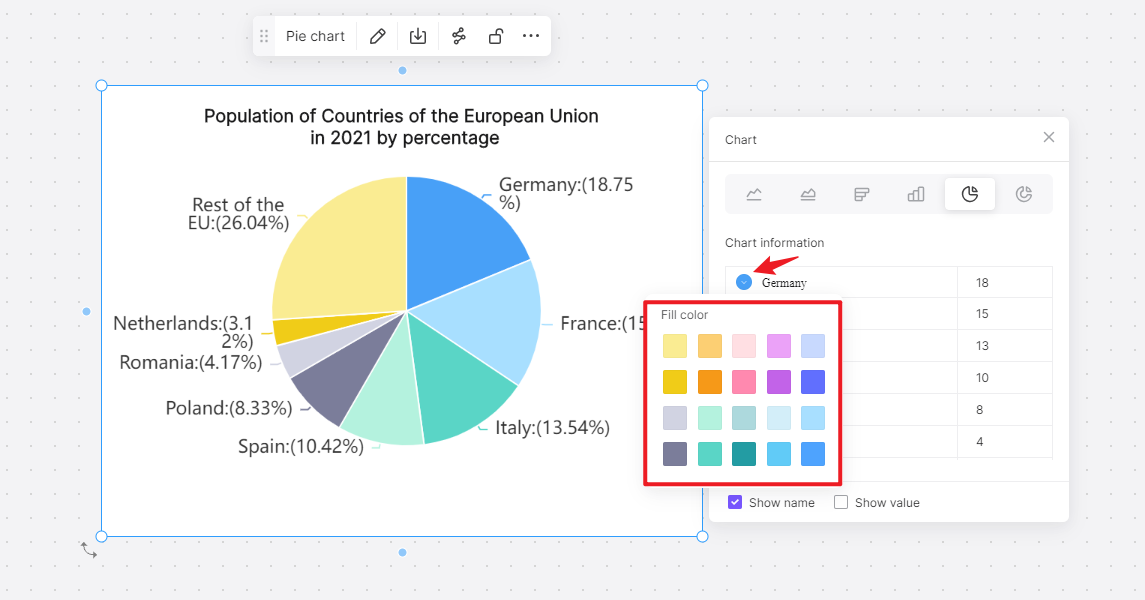
Step 5: Customize Your Chart
Once your data is imported, you can begin customizing your chart. Adjust colors, add labels, set the size of individual slices, and much more. Take advantage of the customization options to make your pie chart more engaging and easier to understand.
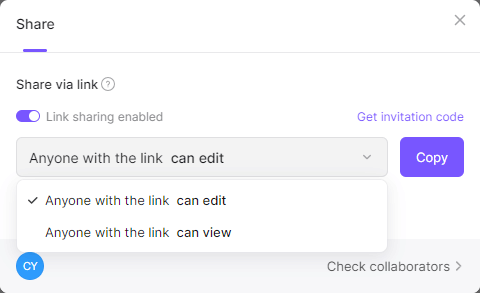
Step 6: Share Your Chart
After customizing, Boardmix gives you options to share it directly via link or email, and you can also embed it into a website, or download it for offline use.
How to Choose: Create a Pie Chart in Word or in Boardmix
Creating pie charts with Boardmix can help you display complex data in an easy-to-understand format. Remember that the effectiveness of your pie chart depends not just on accurate data but also on thoughtful design and customization.
If you are already comfortable with Microsoft's interface and use it for other purposes, then creating a pie chart in Word can be an intuitive process. Word allows seamless integration of the chart with the text, ensuring consistency in design and style. However, Word offers limited features when it comes to customizing the chart and lacks interactivity.
Consider using Word for creating a pie chart when:
- You need to embed your chart directly into a text-heavy document.
- You require basic charting capabilities without many customizations.
- Interactivity is not a necessity for your audience.
Boardmix, with its diverse features, allows users to create interactive and dynamic pie charts that can keep viewers engaged. Even though it might have a slight learning curve compared to Word, once familiar, it can offer extensive customization options.
Consider using Boardmix for creating a pie chart when:
- You need advanced customization features.
- You want your chart to be interactive and dynamic.
- You prefer sharing your charts digitally or embedding them into websites.
Both Word and Boardmix are competent tools for creating pie charts but serve different needs. Your choice should align with your specific requirements and the audience you are catering to.


