Visualizing the structure of an organization is made easy through an organizational chart. It's a powerful tool for illustrating the hierarchy and relationships between roles within a company. One popular software for creating an org chart is Microsoft PowerPoint.
This guide covers the SmartArt steps in desktop PowerPoint and a template workflow in Boardmix. Choose PowerPoint for a chart that belongs in a presentation, or a whiteboard when the structure needs more room for discussion.
What Is an Organizational Chart
An organizational chart, commonly known as an org chart, is a visual representation of an organization's structure. It showcases the roles within the organization and the hierarchical relationships between them.
The utility of an org chart is manifold:
Clear Communication: An org chart conveys the internal structure and hierarchy of an organization, thereby enabling clear communication.
Role Clarity: By visualizing reporting lines, org charts provide clarity about each individual's role and responsibilities.
Planning and Structuring: Organizational charts are invaluable tools for workforce planning and restructuring initiatives.
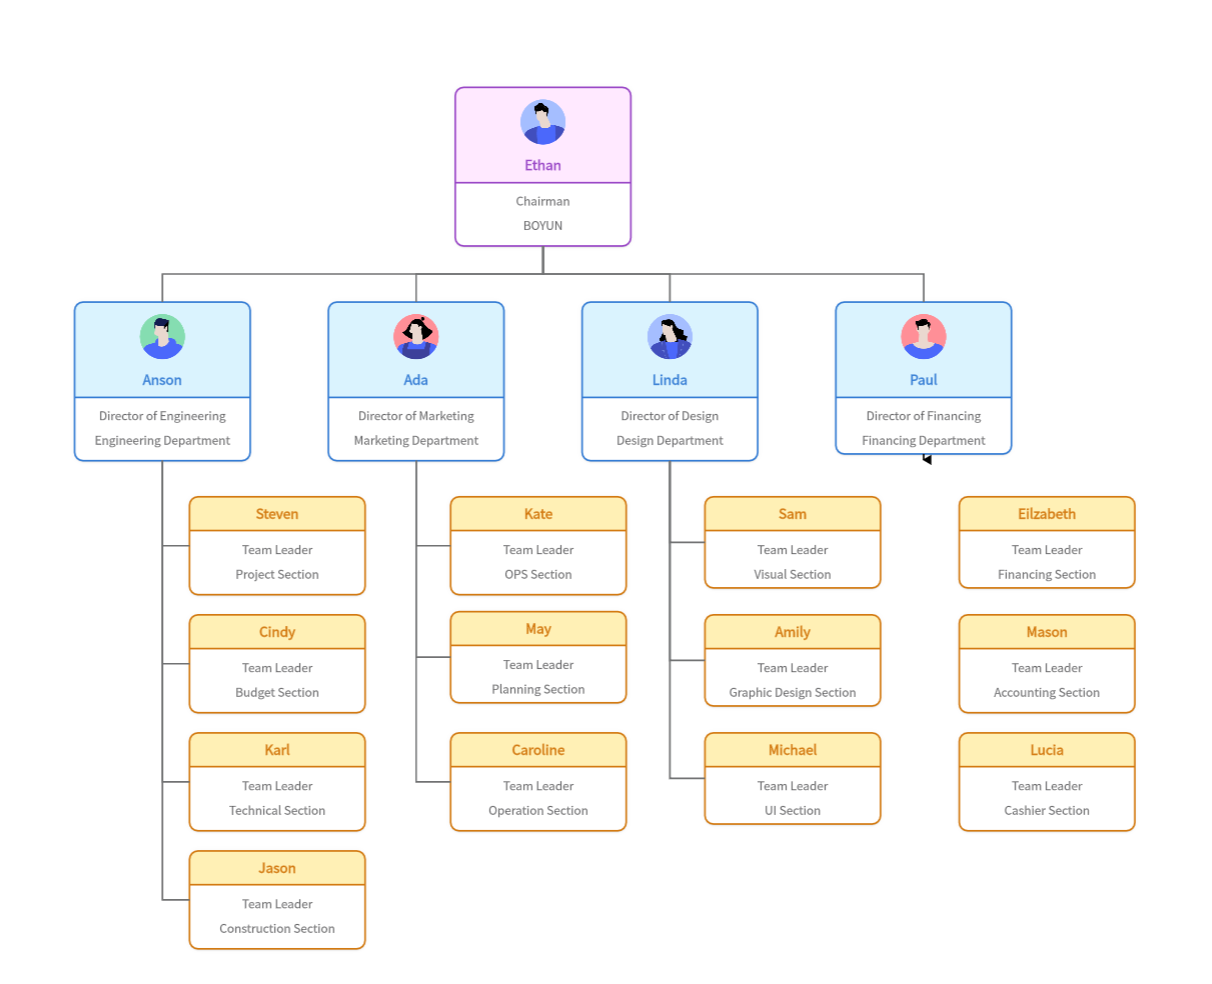
Now, let's focus on creating an org chart in PowerPoint.
How to Make an Org Chart in PowerPoint
In desktop PowerPoint, use a Hierarchy SmartArt layout for reporting relationships:
Step 1: Start by opening a new presentation in PowerPoint and selecting a blank slide.

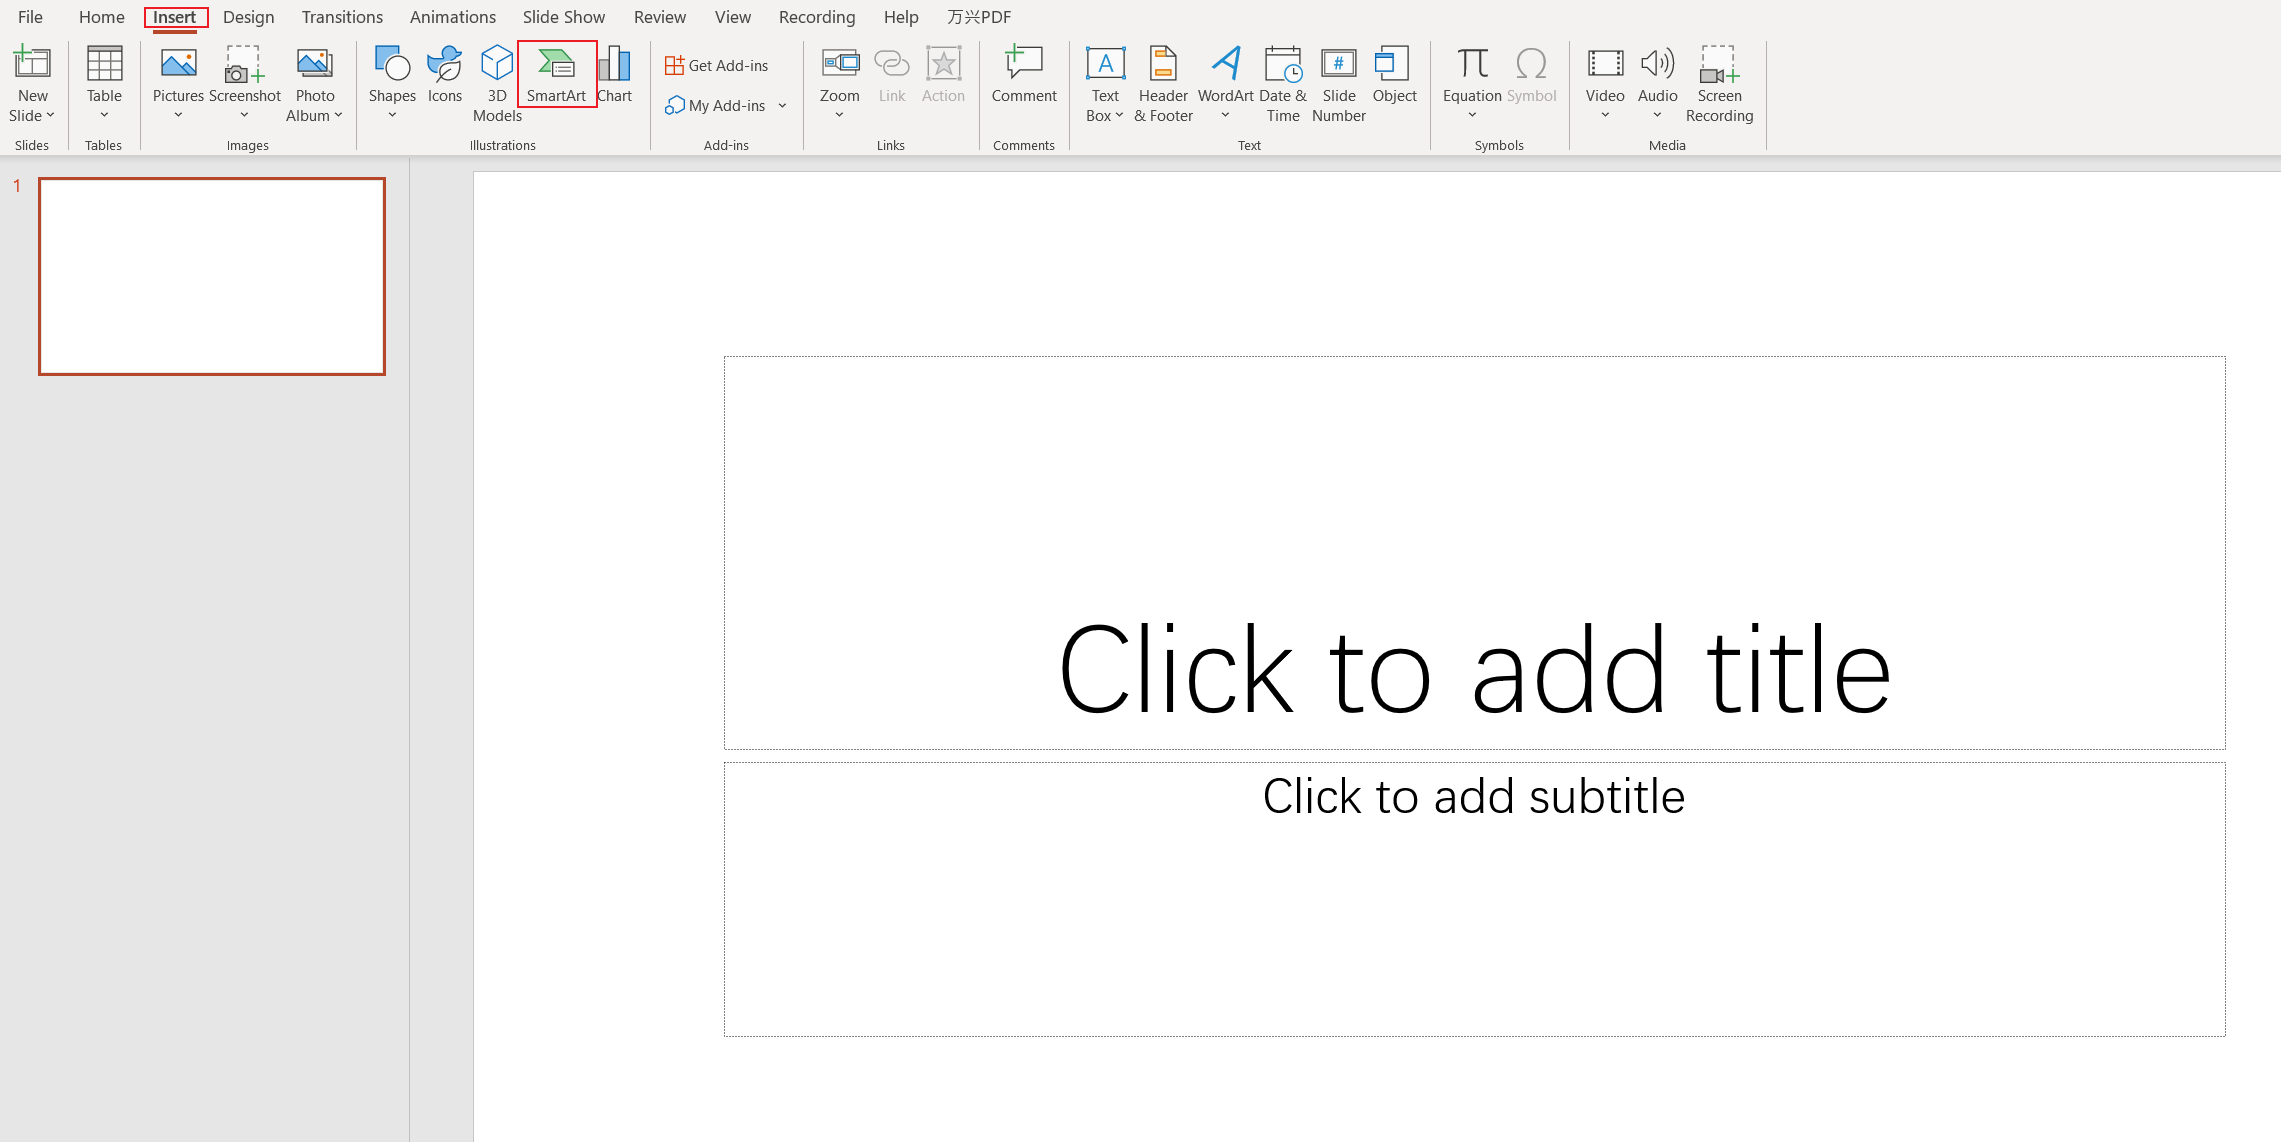
Step 2: Navigate to the 'Insert' tab in the top menu and select SmartArt.
Step 3: In the 'Choose a SmartArt Graphic' window that pops up, select Hierarchy. You'll see several styles of hierarchical charts here.
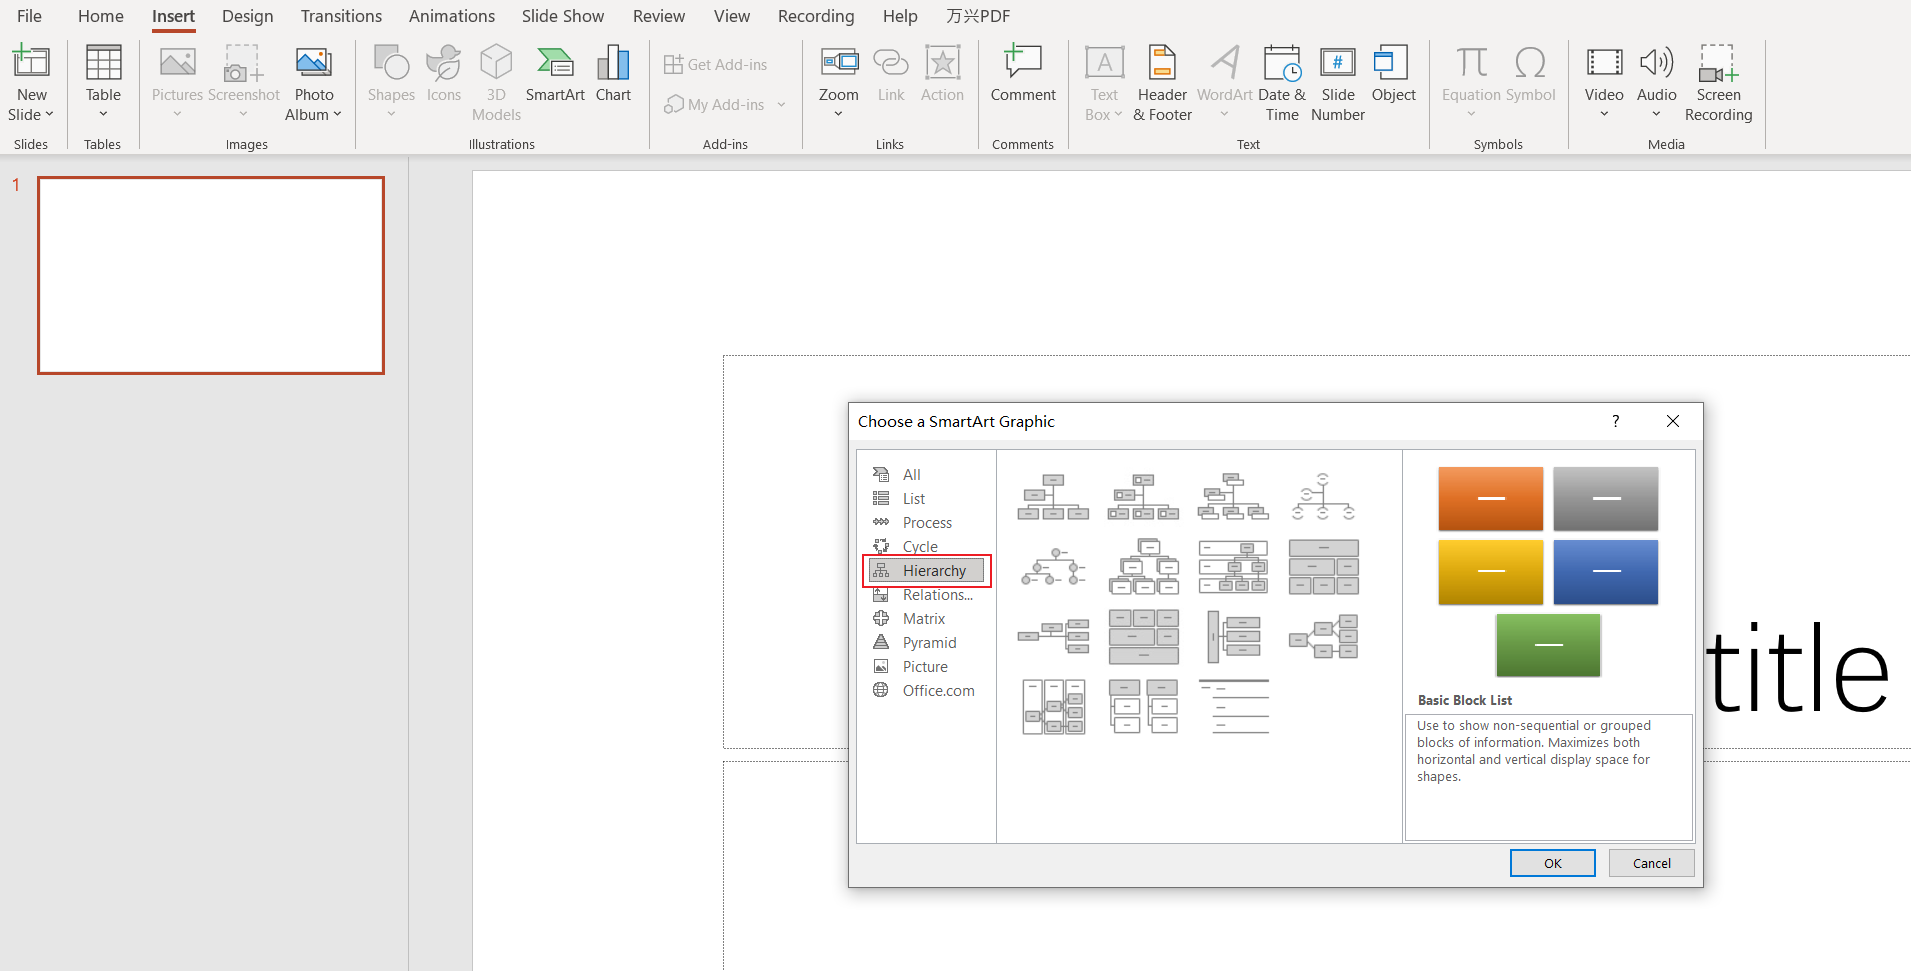
Step 4: Select the style you prefer for your org chart and click OK.

Step 5: replace the placeholders with job titles and names. In SmartArt Design, use Add Shape to add a role at the appropriate level; check that every connector represents the intended reporting relationship.
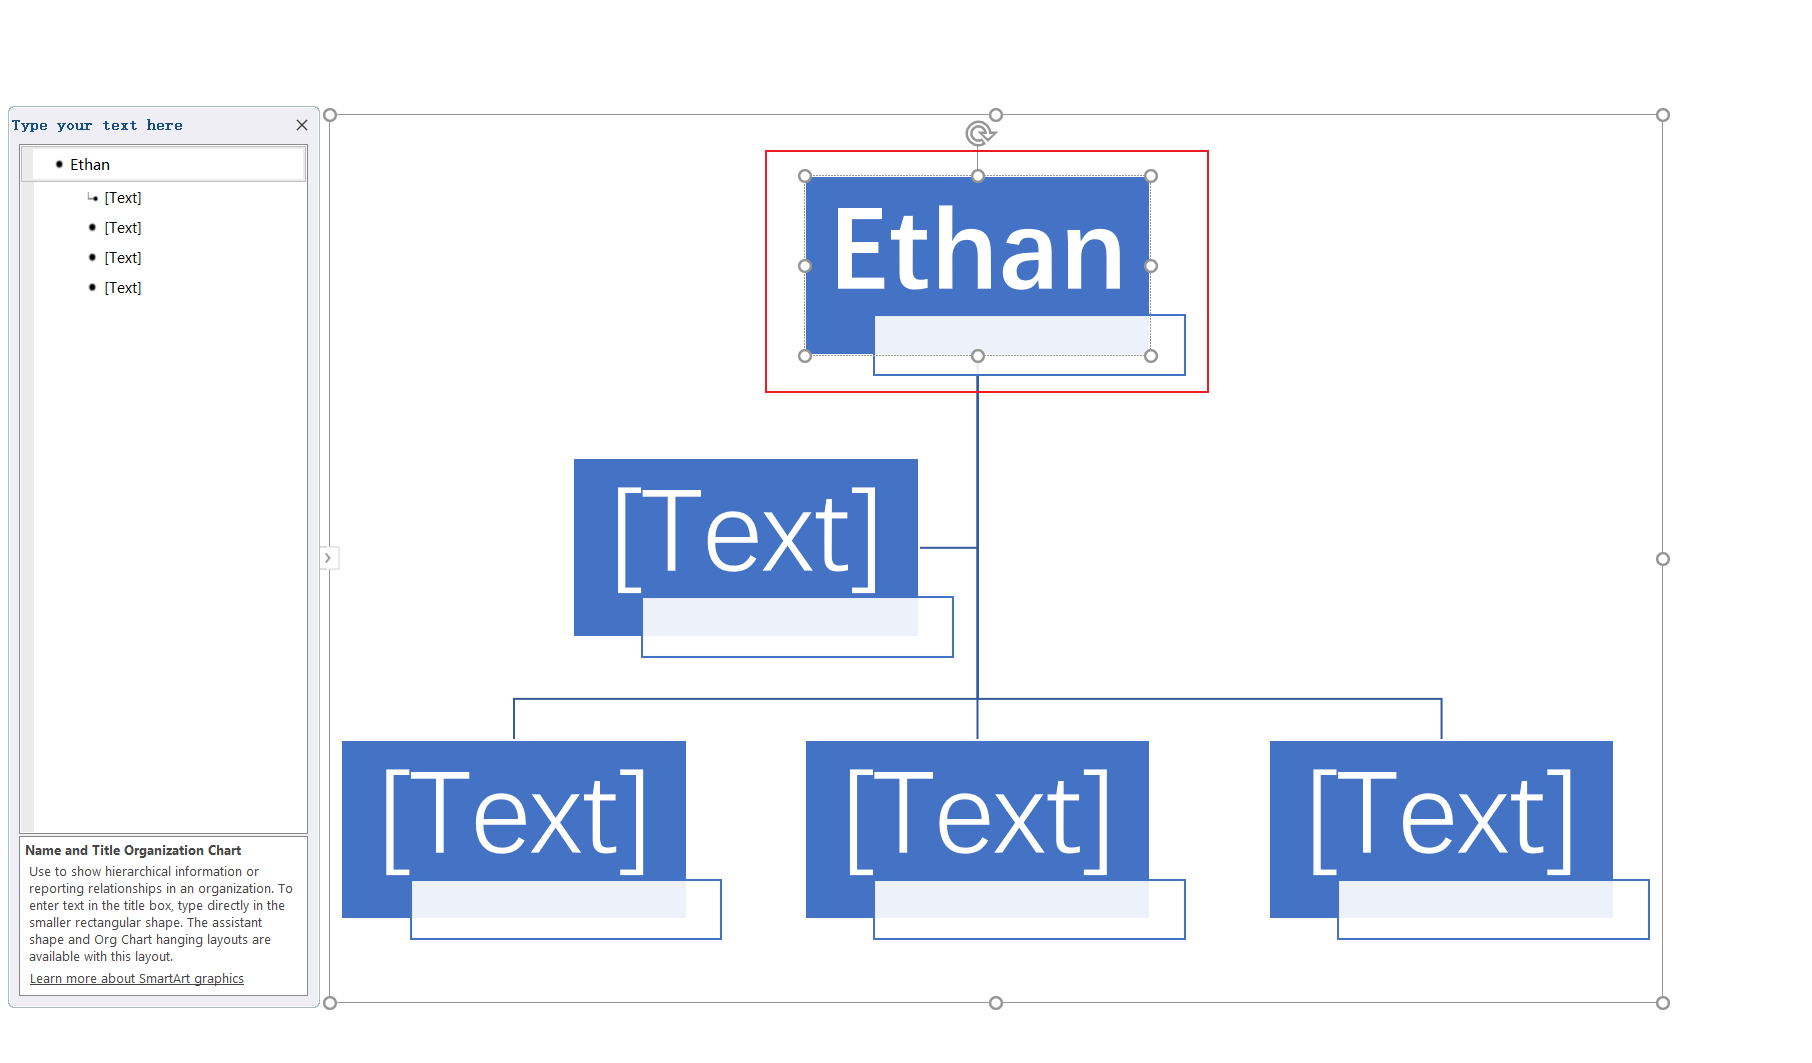
Step 6: Customize your org chart by changing colors, adding effects, adjusting shape sizes, and more.

For example, place a department manager above two team leads, then place each team’s roles below its lead. Keep dotted-line or temporary reporting relationships clearly labeled so they are not mistaken for the main hierarchy.
Create an Organizational Chart in Boardmix
Boardmix provides an alternative when you want to discuss an organizational structure on a shared canvas. Start with a template, replace the sample roles and adjust the connections as the structure develops.
Creating an organizational chart in Boardmix using a template is a simple and efficient process. Here are the steps to guide you:
- Log into your Boardmix account and navigate to the dashboard.

- Click on New Board to create a new workspace.
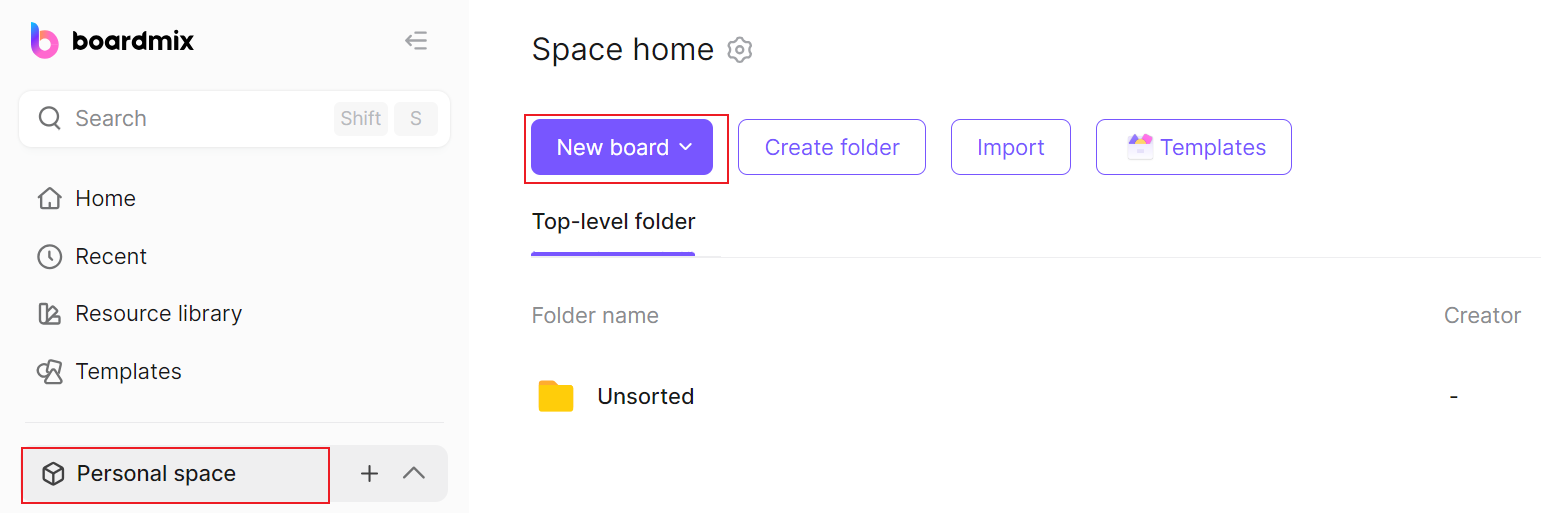
- Open the template library in your workspace.

- Scroll through the available templates or search the template labeled [Organizational Chart]. Click on it to select it.

- The template will load onto your canvas, providing you with a basic organizational chart structure.

- Now, you can customize this chart according to your organization's structure. Click on each shape to add text or use the editing options in the toolbar to change colors, add icons, or adjust other visual elements.
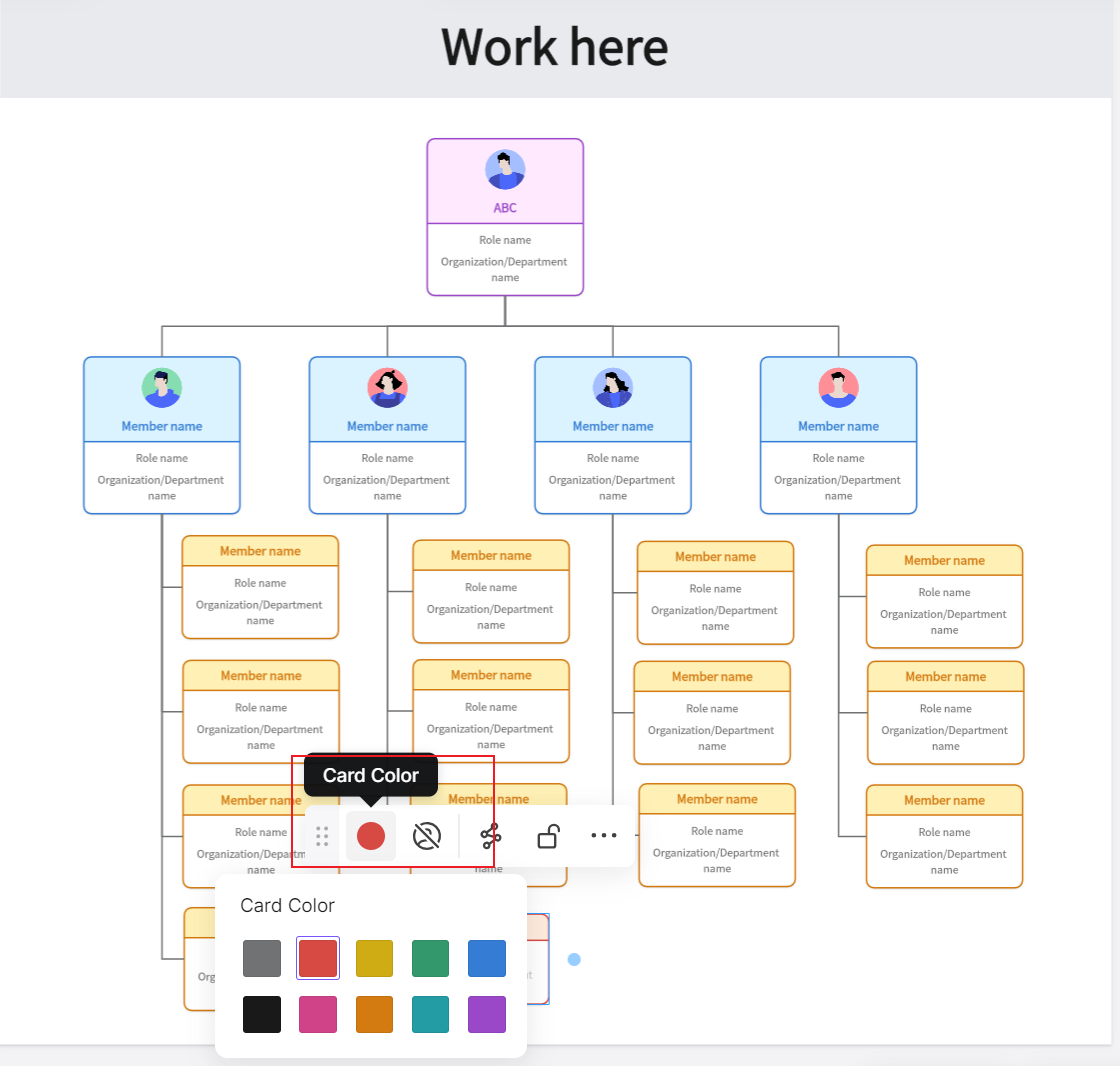
- Add another shape for each new role, enter its label and connect it to the appropriate manager.
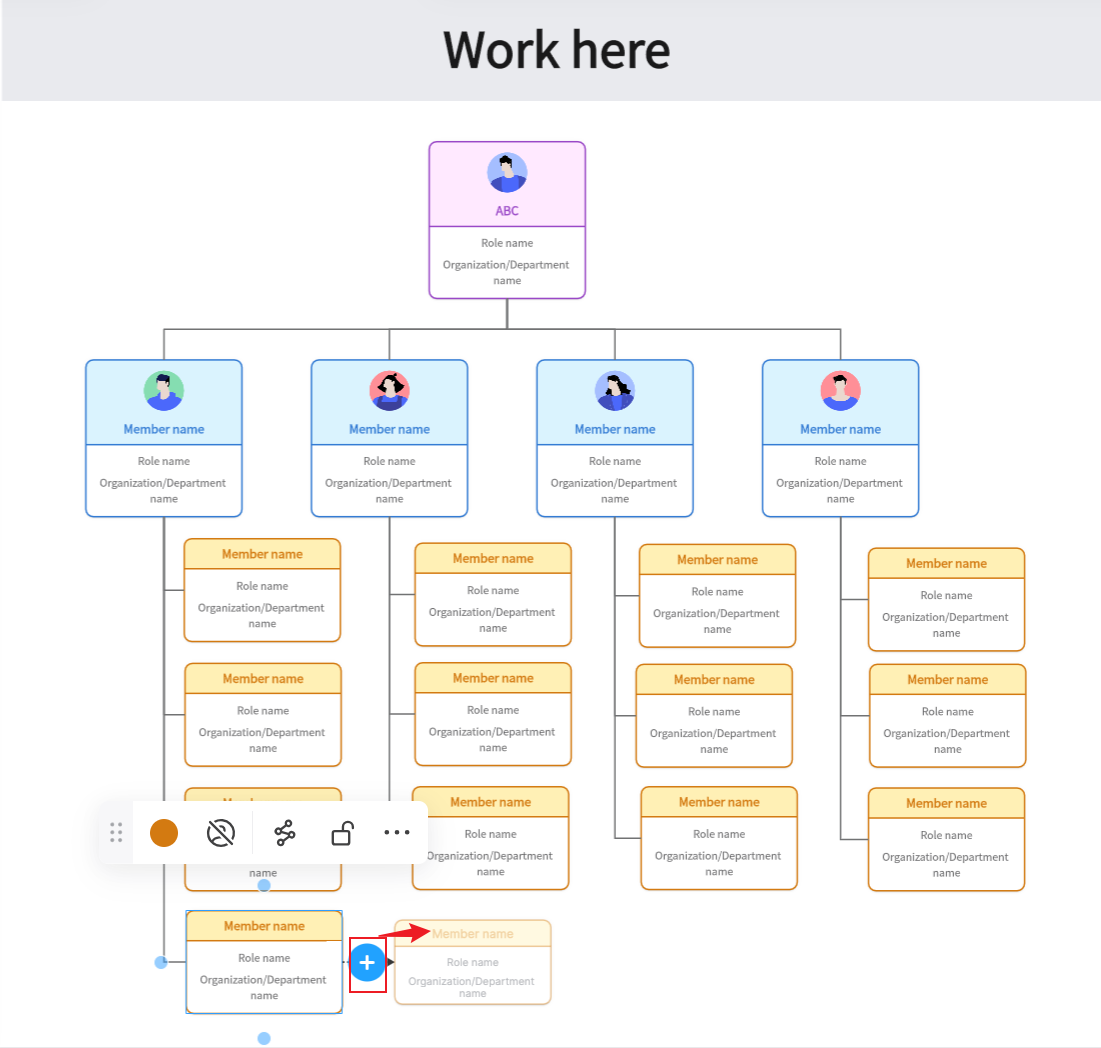
Once you've finished customizing your chart, click on Share and then you can invite others for collaboration via a link.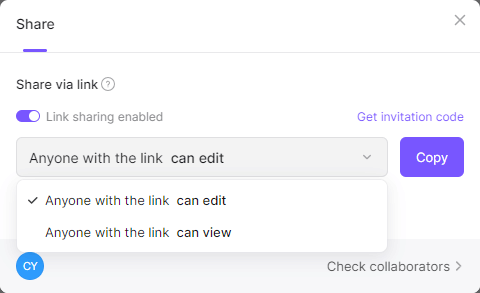
Before sharing names or internal reporting information, choose the appropriate board permissions. Give editing access to people maintaining the chart and viewing access to those who only need to consult it.
How to Choose: Create an Organizational Chart in PowerPoint or in Boardmix
When deciding whether to create an organizational chart in PowerPoint or Boardmix, both offer compelling features and the choice largely depends on your specific needs.
PowerPoint’s Hierarchy SmartArt layouts work well for a chart you need to present in a slide deck. PowerPoint also supports coauthoring with a supported version and a file shared through OneDrive or SharePoint; Microsoft’s PowerPoint coauthoring guide explains the requirements.
Boardmix offers a shared canvas where the chart can sit beside notes about vacancies, role changes or alternative structures. Teammates can edit the board together and discuss proposed reporting lines.

The deciding factor is the output, not the size of the team. Use a slide when the chart is part of a presentation; use a shared canvas when the team is still working through the structure. In either format, name an owner to keep roles and reporting lines current.