


Effective project management relies heavily on planning, scheduling, and task coordination. There are numerous tools available to aid in these endeavors, and among the most widely utilized is the PERT (Program Evaluation and Review Technique) chart. Many project managers turn to Excel to create these charts, which offers several benefits but also some challenges. This article will show you a step-by-step guide to creating a PERT chart in Excel. Let’s get started!
What Is a PERT Chart
A PERT chart is a project management tool that visualizes the sequencing of project tasks and the dependencies between them. It displays the tasks required to complete a project in a graphical network model, making it easier for project managers and teams to understand task relationships and the flow of the project.
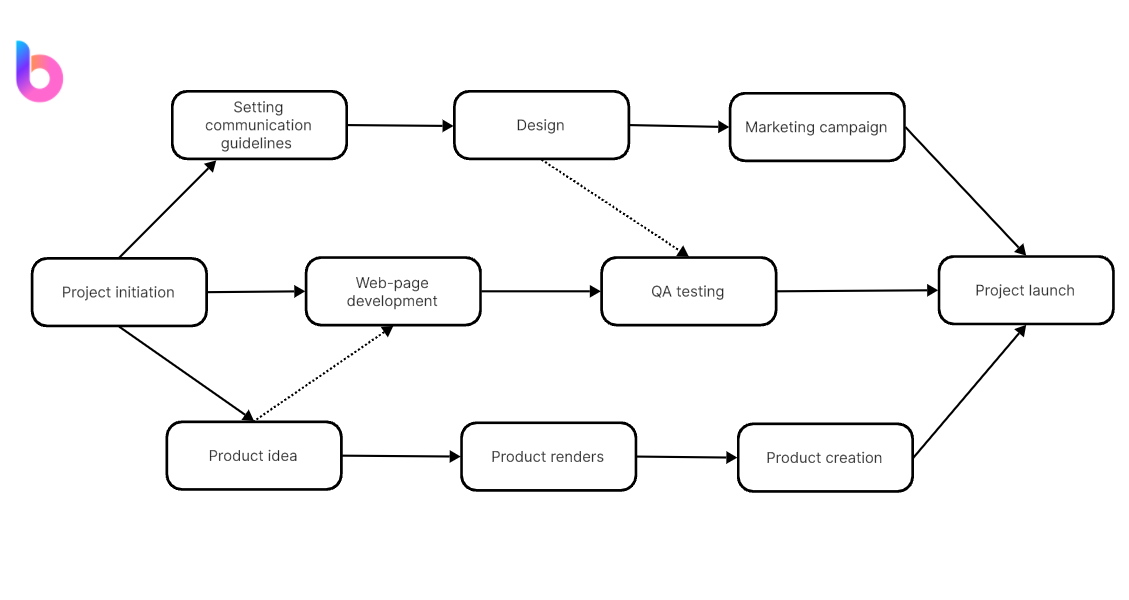
The chart's core feature is its ability to highlight the 'critical path,' which is the longest sequence of tasks that must be completed on schedule to prevent delays in the project's overall timeline. By pinpointing this path, project managers can prioritize key tasks and allocate resources more efficiently.
How to Create a PERT Chart in Excel
Creating a PERT chart in Excel is feasible with the following steps:
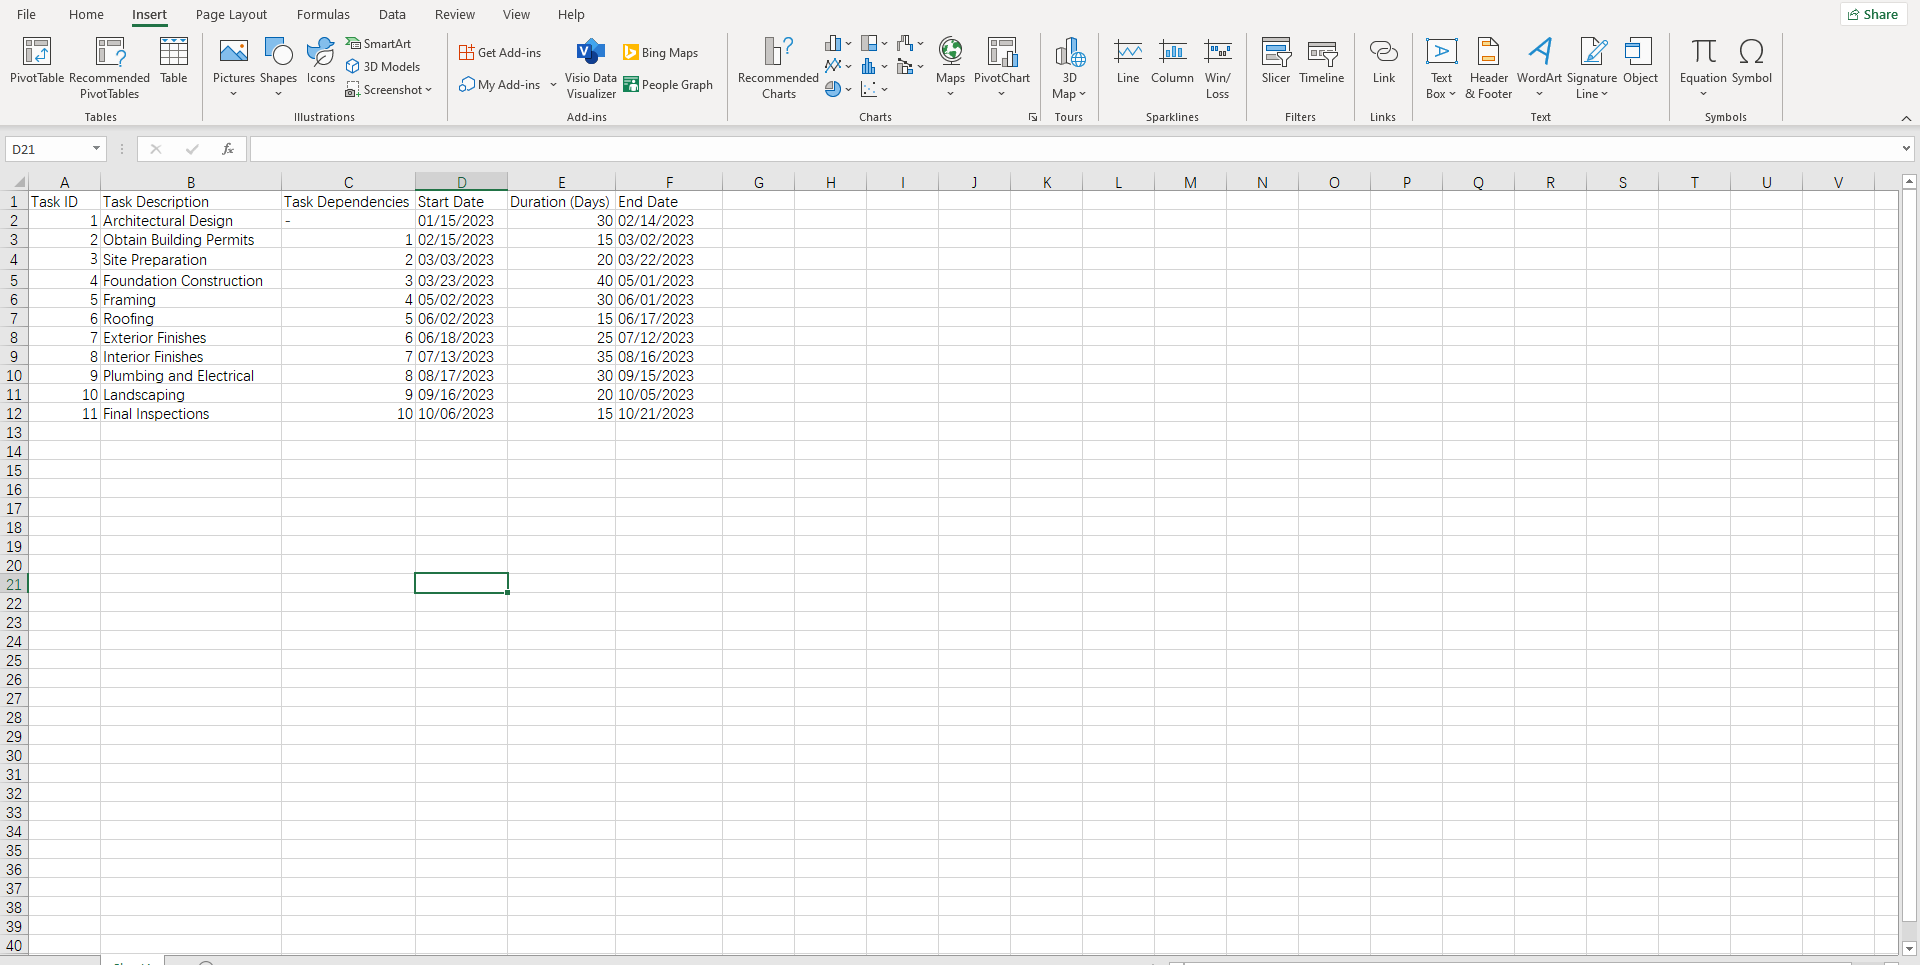
Step 1: Create a Task List
In an Excel spreadsheet, list all of the tasks necessary to complete your project. Include columns for task dependencies, start dates, durations, and end dates.
Step 2: Define Task Dependencies
Indicate which tasks rely on the completion of others. This will help you understand the flow of tasks and identify any potential bottlenecks.
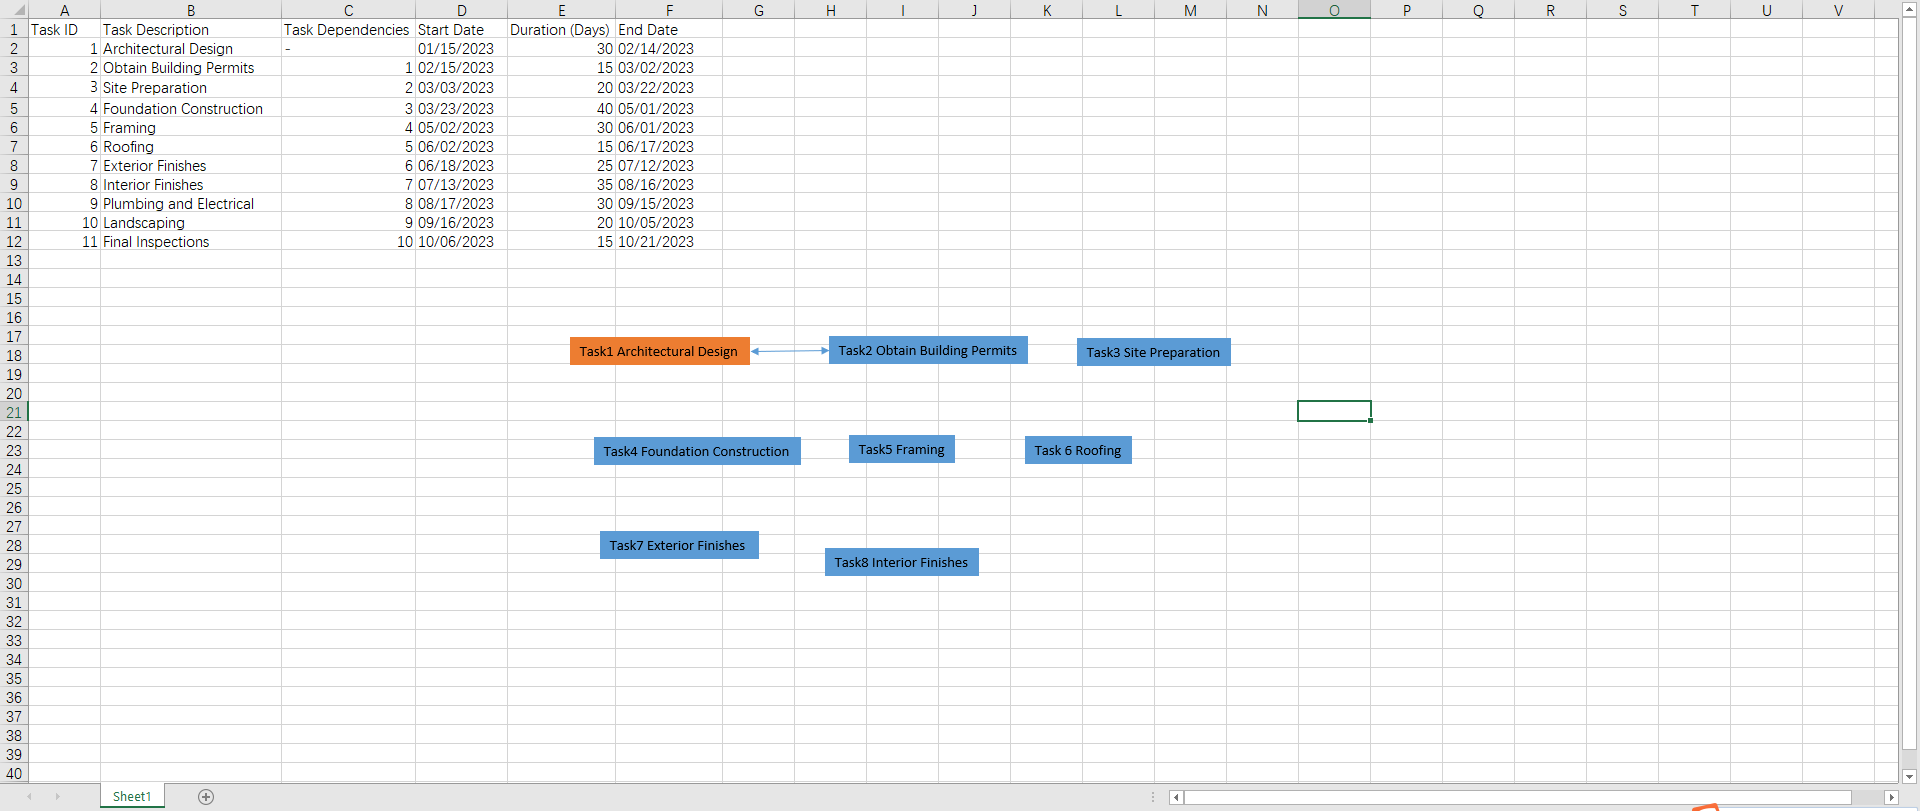
Step 3: Create a Scatter Plot
In a new Excel sheet, create a scatter plot that represents each task as a point along the timeline.
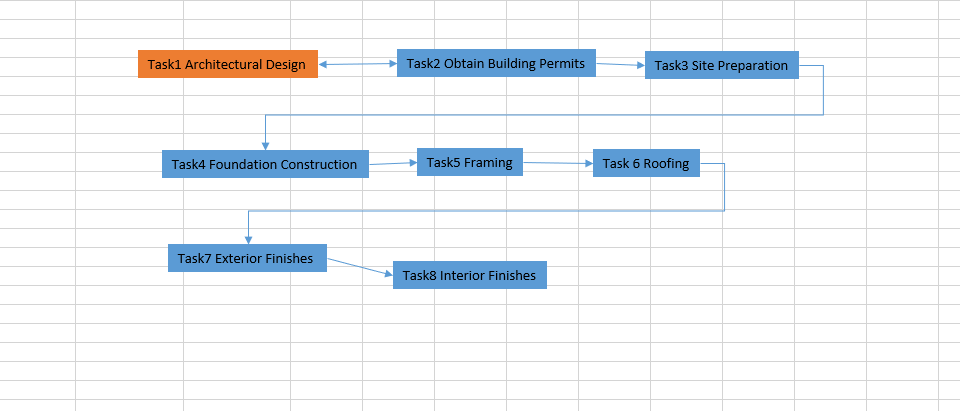
Step 4: Draw Task Dependencies
You can manually draw lines or arrows between dependent tasks using Excel's shape-drawing features.
Step 5: Identify Critical Path
Using the information from your task list, identify the critical path by highlighting or coloring those specific tasks on your chart.
Despite Excel not having a built-in PERT chart tool, you can still use it effectively with these steps to create a functional PERT chart for your project.
Pros and Cons of Creating a PERT Chart in Excel
Using Excel to create your PERT chart comes with advantages and disadvantages.
Pros
- Accessibility: Excel is a widely used tool, making it accessible to many users.
- Flexibility: Excel allows for custom modifications to fit your project's specific needs.
- Cost-effective: If you already have Excel as part of Microsoft Office, you don't need additional software to create a PERT chart.
Cons
- Time-consuming: Creating a PERT chart manually in Excel can be time-consuming, especially for complex projects.
- Lacks Automation: Unlike dedicated project management software, Excel does not automatically update task dependencies when changes are made.
- No Collaboration Features: Excel lacks collaboration features found in other project management tools that facilitate team communication and coordination.
In conclusion, while creating PERT charts in Excel has its challenges, it can still be a valuable method for smaller, less complex projects or for teams already well-versed in Excel. For larger, more intricate projects, dedicated project management software with built-in PERT chart capabilities might be more efficient and effective.
How to Create a PERT Chart in Boardmix
Though creating a PERT chart in Excel is not that complicated based on the guide above, some of its cons prevent people from making the process more smooth and effective. That’s where Boardmix comes in handy.

Boardmix is a versatile project management platform designed to facilitate project collaboration, planning, and tracking. With a variety of features including task boards, file sharing, and visual project timelines, Boardmix caters to the needs of various teams and industries.
Follow these steps to create your PERT chart within Boardmix:
Step 1: Log in to Your Boardmix Account
Begin by accessing the Boardmix platform and logging in using your credentials. If you don't have an account, go ahead and register to establish one.

Step 2: Establish a New Board
Navigate to the "New board" button situated at the top left corner of the screen. This action will take you to the editor featuring an infinite canvas and an array of diagramming tools.

Step 3: Define Tasks and Dependencies
Determine all tasks that need to be included in the chart. After outlining all tasks, proceed to establish their interdependencies.
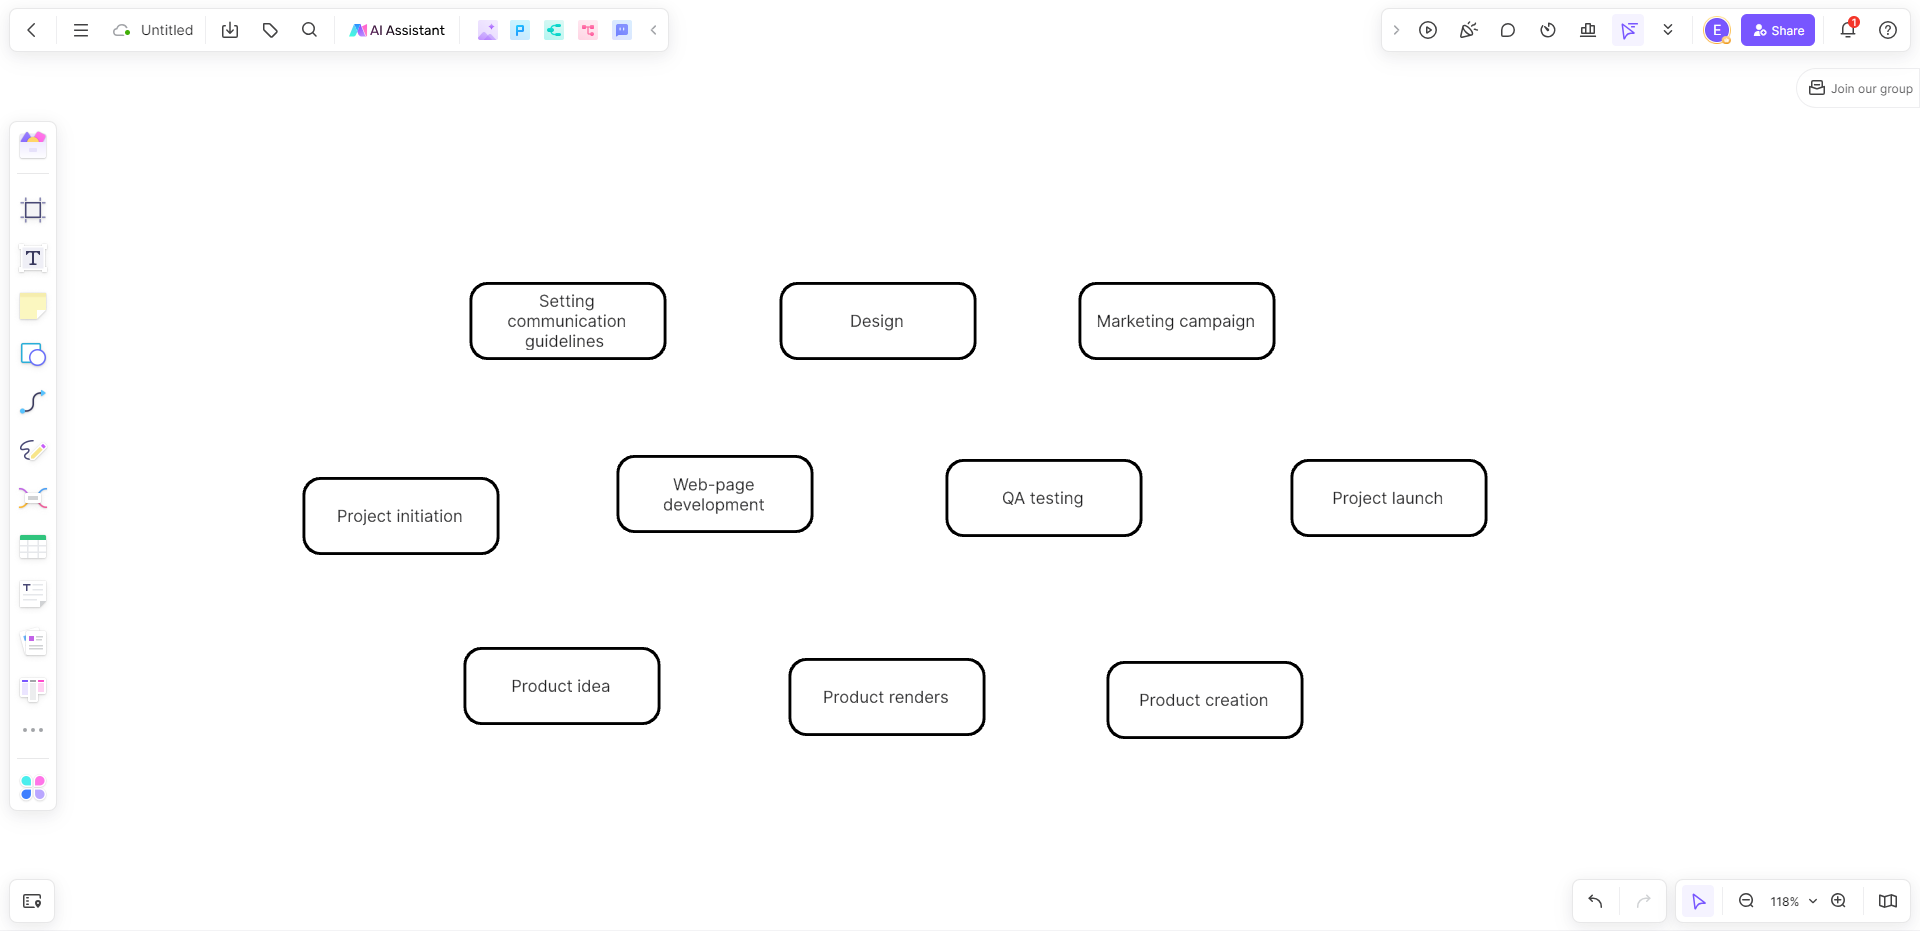
Step 4: Recognize the Critical Path
Utilize Boardmix's intelligent connection line to construct the critical path within the PERT chart. Simply input all tasks and connect them based on their dependencies.
Step 5: Modify Schedules as Needed
Make adjustments to task schedules when required. If there are changes to a task's schedule, Boardmix will automatically update all modifications in real-time.
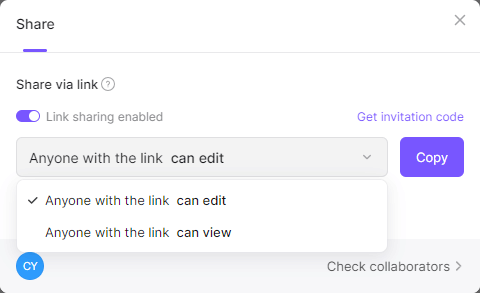
Step 6: Share Your Completed PERT Chart
Once your PERT chart is finalized, easily share it with team members or stakeholders directly from the Boardmix platform.
How to Choose: Create a PERT Chart in Excel or Boardmix
Choosing between creating a PERT chart in Excel or using Boardmix depends on your specific needs, preferences, and the complexity of your project. Here's a comparison to help you decide:
Please refer to part 3 to have a look at the pros and cons of making a PERT chart in Excel.
Creating a PERT Chart Using Boardmix
Pros
- User-Friendly: Boardmix typically offers a more user-friendly interface, making it easier for beginners to create PERT charts without extensive training.
- Collaboration: Boardmix often provides real-time collaboration features, allowing multiple team members to work together seamlessly.
- Templates and Tools: Boardmix may come with pre-designed templates and specialized diagramming tools tailored for PERT charts.
Cons
- Cost: Some diagramming tools, including Boardmix, may come with a subscription cost.
Considerations for Your Decision
- Project Complexity: For simpler projects, Excel might be sufficient, while more complex projects may benefit from the collaborative features and specialized tools of Boardmix.
- User Skill Level: If your team is already proficient in Excel, sticking to it might be the easier option. For less tech-savvy users, a user-friendly platform like Boardmix could be preferable.
- Collaboration Needs: If your project involves multiple team members collaborating in real-time, a tool like Boardmix with enhanced collaboration features may be more suitable.
- Budget: Consider the cost implications, as Boardmix or similar tools might have subscription fees.
Ultimately, choose the tool that aligns with your team's preferences, project requirements, and the level of collaboration needed.


