A PowerPoint timeline turns dates and milestones into a slide your audience can scan. Use it to explain a project schedule, a product launch or a sequence of historical events. Start with a short list of milestones, then choose a layout that gives each label enough room.
What Is a Timeline
A timeline is a linear representation of important events, tasks, or milestones occurring over time. It's an intuitive visual method to display information that unfolds over time, thereby giving the viewer a sense of order and chronology.
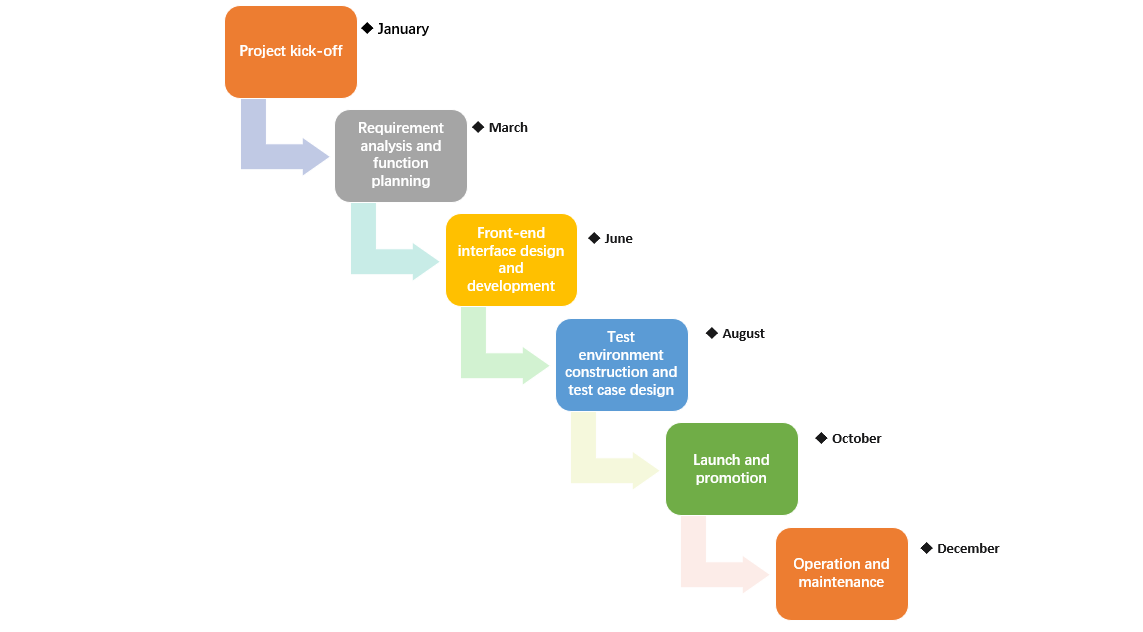
In a professional setting, timelines can illustrate project schedules, marketing plans, business milestones, and more. They can provide clarity about what tasks need to be completed and when, highlight critical points in the project, and track progress towards the end goal.
How to Create a Graphic Timeline in PowerPoint
The following steps use SmartArt in the desktop version of PowerPoint. Menu names and available layouts can differ by version.
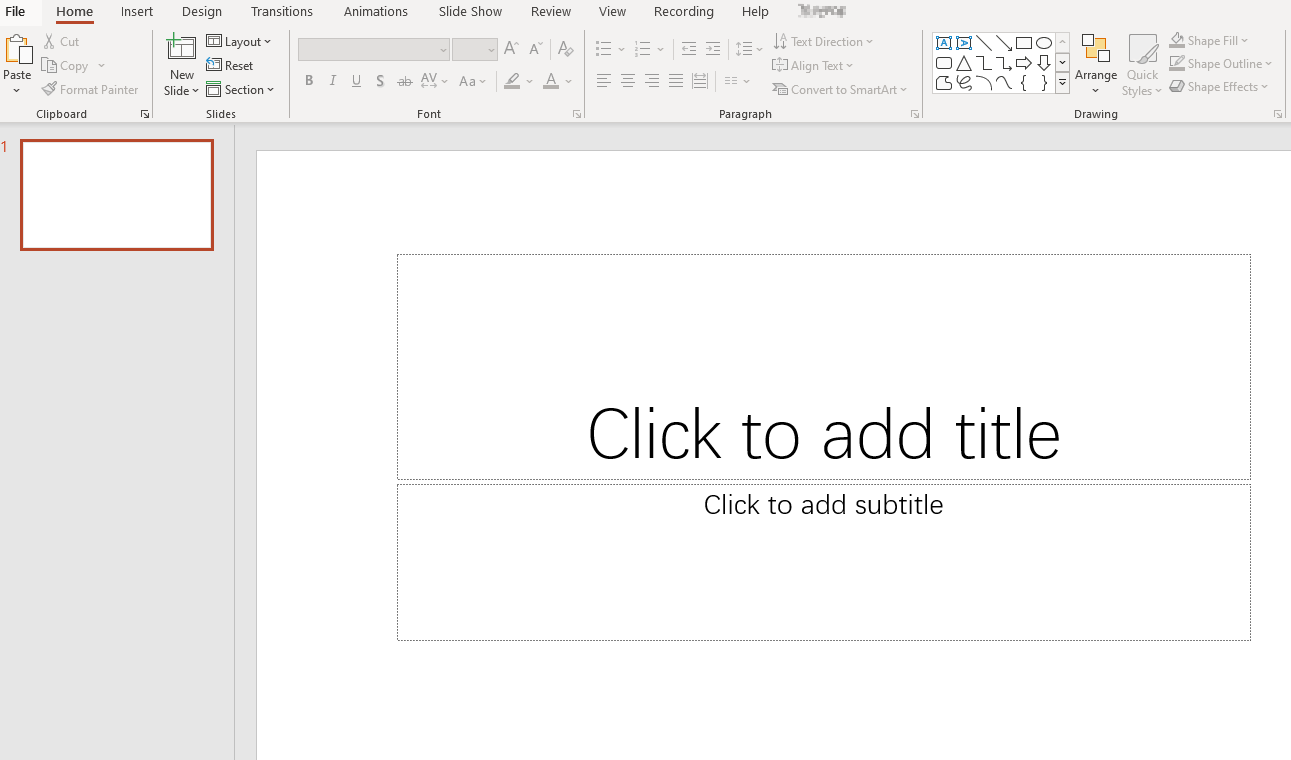
- Start a New Slide: Begin by creating a new slide where your timeline will reside.
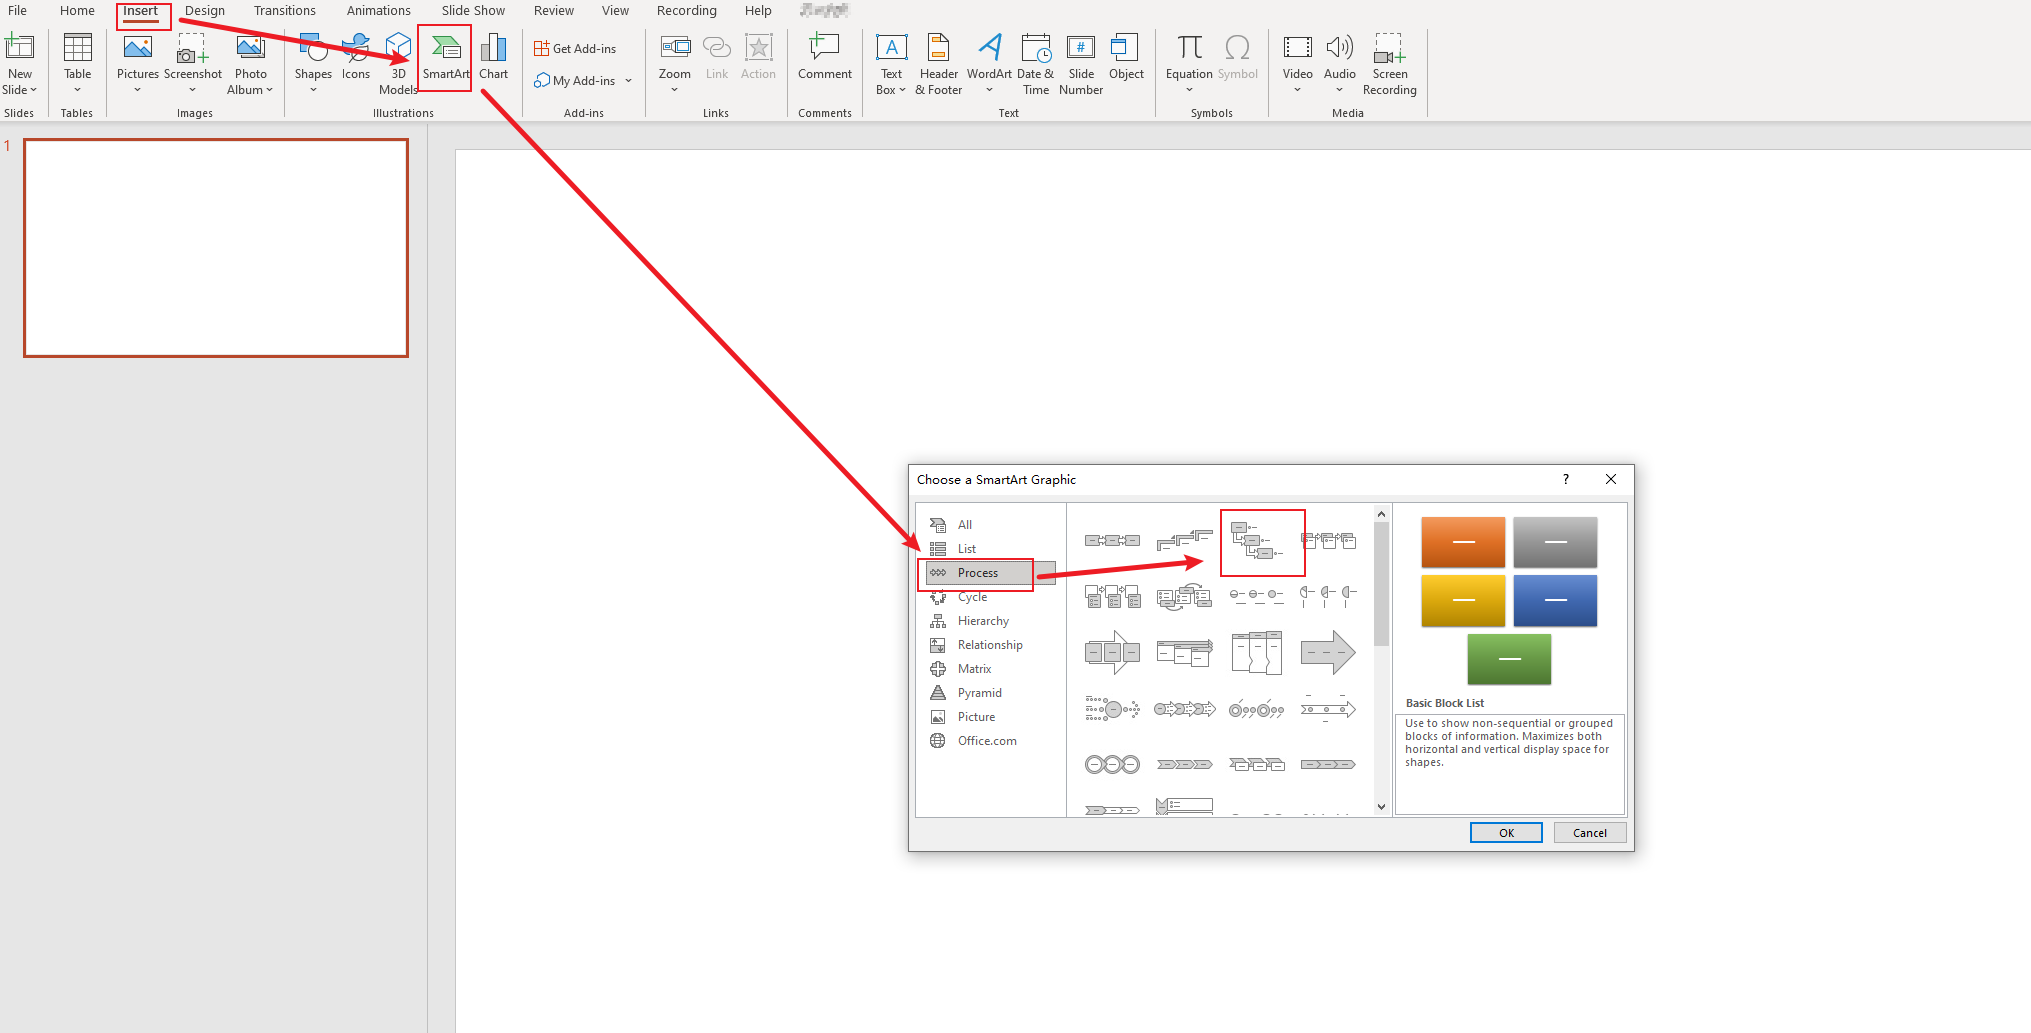
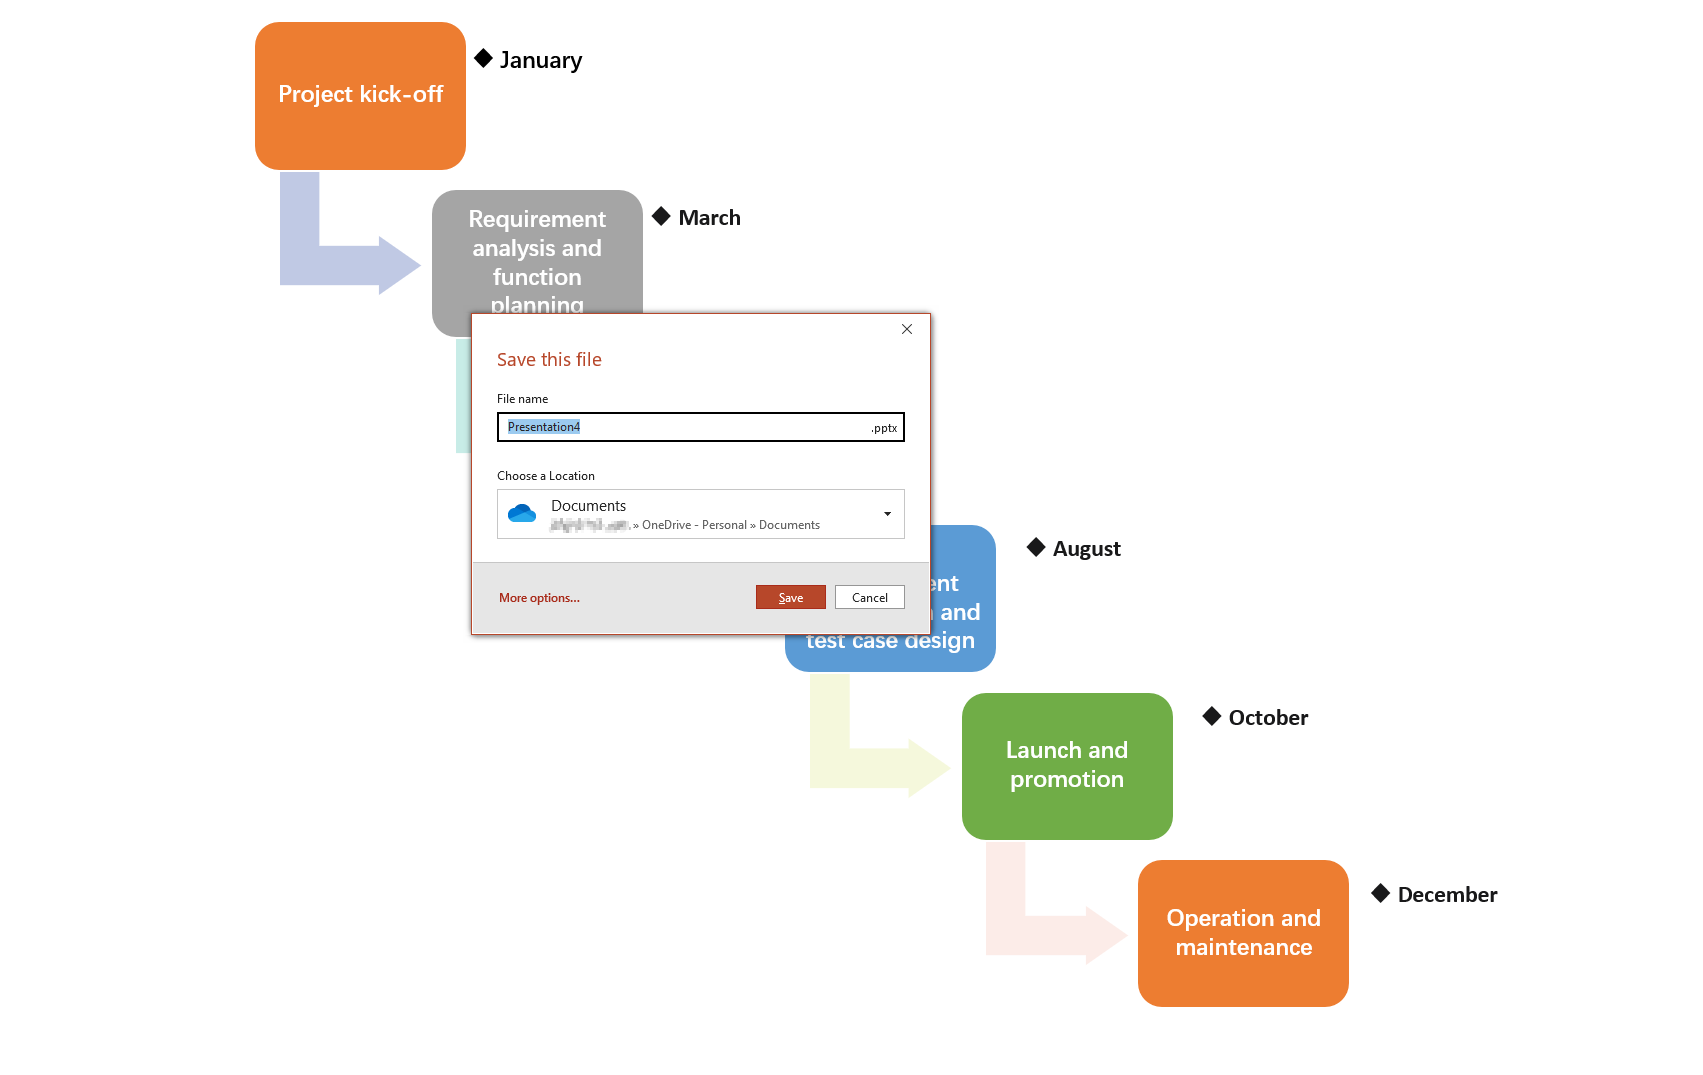
- Choose or Create a Layout: PowerPoint offers several SmartArt graphics perfect for timelines. To access these, click on "Insert", choose "SmartArt", and then select "Process". Pick the timeline design that suits your needs.
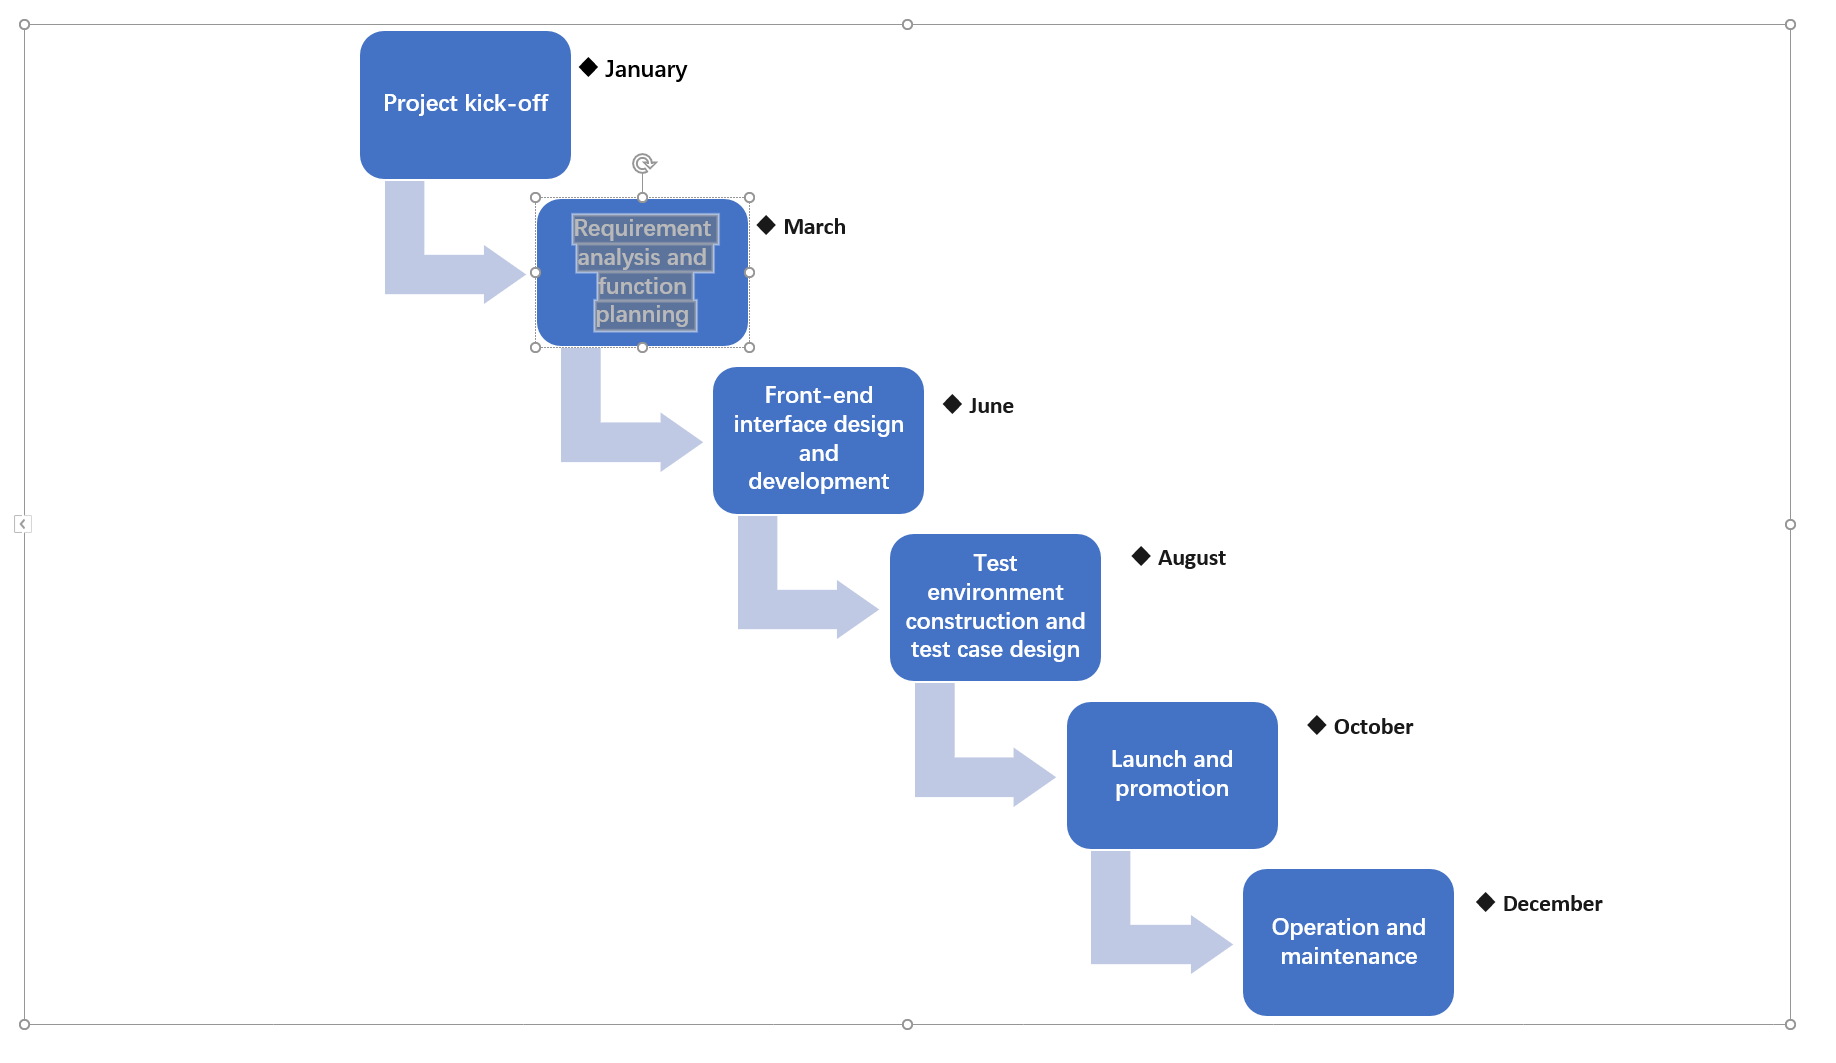
- Enter dates and milestones: open the SmartArt text pane and replace the placeholders. For an example launch plan, use “Research — 2 November”, “Review — 9 November” and “Launch — 16 November”. Use consistent date formatting.
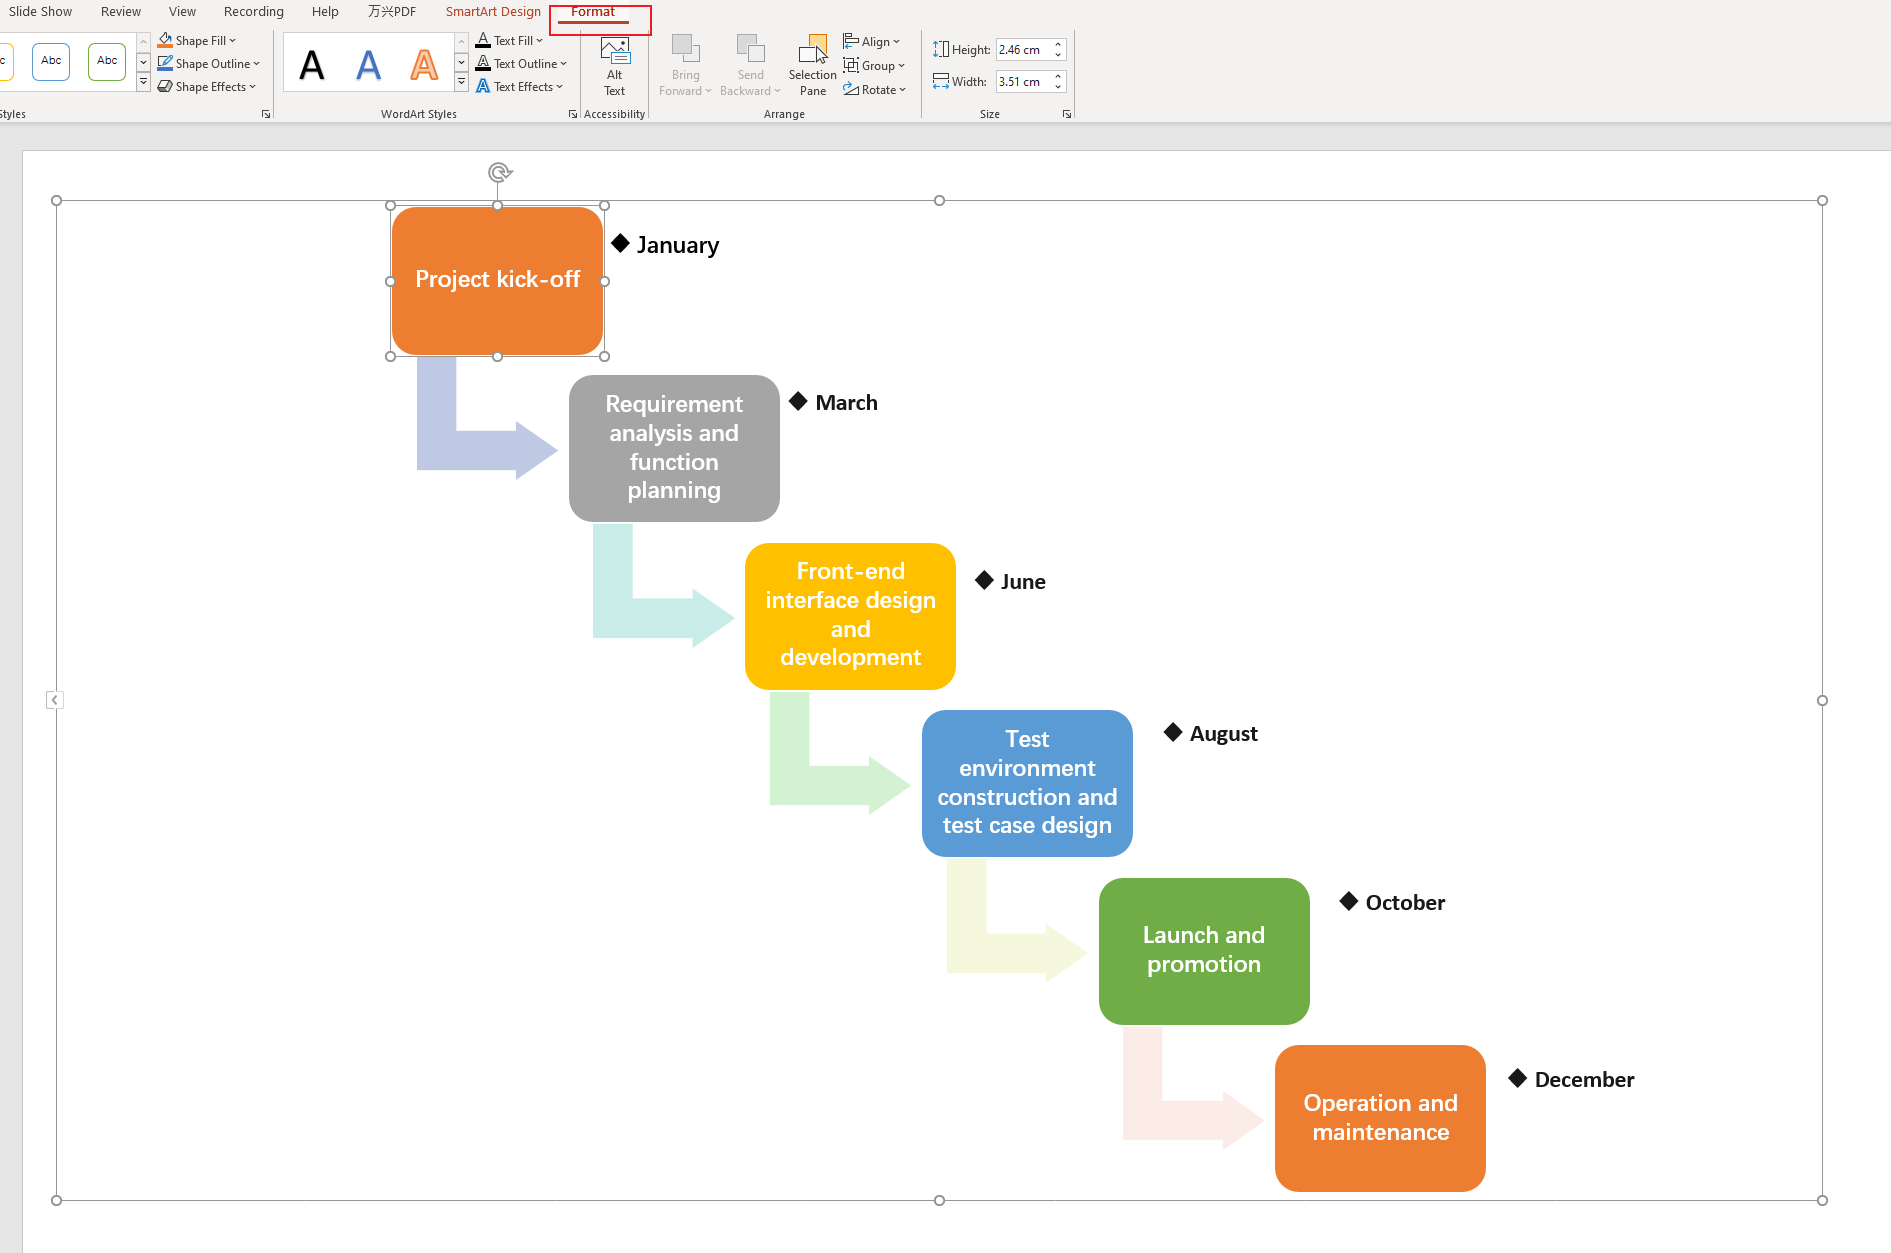
- Customize Your Timeline: PowerPoint offers various customization options. You can alter colors, add effects, adjust sizes, and more. To access these options, click on your timeline and use the 'Format' toolbar at the top of the screen.
- Check the reading order: confirm that milestones appear chronologically, dates are readable at presentation size, and longer labels do not overlap. Save the presentation after the review.
How to Create a Graphic Timeline in Boardmix
Boardmix is a collaborative online whiteboard. A timeline on its canvas can sit beside the planning notes, reference material and diagrams your team uses to discuss the schedule.
Firstly, you will need to log into your Boardmix account. If you don’t have one yet, head over to the Boardmix website and sign up for an account. Once done, log in to get started.

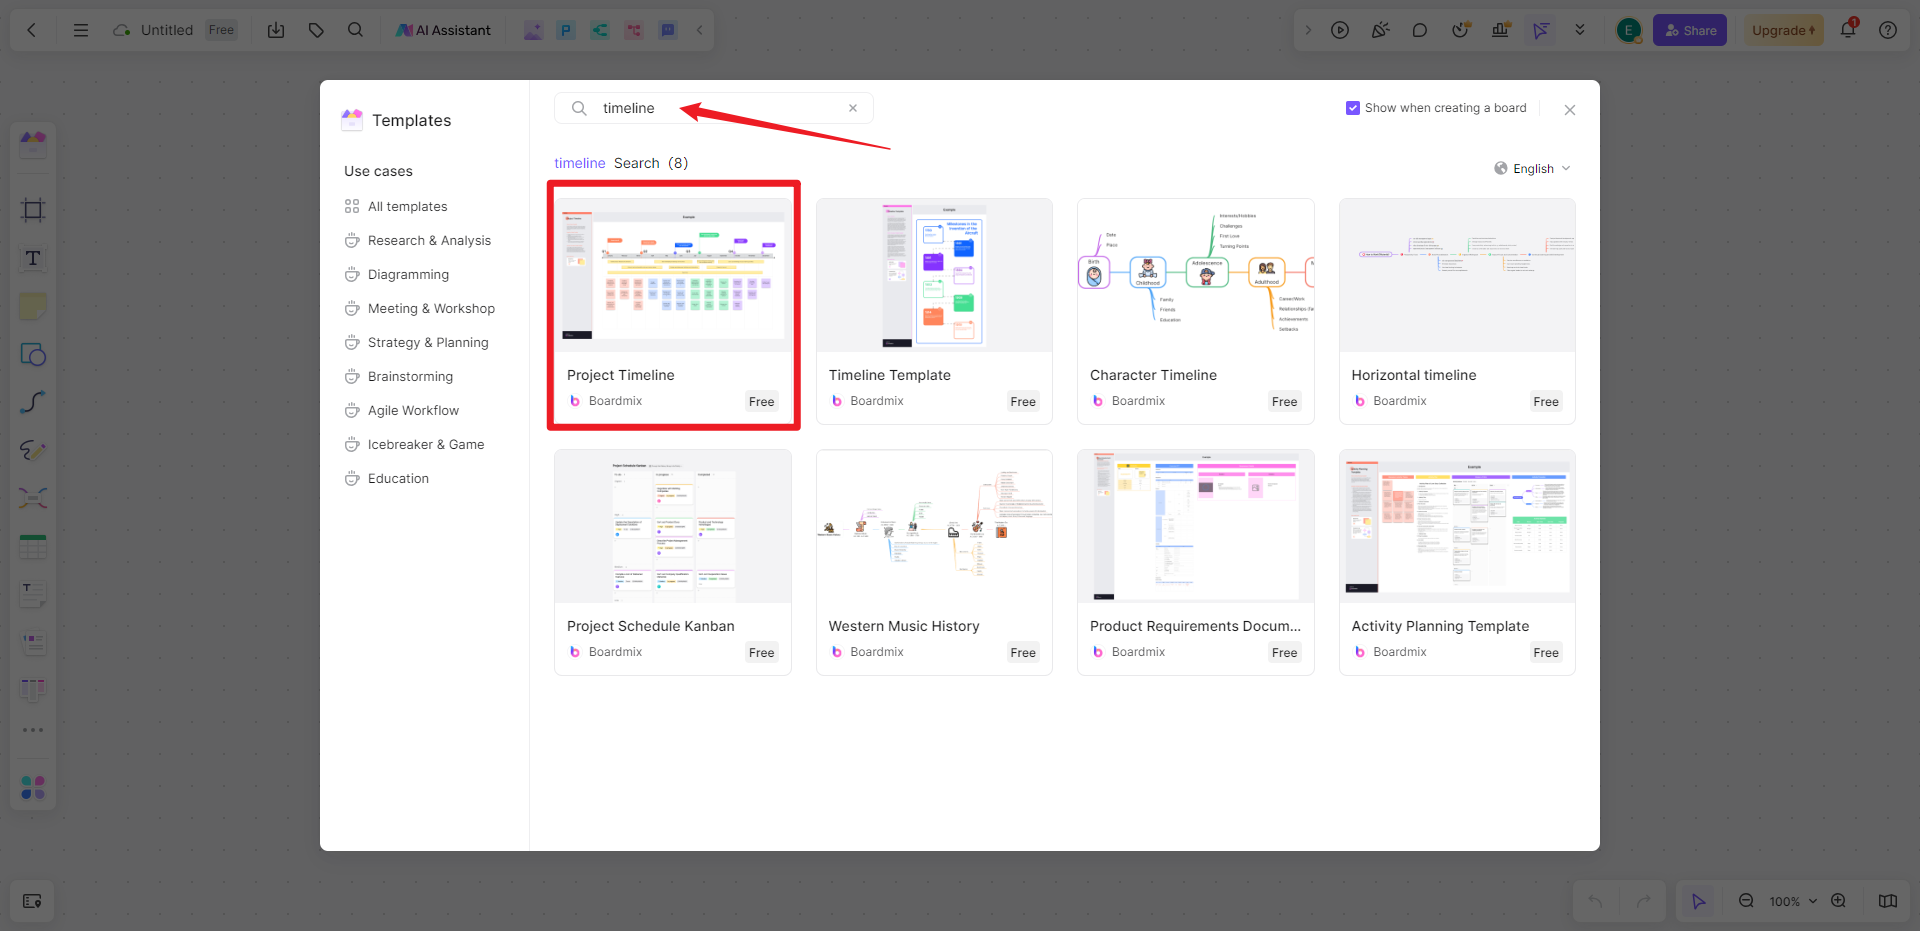
On your dashboard, click on the "New board" button and a blank canvas will be created. Click “Templates” from the left sidebar and search for a template that suits your needs.
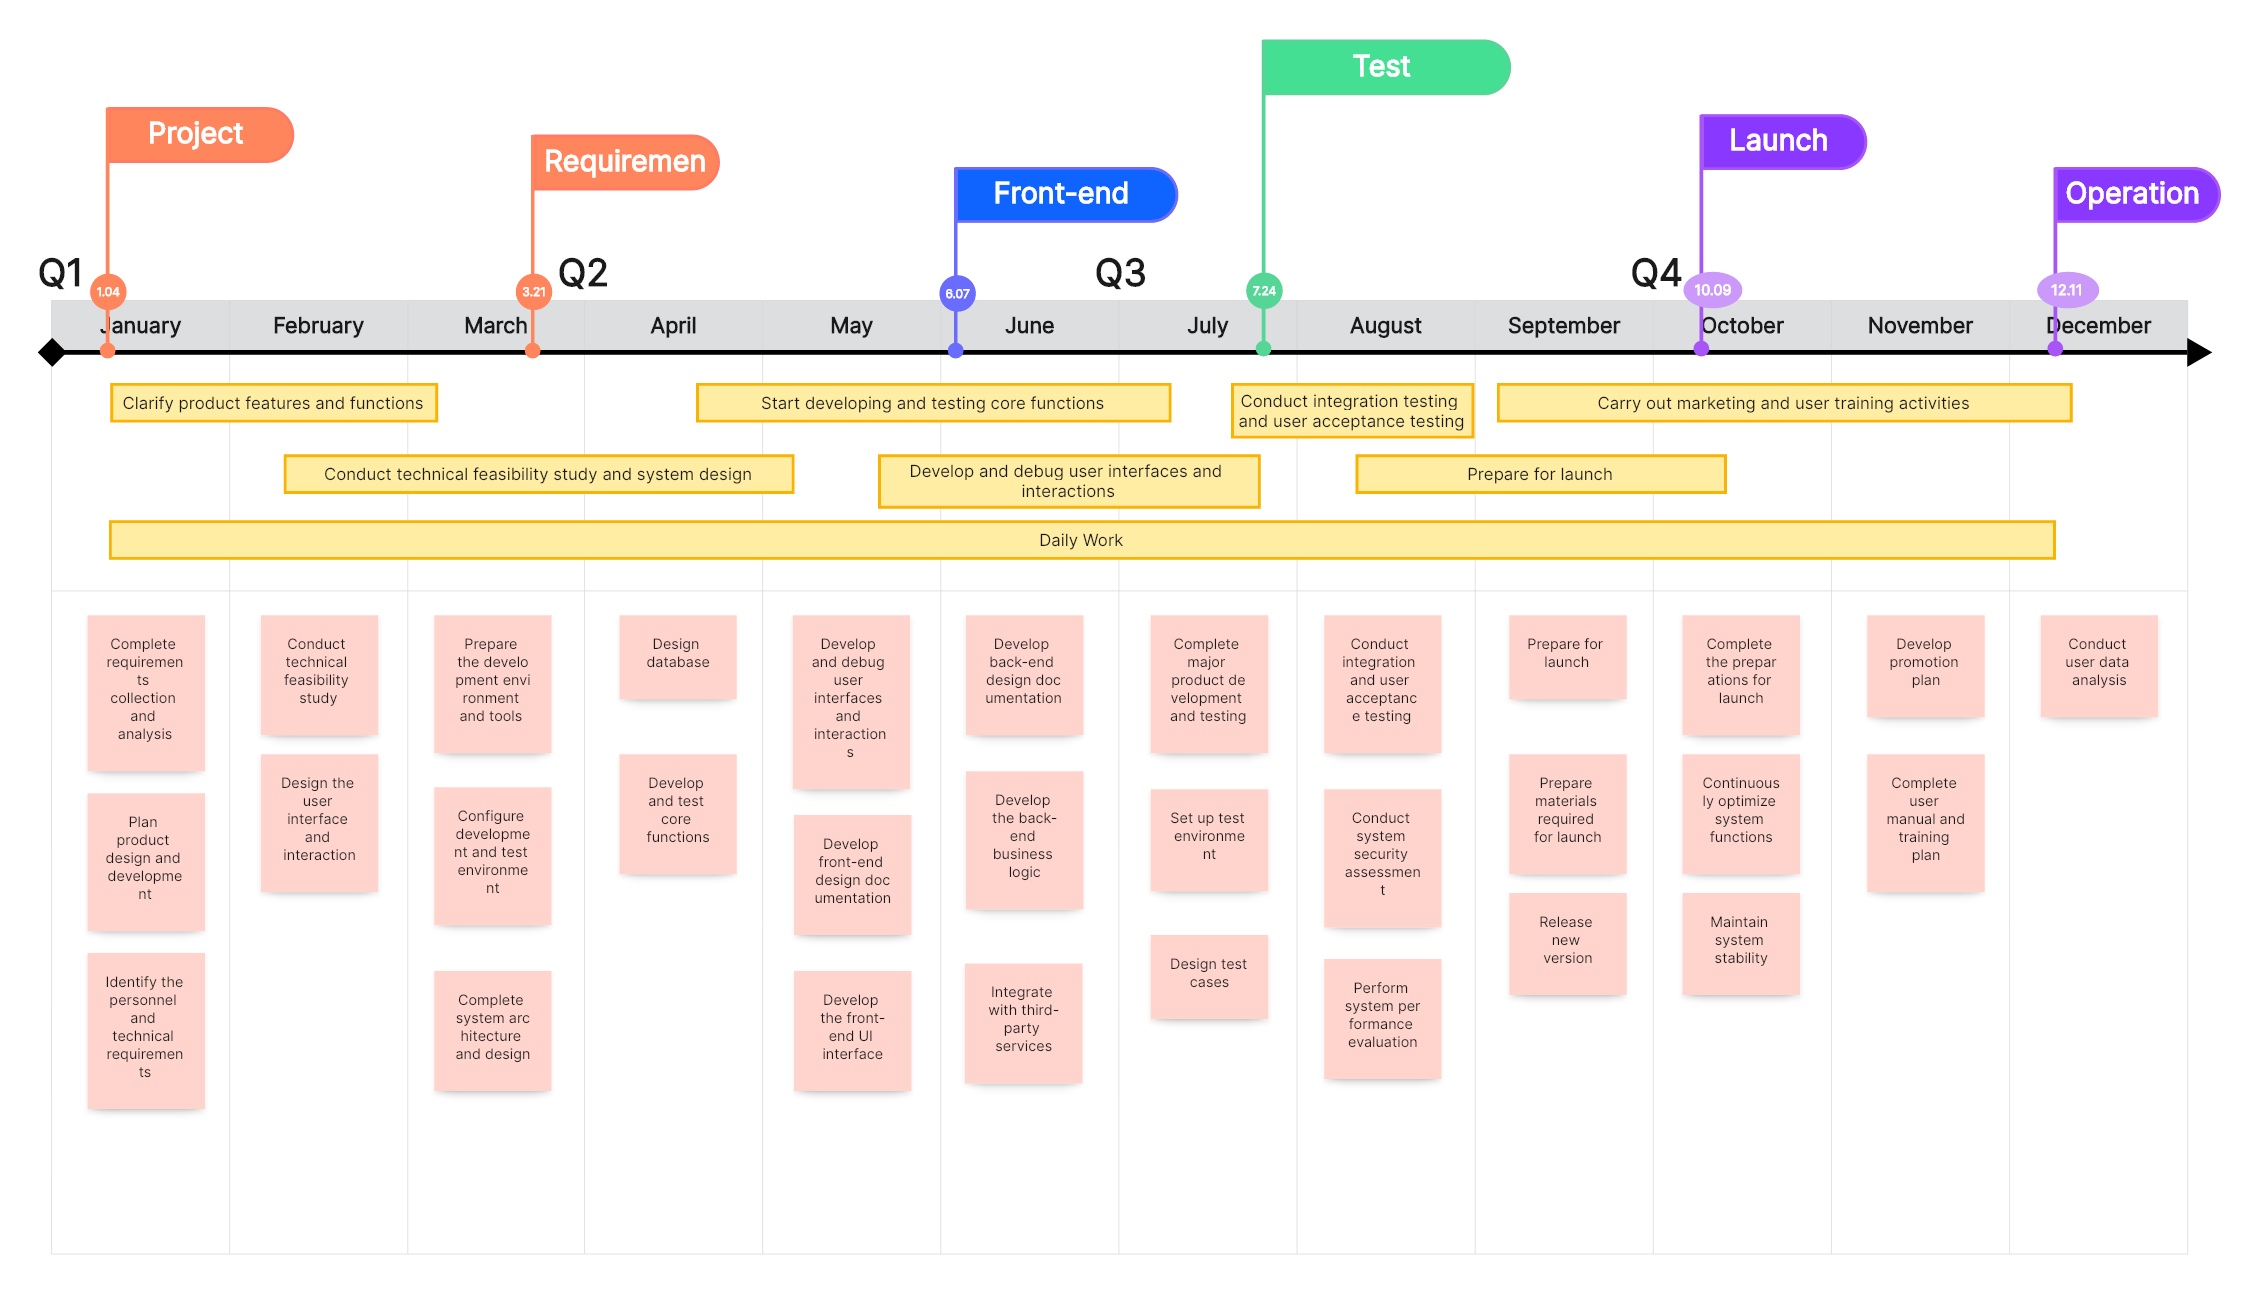
Add each task or milestone as a labeled object on the timeline. Include a planned date and an owner where useful. If you also use a Kanban layout, keep its task labels consistent with the timeline.
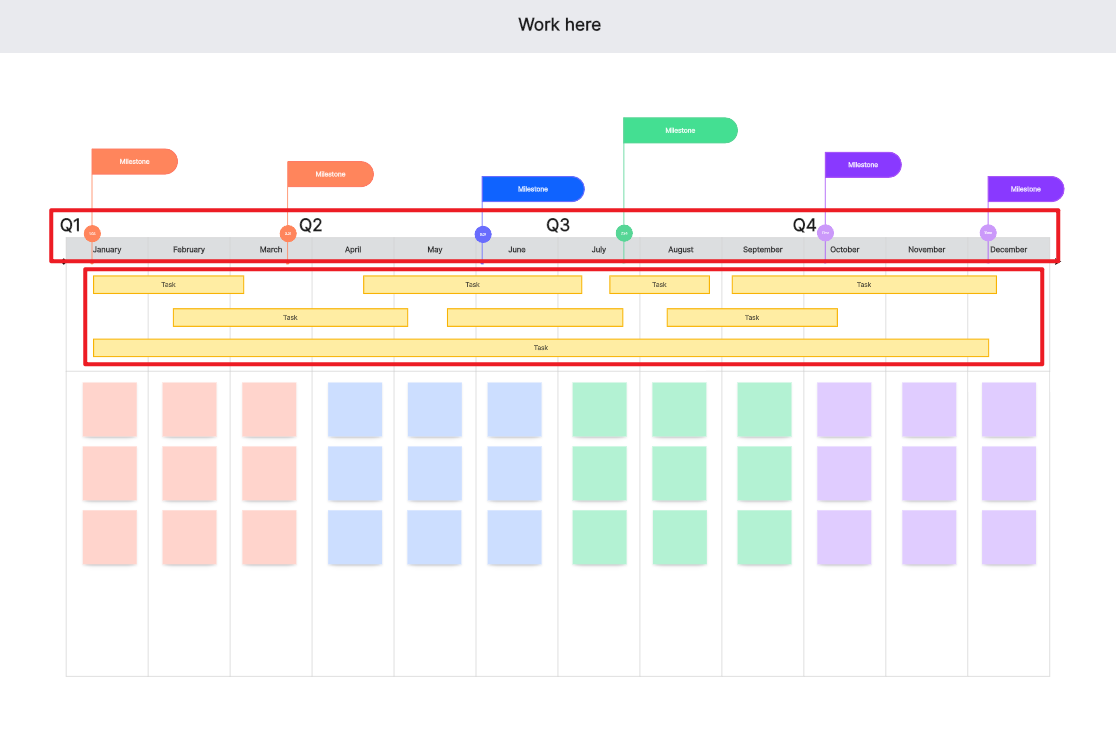
Use one color for milestones and another for work periods. Draw connectors to explain dependencies, and label any assumptions that may change the schedule. These are visual relationships rather than an automatic scheduling calculation.
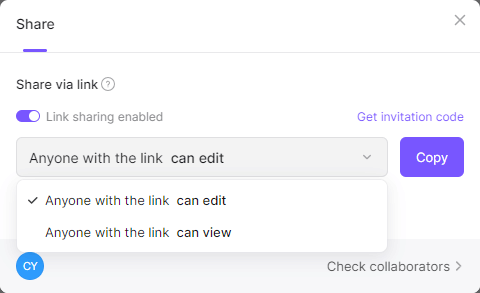
Use Share to invite teammates with the permissions they need. Ask owners to review their dates and add comments where a dependency is unclear.
It's important to regularly update your timeline as tasks progress or new tasks are added. Boardmix makes this easy with its intuitive drag-and-drop interface.
A shared timeline makes schedule discussions easier to follow. The team still needs to update dates, resolve dependencies and manage the work.
How to Choose: Create Graphic Timelines in Boardmix or in PowerPoint
Choose the format by how the timeline will be used: a slide for presenting a settled plan, or a canvas for developing it with the team. Both still need accurate dates and an agreed update process.
Boardmix for Creating Graphic Timelines
Boardmix offers space to discuss the timeline alongside related material.
Pros
- Planning context: place the timeline beside meeting notes, reference files and diagrams.
- Collaboration: Boardmix excels in collaborative capabilities. It allows multiple team members to view, edit, and comment on timelines in real-time.
- Editable visual layout: move timeline objects and update their labels as the plan changes.
- Dependencies: draw connections between related tasks; PowerPoint can also represent these with shapes and connectors.
Cons
- Learning Curve: Those unfamiliar with Boardmix may require some time to become accustomed to its interface and features.
- Plan limits: Boardmix has a Free plan and paid plans with different capacity and AI allowances. See pricing.
PowerPoint for Creating Graphic Timelines
PowerPoint is a versatile presentation software that can also be used to create timelines.
Pros
- Presentation format: place the timeline in the same deck as your project explanation.
- Customization: PowerPoint offers extensive customization options for color, style, and layout.
- Existing workflow: PowerPoint may already be part of your Microsoft subscription or software license.
Cons
- Slide space: a long schedule may need several slides or a simplified set of milestones.
- Coauthoring requirements: PowerPoint supports real-time collaboration when the presentation is shared through OneDrive or SharePoint with a supported version. See Microsoft’s PowerPoint coauthoring guide.
- Schedule maintenance: SmartArt dates and milestones need editing when the plan changes; the slide does not calculate a project schedule.
Use PowerPoint when the main output is a presentation. Use Boardmix when participants need space to develop the timeline beside notes and diagrams. For automatic scheduling or resource calculations, assess a dedicated project-scheduling tool.