


The BCG matrix, popularized by Boston Consulting Group founder Bruce Henderson in 1970, is a heuristic tool used by businesses as a guide for creating suitable strategies for each of their products. The brand portfolio is sorted into four categories, namely stars, cash cows, question marks and dogs, based on each individual product’s market share and growth rate.
In this BCG matrix analysis of Nestlé, we will take a close look at the many products offered by the company and see how they have been performing in their respective markets.
Background of Nestlé
In 1867, Henri Nestlé created an innovative baby food product and marketed it under the company Farine Lactée Henri Nestlé. A year earlier, brothers Charles and George Page had formed the Anglo-Swiss Milk Company. Over the next two decades, these two companies became rivals as both were manufacturing milk-based baby foods at the time. Eventually the two companies merged in 1905, becoming Nestlé and Anglo-Swiss Condensed Milk Company. A series of expansions followed and soon enough, the company was operating in the US, UK, Germany and Spain.
In the beginning, the company manufactured and sold primarily baby food and condensed milk but after the numerous expansions and acquisitions, their product portfolio also quickly expanded. Today, their massive product portfolio includes chocolates, coffee, noodles, bottled water, ice cream, dog food, and many more. Nestlé operates a broad food and beverage portfolio.
Nestlé BCG Matrix Analysis
Nestlé has a diverse portfolio of food and beverage brands across many markets. In this BCG matrix of Nestlé, we might see the reason why.
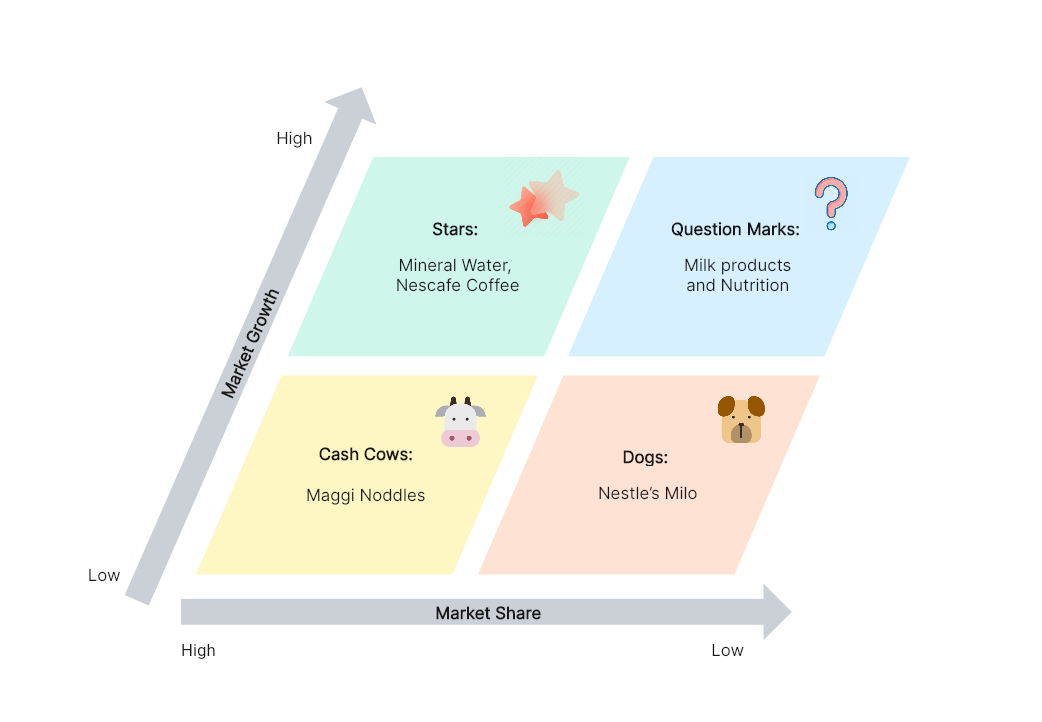
Nestlé BCG Matrix Analysis Created in Boardmix
The diagram uses selected Nestlé brands to illustrate the four categories; their actual positions depend on the country, category and year. Let’s take a look at the different products that fall into each of the categories.
Stars
Stars denote products securing substantial market share within a rapidly growing industry. The diagram places bottled water and Nescafe Coffee in this category as examples. Pure Life in the US and Canada was included in Nestlé’s North American water business sale completed in 2021, so ownership must be checked by territory. These products showcase immense potential for ascending to cash cow status with strategic investments. Their significant market presence, coupled with the high industry growth rate, offers an advantageous blend for swift progression. By capitalizing on this trajectory, Nestlé can expedite their journey from star to cash cow, enhancing their position within the market and bolstering sustained profitability.
Question Mark
Question marks have low relative market share in high-growth markets, whether or not the products are newly developed. Nestlé’s question marks are their various milk products and chocolates, not because these products are not superior (they are). In some parts of the world, these products have actually already turned into stars. But in general, there is steep competition in these markets and high investment would be needed for these products to become leaders in the niche, and so there is still a chance that they might eventually find themselves in the Dog category.
Cash Cows
Cash cows have high relative market share in low-growth markets and can generate cash beyond their reinvestment needs. Nestlé's BCG matrix prominently features Maggi Noodles in this category as an illustrative placement. Evolving into a beloved staple, this product has cultivated a steadfast consumer following, solidifying its role as a consistent revenue generator in Nestlé's portfolio. Customer loyalty can support sales, but the quadrant still depends on measured relative share and market growth and may change over time.
Dogs
Dogs have low relative market share in low-growth markets. Maintaining them might require too much of an investment to be feasible for the business. Milo is placed here as an example in the diagram. A dog classification would need evidence of low relative share and low market growth in a specified country and beverage category.
Key Takeaways
The BCG matrix of Nestlé clearly shows which brands have been contributing significantly to the success of the company, and which have not really generated much revenue. Maggi Noodles have been the company’s cash cow for a long time, while Nescafe and Nestlé Waters might soon be joining this revenue-generating category as well. Product managers might have to look more closely at the milk products and chocolates to determine whether investing in them further would be worthwhile and could turn these products into stars.
A BCG matrix can really influence a company’s decisions when it comes to creating marketing and positioning strategies for their products. For a company such as Nestlé that has a very diverse range of offerings, it can be somewhat of a challenge to create a BCG matrix, with all the data that need to be taken into consideration. But the process will be much easier by using a well-designed BCG matrix template, just like the one available at Boardmix.
Try For Free
Boardmix offers a wide selection of mind-mapping tools that are very useful for planning business strategies. They have very easy-to-use tools and fully customizable templates that you can modify to fit your specific business needs.
References
https://www.Nestlé.com/about/history/Nestlé-company-history
https://heartofcodes.com/bcg-matrix-of-Nestlé/
https://en.wikipedia.org/wiki/Nestl%C3%A9
https://www.macrotrends.net/stocks/charts/NSRGY/Nestlé-sa/net-worth


