


Whether you're a sneakers fan, an athlete, or do not care about shoes, you may have heard about Nike for once in your life. The brand's popularity is vast. However, the company started as a small-scale business producing just several shoes.
With a BCG matrix of Nike, you'll see the products that made a significant mark in the industry. Its matrix is also an excellent basis for companies looking to segment their products and see which generates the most revenue and covers the broadest market reach.
Background of Nike
Nike is one of the top manufacturers of accessories, footwear, and apparel. It includes some of the popular brands in the industry. The company was founded in 1964 with a headquarters in Beaverton, Oregon. Before it became Nike, Bill Bowerman and Phil Knight, who founded the company, named it Blue Ribbon Sports. The Nike brand was first introduced in 1966 as the two opened their shoe retail outlet. They changed the company's name to Nike Inc. in 1978 and decided to make it public after two years. There might have been hurdles along the way, but Nike continues to do better in innovating and keeping its market interested in their brands.
Nike is regarded as one of the biggest suppliers of shoes and athletic apparel. You know it's Nike because of the famous slogan 'Just Do It.' The company operates in various regions worldwide, including Africa, Europe, the United States, Asia Pacific, the Americas, and the Middle East. With the intense competition, it's impressive that Nike has solidified its brands in their target markets.
Nike BCG Matrix Analysis
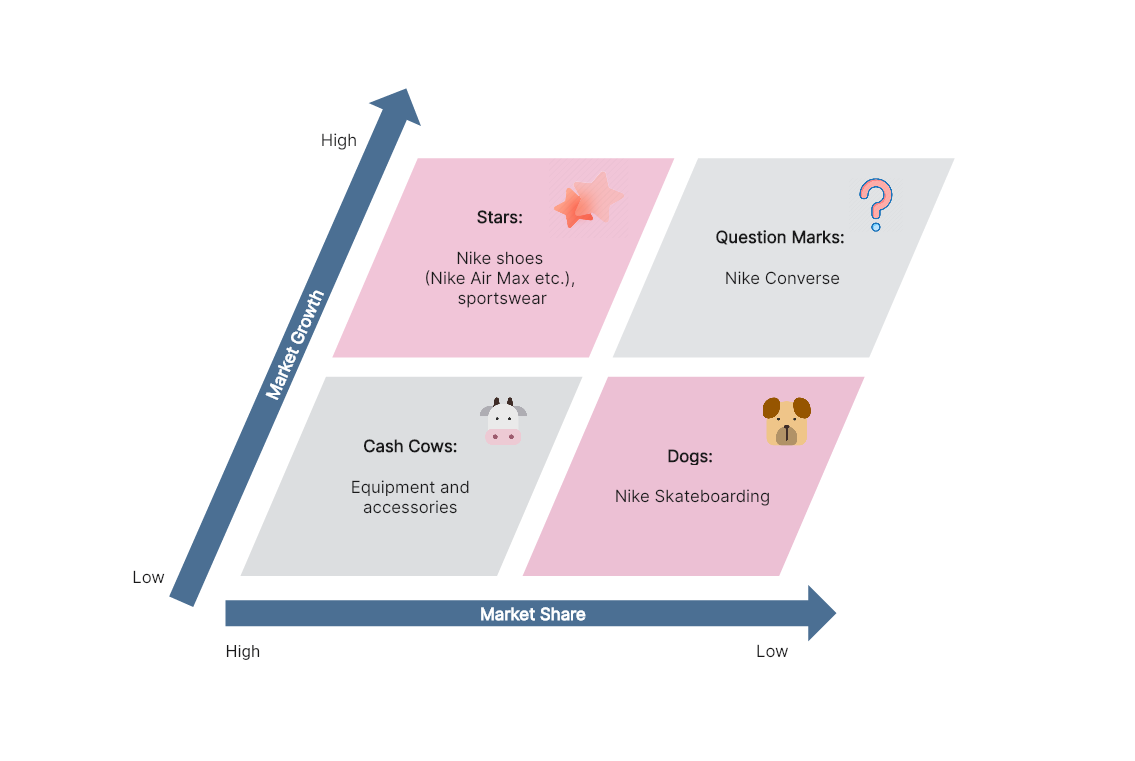
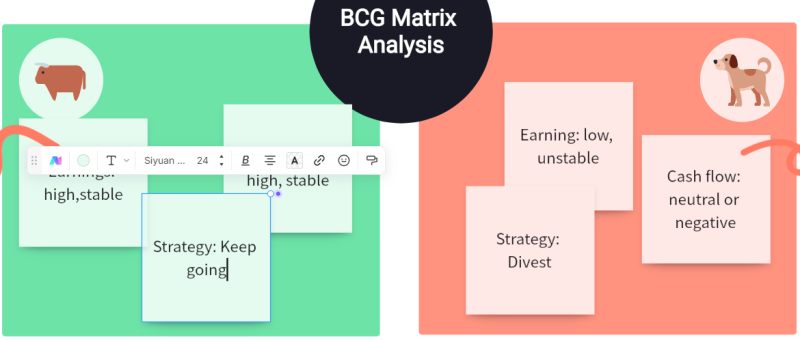
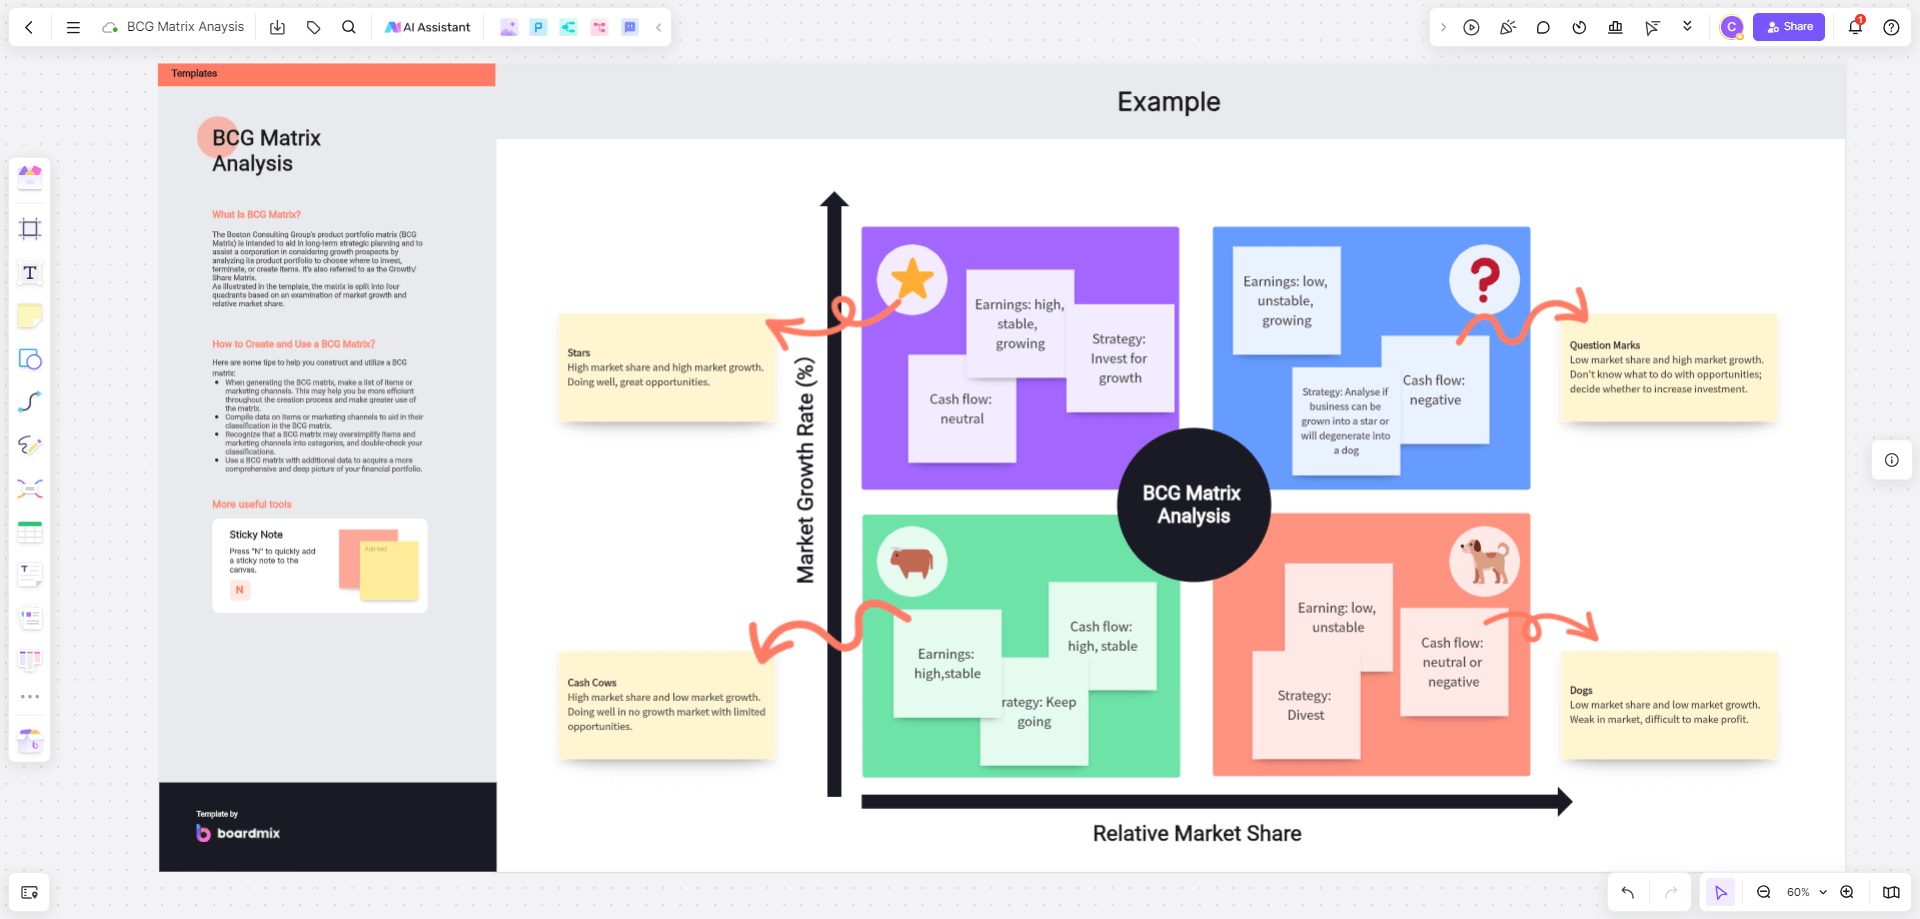
To understand Nike's positioning, marketers and strategists must see how they visualize its BCG Matrix of Nike. There are four sections you must consider when creating the BCG matrix. This includes Stars, Question Mark, Cash Cows, and Dogs. See the diagram below.
Stars
The products under this quadrant are the leading cash generator and have the business's highest market growth. The company must sustain the profitability of these products through growth strategies and initiatives so they will stay in the Cash Cows quadrant.
The BCG Matrix of Nike shows that the company considers Nike shoes and sportswear the Stars. These products are the primary sales drivers for them. The ever-famous Nike Air Max continues to be in demand from many customers, including athletes and sneakers enthusiasts. As you can observe, Nike continues to innovate their shoe brands, adding features and styles like the React and Vapor Max for better user experience.
Question Mark
Some consider this the company's problem child. These products have a high market growth but lower market growth. There are also instances when the products are still in development, so an excellent strategy might yield better results for the Question Marks.
The BCG Matrix of Nike considers the Nike Converse as the question mark. The brand is not even used by many customers now; some abandon it entirely and switch to Nike's competitors. Nike placed Converse under this quadrant since they believe specific growth strategies can still improve its scope in the market.
Cash Cows
The cash cow quadrant in the matrix represents the market leader, bringing in more of the company's revenue. These products here have more market share but have low growth share. Despite its low market growth, it still consistently provides cash. In some cases, the products under this quadrant have a mature market share; hence, the company continues to receive sales from the cash cows.
The equipment and accessories are under the cash cow quadrant for the BCG Matrix of Nike. The company uses celebrities and famous personalities to endorse these products to expand its market.
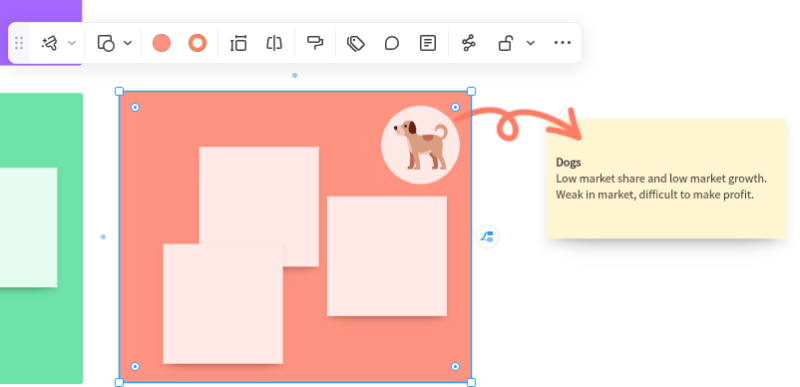
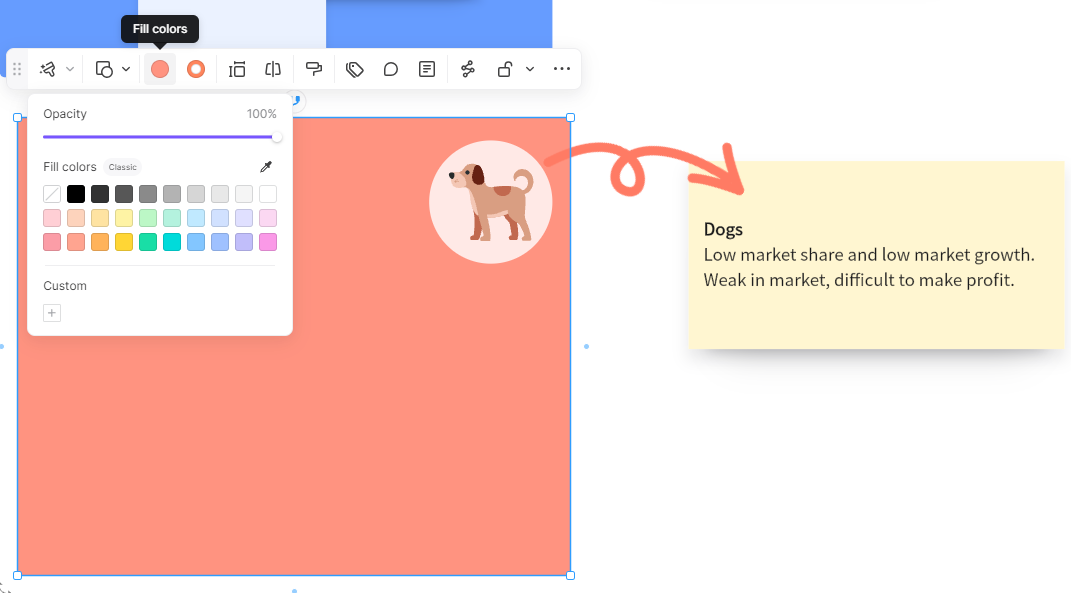
Dogs
These products consumed little investment and provided enough profit for the company. All they do is break even. Some companies still fund the manufacturing of such products, while others abandon them entirely and discontinue their production. In short, dogs do not make significant contributions to the company.
The BCG Matrix of Nike places Nike SB or Nike Skateboarding under the dog quadrant. It does not cover a significant market share and market growth. If you look at the skateboarding community, the Nike SB is not considered the primary brand. As a result, the product got little support from its target market.
Nike SB is still present in the BCG Matrix of Nike today, though the product had a brief hiatus. The company brought back and updated its Nike SB Zoom Stefan Janoski OG and hopes to get better responses from the market this time.
Create BCG Matrix on Boardmix: Step-By-Step Guide
The Boston Consulting Group (BCG) Matrix is a vital tool for strategic management, allowing you to visualize a company's product portfolio and identify growth opportunities. Here's how you can create a BCG Matrix on Boardmix:
1. Login and Create a New Board
First, log into your Boardmix account. Once logged in, click on ‘New Board'. This gives you a fresh canvas to work on.

2. Draw the BCG Matrix Grid or Use a Template
The BCG Matrix consists of a 2x2 grid. Use the ‘shape' tool in the toolbar to create this grid. You will need two perpendicular lines intersecting in the middle to form four quadrants. You can also search for the BCG Matrix template in the template library and use it for free.
3. Label the Axes
Next, label your axes. The y-axis usually represents the market growth rate, while the x-axis represents the relative market share. You can add these labels using the 'text' tool from the toolbar.

4. Add Quadrant Labels
Each quadrant in the BCG Matrix represents a different product category: Cash Cows (high market share, low market growth), Dogs (low for both), Stars (high for both), and Question Marks (low market share, high market growth). Use the text tool again to add these labels.
5. Plot Products
Start plotting your products or business units in the appropriate quadrants based on their market share and growth rate. You can use different shapes or colors for each product to make them distinguishable.
6. Customize Your Diagram
Boardmix offers various customization options. Feel free to change colors, add patterns, or adjust sizes as needed to create a visually engaging BCG Matrix
 .
.
7. Add Notes or Annotations
If needed, add any notes or annotations for clarification using the text tool. This can be especially helpful when sharing your BCG Matrix with others who might not be familiar with all the products or units plotted.
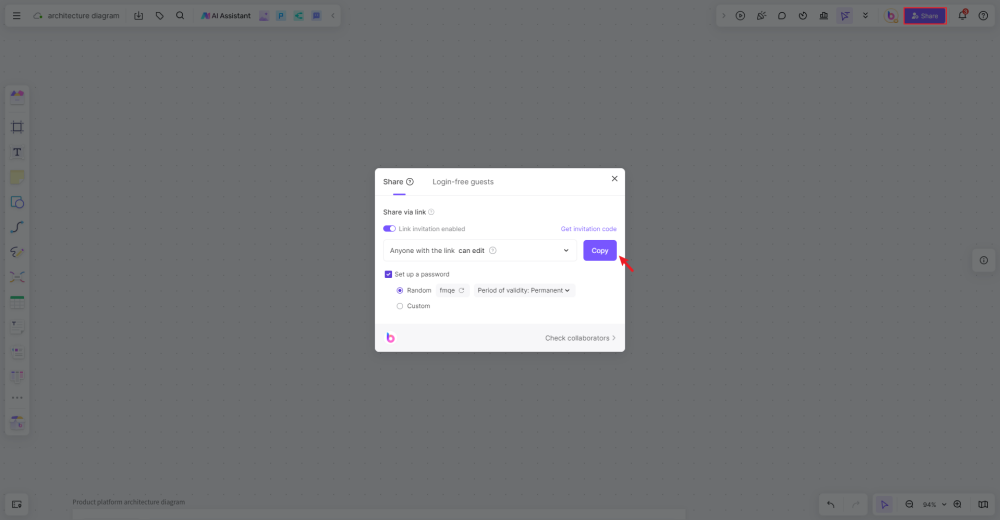
8. Save and Share Your BCG Matrix
Once you're happy with your BCG Matrix, save it on Boardmix's secure cloud storage for future reference. You can also share your diagram with colleagues or stakeholders via email or direct link.
Creating a BCG Matrix on Boardmix can significantly enhance your strategic planning process by providing a clear visualization of your product portfolio's current state and highlighting potential areas of growth or investment.
Key Takeaways
The BCG Matrix of Nike is an excellent illustration for companies with various products under the dog segment who want to revive some of them for better results. It's evident that Nike SB did not have a significant following, but Nike reintroduced classic products under the brand. While it still has to generate revenue, the fact that it did not discontinue the production means Nike is hopeful the product will soon be promoted to higher quadrants in the BCG Matrix of Nike.
Creating the BCG matrix is also easy, given that you understand what each quadrant means. You can also make it more fun by using pre-built templates at online platforms like Boardmix. This means you need not create a new diagram. All you need is access to these templates and tweak some sections to make it your own. Check on Boardmix's BCG matrix templates here to start. After creating the matrix, share it with your peers and colleagues through a unique link available on the workspace page.

References
Nike, Inc. (2023, August 24). https://www.britannica.com/topic/Nike-Inc
BCG Matrix of Nike. (2018, December 9). https://bcgmatrixanalysis.com/bcg-matrix-of-nike/


