

Using the right tools is crucial for improving efficiency and effectiveness. The Boston BCG Matrix is a classic strategic planning tool that many consultants rely on. This article introduces an essential tool for consultancy analysis—Boardmix. By examining a real case, we'll demonstrate how to use Boardmix to master the Boston BCG Matrix model!
What is the Boston BCG Matrix Analysis?
The Boston BCG Matrix Analysis, developed by the Boston Consulting Group, is a strategy for planning a company's product portfolio. Its core purpose is to achieve a balance in cash flow through an optimized business mix. The BCG Matrix primarily analyzes a company's situation from a business perspective, aiming to optimize resource allocation or develop strategic transformation and development plans. It's particularly useful for companies with complex business lines, growing user bases, and uncertain future directions.
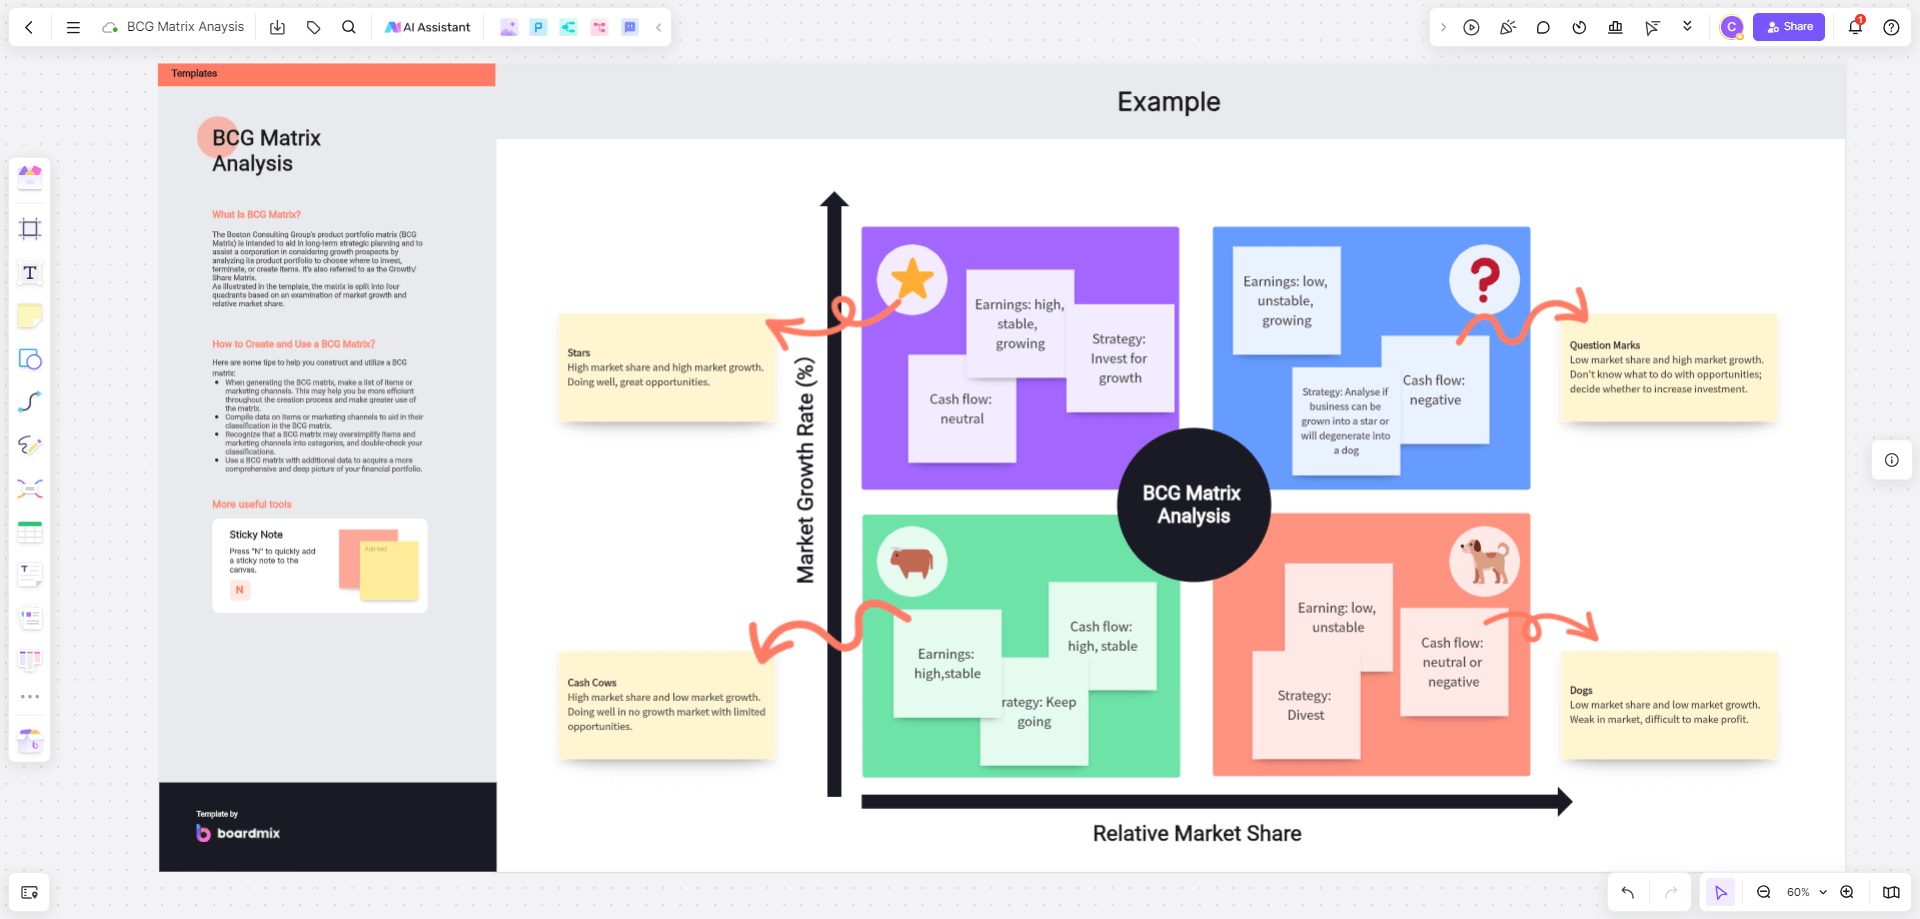
To quickly use the Boston BCG Matrix, open the Boardmix online whiteboard in your browser, and select the "Boston BCG Matrix Analysis Template" from the community resources to apply it for free with just one click.
Basic Principles of the Boston BCG Matrix Analysis
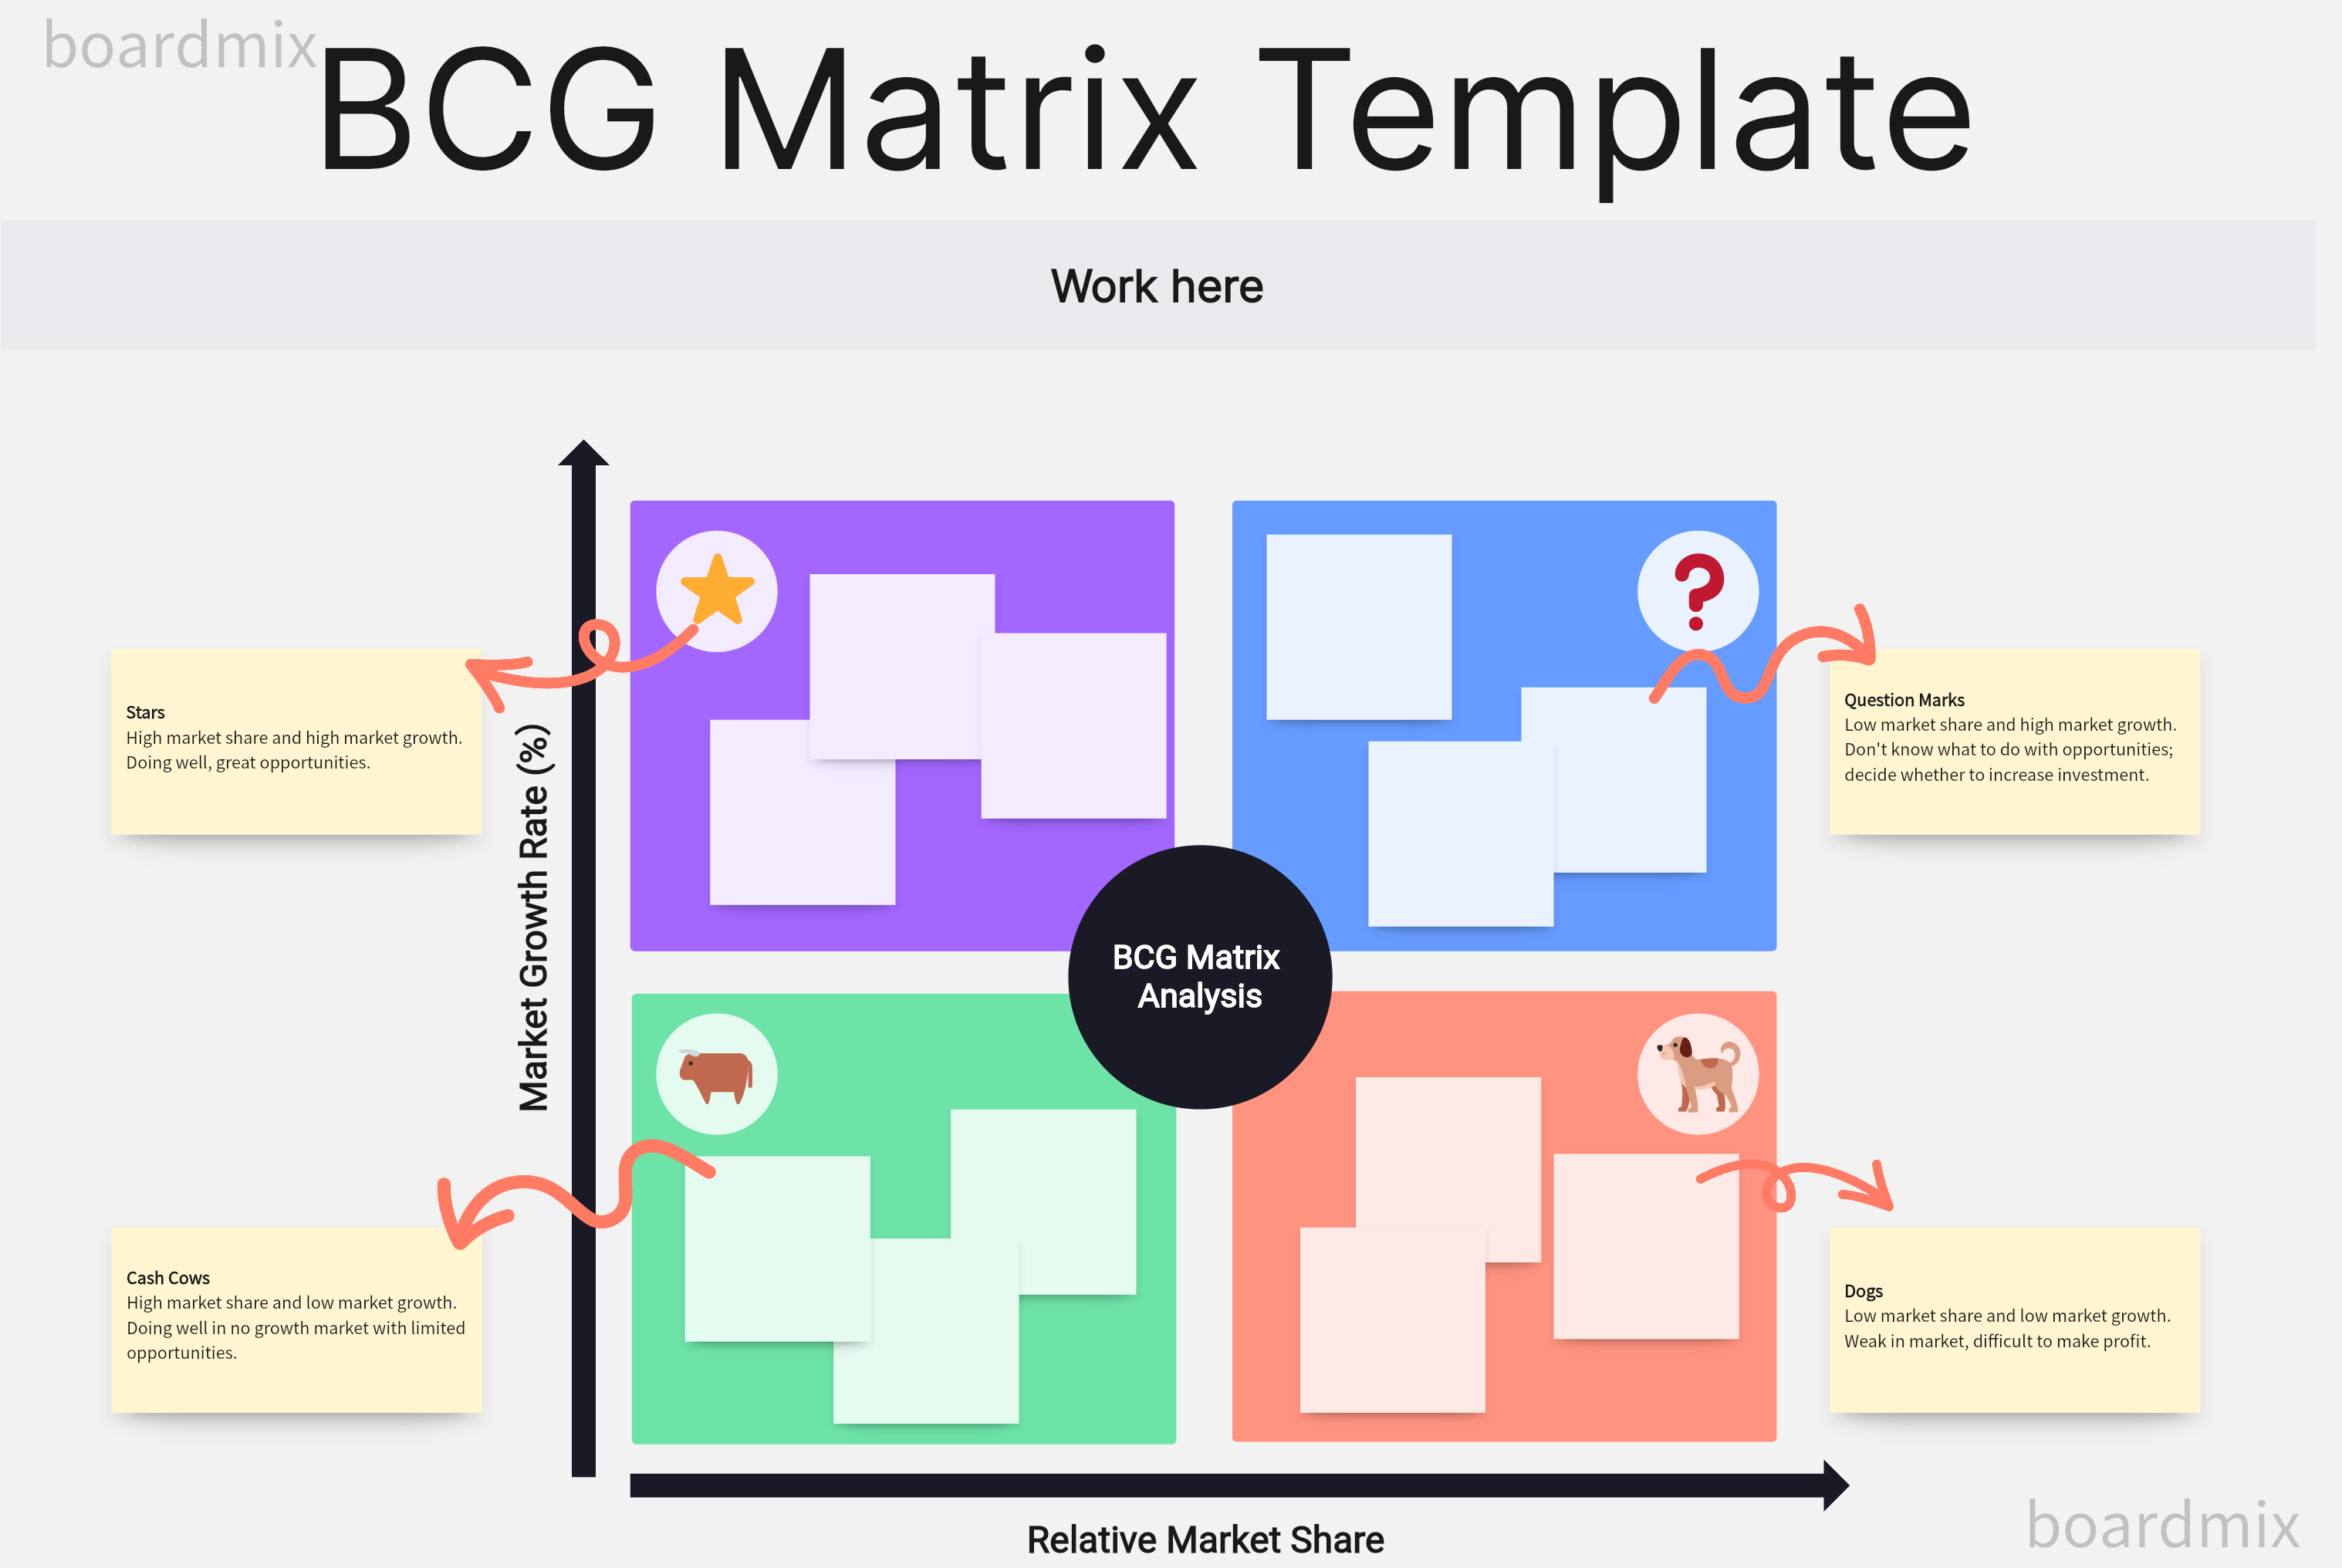
The Boston BCG Matrix analyzes future product resource allocation based on market share and sales growth rate. On the BCG Matrix chart, the vertical axis represents the business growth rate, and the horizontal axis represents market share, dividing the chart into four quadrants: "Stars," "Question Marks," "Cash Cows," and "Dogs." These quadrants represent different product types and development prospects:
-Star Products: High sales growth rate and high market share
-Question Mark Products: High sales growth rate but low market share
-Cash Cow Products: Low sales growth rate but high market share
-Dog Products: Low sales growth rate and low market share
As shown in the diagram, the Boston BCG Matrix can categorize products into different types based on various dimensions and develop corresponding management strategies. Numerous such templates are available in the Boardmix community.
Specifically, companies can make different product analysis and planning decisions based on the quadrant a product falls into. They can eliminate "Dogs" with no growth potential, maintain a balanced mix of promising "Stars," "Question Marks," and "Cash Cows," and ensure a positive cycle of product and resource allocation. The specific marketing strategies are:
-Star Products: Maintain or increase funding, actively expand economic scale and market opportunities, aim for long-term benefits, and strengthen competitive position.
-Cash Cow Products: Consolidate current market share, consider further market segmentation, and potentially move the product to a second growth curve.
-Question Mark Products: Adopt a selective investment strategy.
-Dog Products: Reduce production, gradually exit the market, and focus resources on "Stars" and promising "Question Marks."
Analyzing Coca-Cola with the BCG Matrix
After developing a popular product, companies often expand their product line to enrich their brand's product portfolio. Let's analyze Coca-Cola using Boardmix and the Boston BCG Matrix.
Case Study: Coca-Cola Company Background
In the Chinese market, Coca-Cola has a multi-brand strategy covering sodas, diet sodas, teas, and juices. How does Coca-Cola maintain its consumer appeal while occupying different beverage market segments?
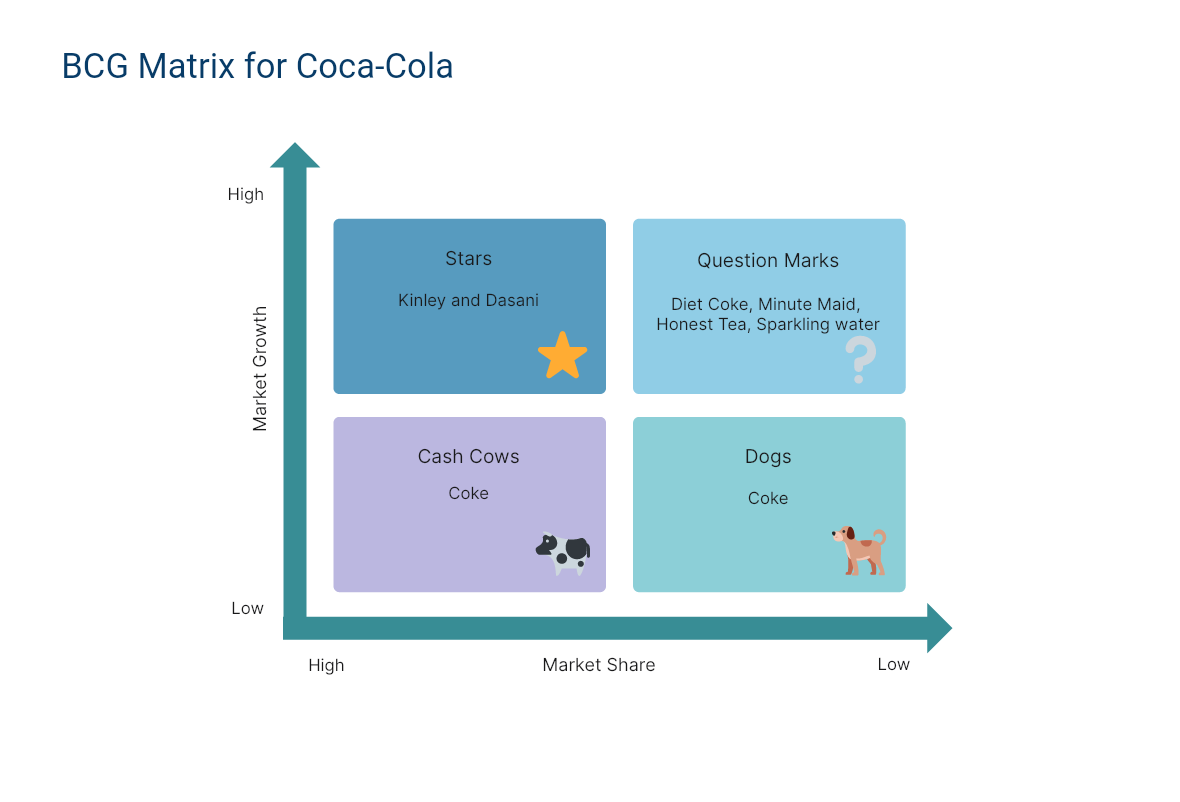
Based on the Boston BCG Matrix principles, Coca-Cola's product marketing strategy is as follows:
-Original Coca-Cola: A Cash Cow with high market share and low growth rate, consistently generating cash flow for the company.
-Diet Coke: A Star product, leading the sugar-free beverage market in China with a 61.5% share in 2021. Although it's a subcategory of sodas, it requires continuous market cultivation and expansion.
-Flavored Colas (Coffee, Cherry): Question Mark products needing market validation to determine which can become Stars and which will turn into Dogs.
-Dog Products: Flavors that were once available but are no longer on the market, discarded due to insufficient profitability.
Through Coca-Cola's BCG Matrix analysis, we see how the model effectively evaluates a company's product portfolio and investment strategy. By using the Boston BCG Matrix, business operators can understand the current product structure and predict future market changes, enabling them to develop correct marketing strategies.
With the efficient Boardmix tool, any product can be easily analyzed using the Boston BCG Matrix, leading to better market decisions. Boardmix's powerful compatibility supports online editing, real-time saving, multi-user collaboration, annotation, marking, sharing, and commenting, allowing deeper exploration of product content and more efficient management.


