


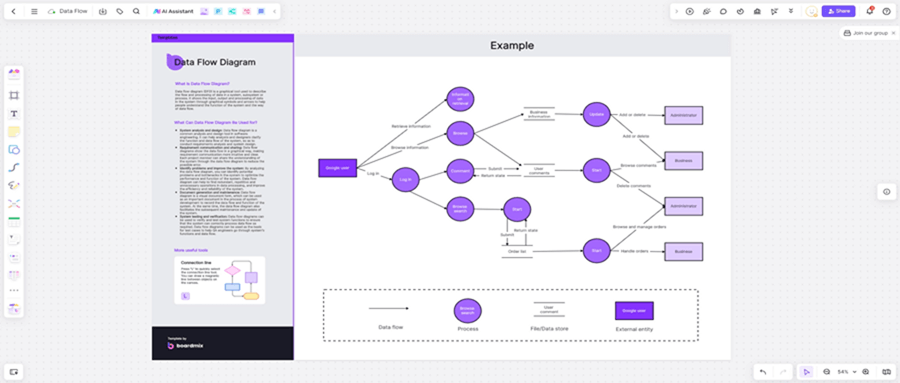
Data Flow Diagram(DFD), is used to express how business data information flows. From the perspective of data transmission and processing, it graphically describes the logical functions of the system, the logical flow of data within the system, and the logical transformation process. It visualizes the data transmission between processes, data storage, and entities external to the system.
What is a Data Flow Diagram?
A data flow diagram is not a traditional flowchart or block diagram, and data flow is not a control flow. A data flow diagram describes a system from the perspective of data, while a block diagram describes the system from the perspective of the staff who process the data.
DFD shows what information will be input and output from the system, how data will progress through the system, and where the data will be stored. It does not show information about process timing, nor information about whether processes will run sequentially or in parallel, unlike traditional structured flow diagrams, which focus on control flow, or UML activity workflow diagrams, which combine control flow and data Flow as a unified model.
The data flow diagram includes:
• Data symbols that indicate the presence of data. These data symbols may also indicate the medium that is used.
• Processing symbols that indicate the processing performed on the data. These symbols may also indicate the machine functions used in the processing.
• Streamline symbols indicating the flow of data between several processes and data media.
• Special symbols that facilitate reading and writing of data flow diagrams.
Free Data Flow Diagram Making Tool
Whether you are drawing a data flow diagram or other types of diagrams, to facilitate presenting the diagram content intuitively and logically, different symbols are usually used to distinguish different types of content.
The Boardmix whiteboard has built-in many categories of graphic symbols, including commonly used graphic libraries, connecting lines, mind maps, tables, notes, process flows, entity relationships, circuits, etc. To facilitate the drawing of data flow diagrams, we can directly select [Data Flow Diagram] in the Boardmix graphics library to check the classification to be used and "Apply", which is a professional data flow diagram drawing software.

Features of data flow diagram software in Boardmix whiteboard:
• The whiteboard has various built-in visualization tools, including pictures, documents, multi-dimensional tables, formulas, sticky notes, hyperlinks, etc.
• Supports multi-person online collaboration, and collaborative content is automatically stored in the cloud in real-time.
• After completing the data flow diagram drawing, you can share the file through a link.
• Online meeting function (supports access to Tencent Meeting, Feishu Meeting, DingTalk Meeting, Zoom, Eyeball, and Enterprise WeChat). You can conduct online meetings while drawing data flow diagrams and make adjustments at any time.
• The operation page is concise, the guidance is clear, and the tools are complete to help you complete drawing quickly and well.
• Built in a large number of rich data flow diagram templates, which can be applied for free.
Steps of Drawing Data Flow Diagram
Next, let’s take the Boardmix whiteboard as an example to introduce the most basic data flow drawing method.
Step1: Master the basic symbols of data flow diagrams
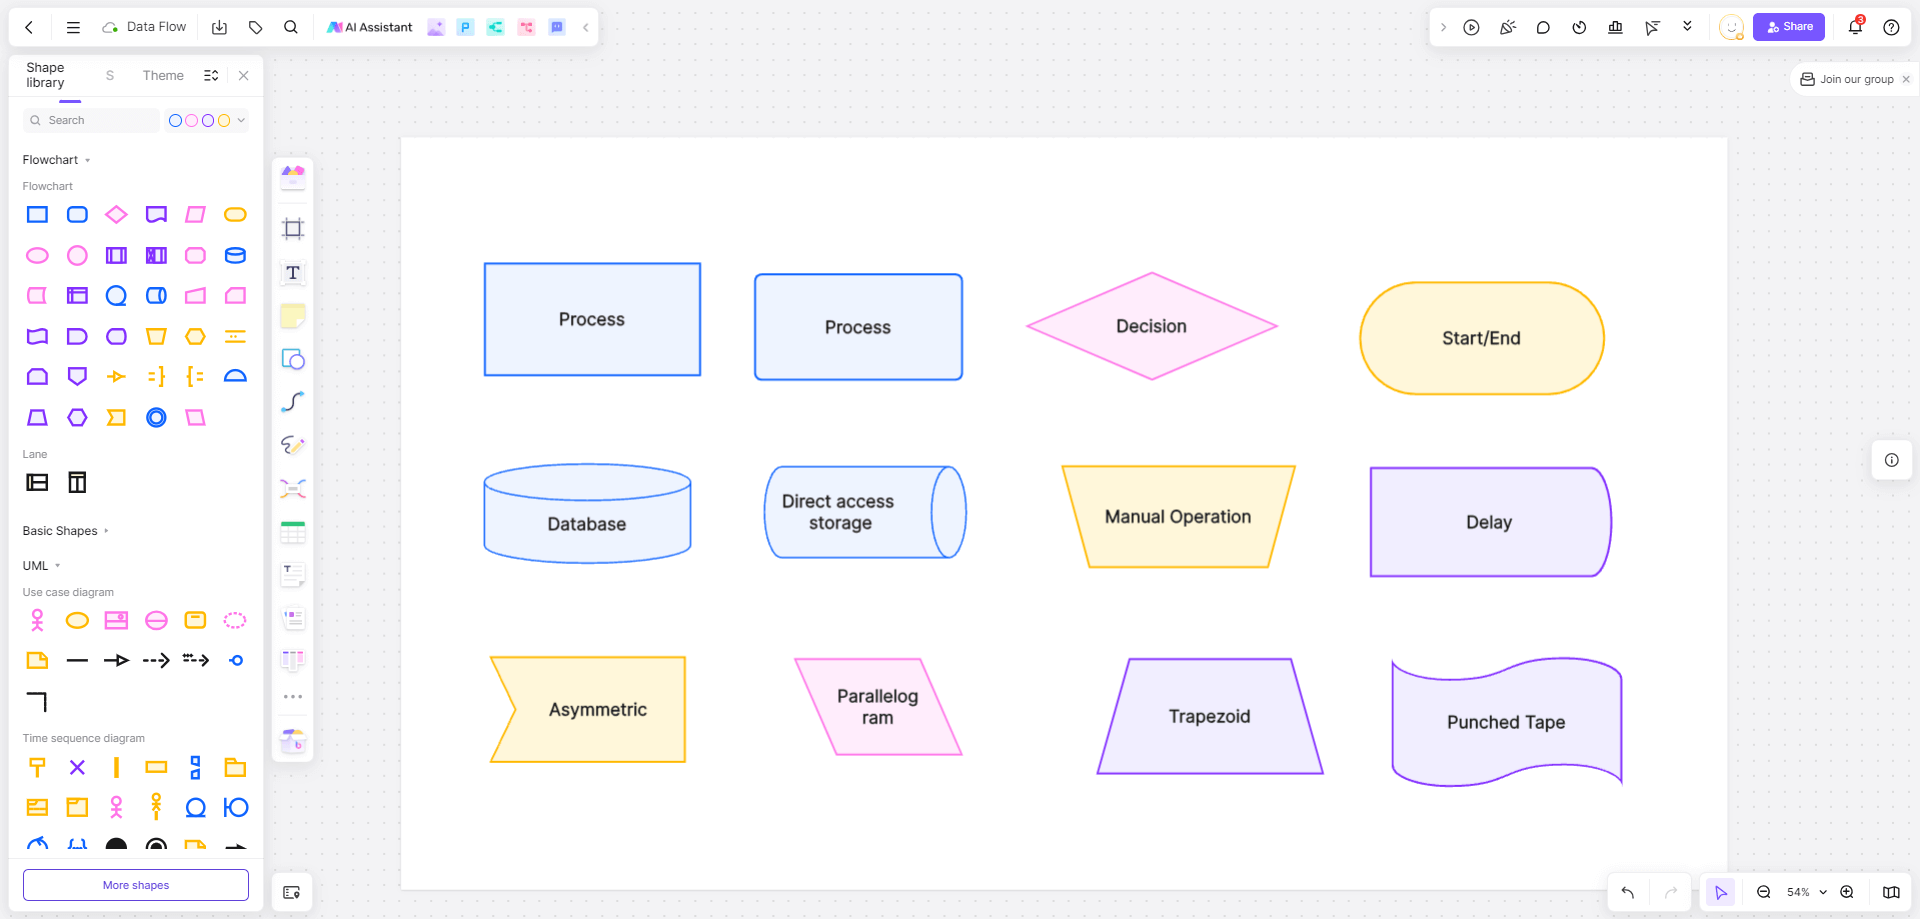
First, we need to understand some basic symbols of data flow diagrams, because each shaped symbol represents a specific meaning. There are complete symbols and explanations of data flow diagrams in Boardmix. Learn the following diagram so that you can quickly master the basic symbols of data flow diagrams.
Step2: Draw the relationship path of the data flow diagram
The Boardmix online whiteboard uses connecting lines to represent the path relationships between flow chart components. When the mouse is placed on the graph, we only need to point on the graph to see an arrow and lick on this arrow to choose the direction of dragging, which is perfectly expressed on the whiteboard.
If we need some pictures and information for visual description, we can also directly insert pictures and links to make our data flow diagram better.
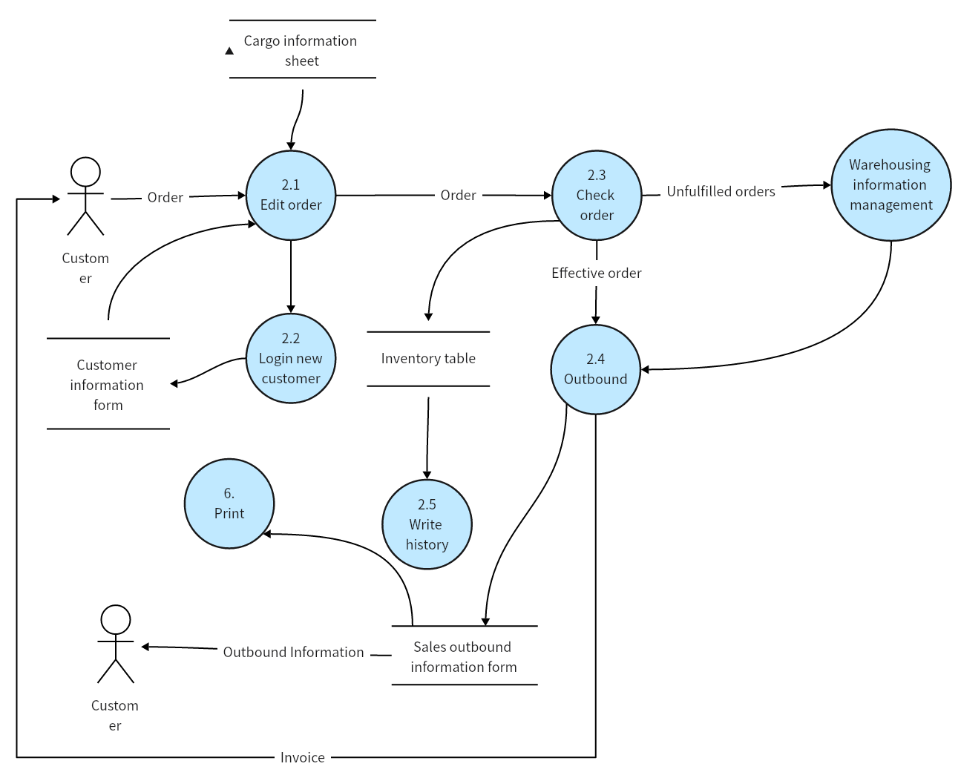
- Warehouse management system data flow diagram template:
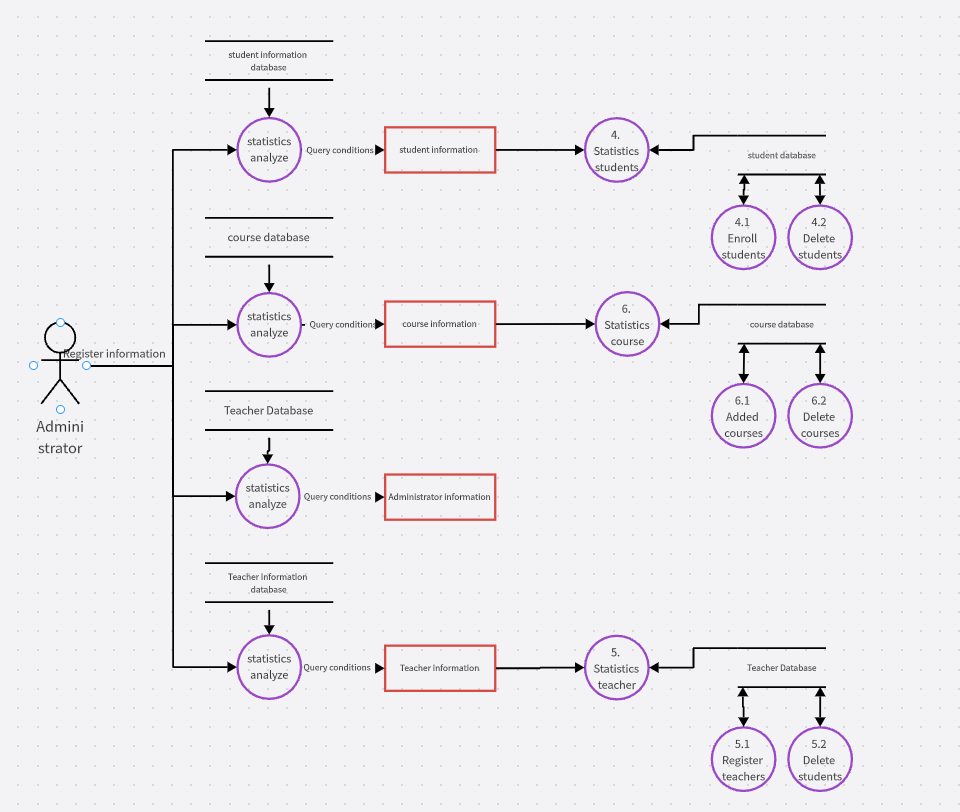
- Student Information Management System Data Flow Diagram Template:
Step3: Share the data flow diagram
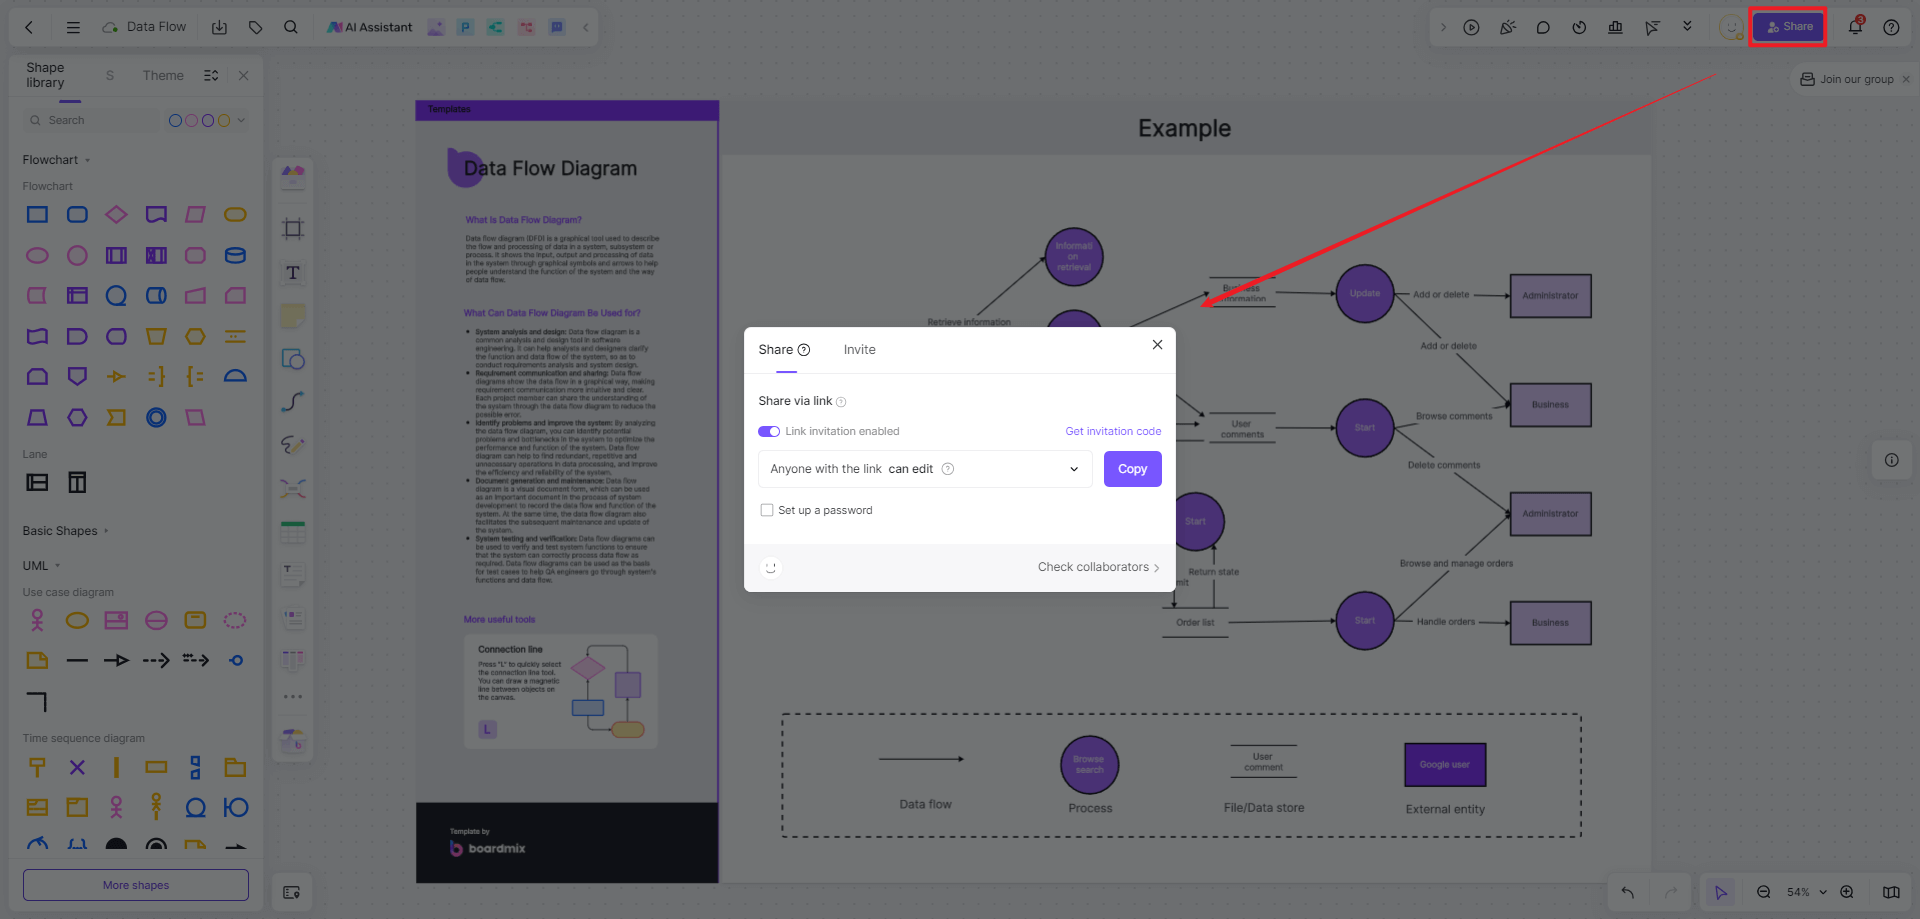
If you want to draw a data flow diagram that is highly logical, observable, and vivid efficiently and conveniently, you must choose a powerful data flow diagram production tool, that can improve your logic and vision. The Boardmix online whiteboard is the best choice for drawing online data flow diagrams. It not only has complete functions but also has a rich data flow diagram template library, supporting multi-person collaboration, sharing, and discussion. Currently, a free personal version is available to meet basic drawing needs!


