In businesses, there are so many entities that play different roles in the operations, all contributing to the eventual success or failure of the venture. There is technology, information, processes, people and so many more. To ensure that the business goals are achieved, every single process that is implemented must be carefully prepared, tracked, improved and ultimately perfected. Data flow diagrams provide you an efficient way of doing exactly that.
What Is a Data Flow Diagram?
A data flow diagram or DFD is a visual representation of how data flows through your business or organization. It lets you track data from input all the way to output, and all the processes that it undergoes in between. The primary function of the DFD is to give you a clear understanding of how data goes through the system, which then enables you to identify problem areas in the operation. With this knowledge, you can create strategies to make the flow more efficient or maybe recommend a complete overhaul of the system if necessary.
History of Data Flow Diagram
Data flow diagrams came into popular use back in the late 1970s. It started from a graph that was used to depict the workflow of an organization in a study. It caught on quickly because it was simple and very easy to understand. In comparison to lengthy text explanations that used complex terms and were largely boring, the data flow diagram was far better at holding people’s attention. More importantly, it was able to convey the same concepts explained in the text with a very simple graphical representation.
What Is a Data Flow?
Data is something that everyone encounters and uses on a daily basis. In a business environment, tons of data continually go through the office every single day. Even at home, you are participating in multiple data flows and you might not even realize it.
Let’s say you order food online, you will be transmitting your order and your contact information to the vendor. Once your order is confirmed, you will then send the payment and they will issue you a digital receipt and then send over the food to your address. That is a simple data flow right there.
Data Flow Diagram Levels
Of course, data flows are not always that simple. Some will have the data going through multiple processes and maybe undergoing some modifications along the way. Others involved the flow of several bits of data at a time. Because of their wide diversity, data flow diagrams are categorized into different levels, depending on the complexity of the transfer of data.
Level 0
Level 0 DFDs are by far the most common and also the most intuitive. Also known as context diagrams, these Level 0 DFDs demonstrate the transfer of information through a high-level process or system. They are barely technical and just about everyone can easily understand these diagrams even without an explanation.
Level 1
Like the context diagrams, the Level 1 data flow diagram also gives a general view of a process and the data that goes through it. Since they are still high-level, they are still quite easy to understand. However, there are significantly more details involved because the simple transfer is also broken down into smaller processes, and the diagram shows how the data goes through these sub-processes.
Level 2
The level 2 gives much more detail because here, each of the data paths in a level 1 DFD is further broken down into granular sub-processes. These diagrams are much more complex and can be very hard to follow for most people. But they are very useful for purposes like system analysis, troubleshooting, and many other vital lower-level operations.
Level 3
These types of DFDs are extremely rare and extremely complex. While it might be puzzling to a lot of people why these diagrams even exist, they are occasionally used for very detail-sensitive processes and are actually very valuable in these operations.
How to Make a Data Flow Diagram
Creating a data flow diagram can be a simple or complex process, depending on how much detail is involved in the process or system you want to analyze.
1. Choose a process
You can actually create a data flow diagram from any process or system. If you just want to practice your DFD skills, it would be advisable to pick a relatively simple process.
2. Identify the components
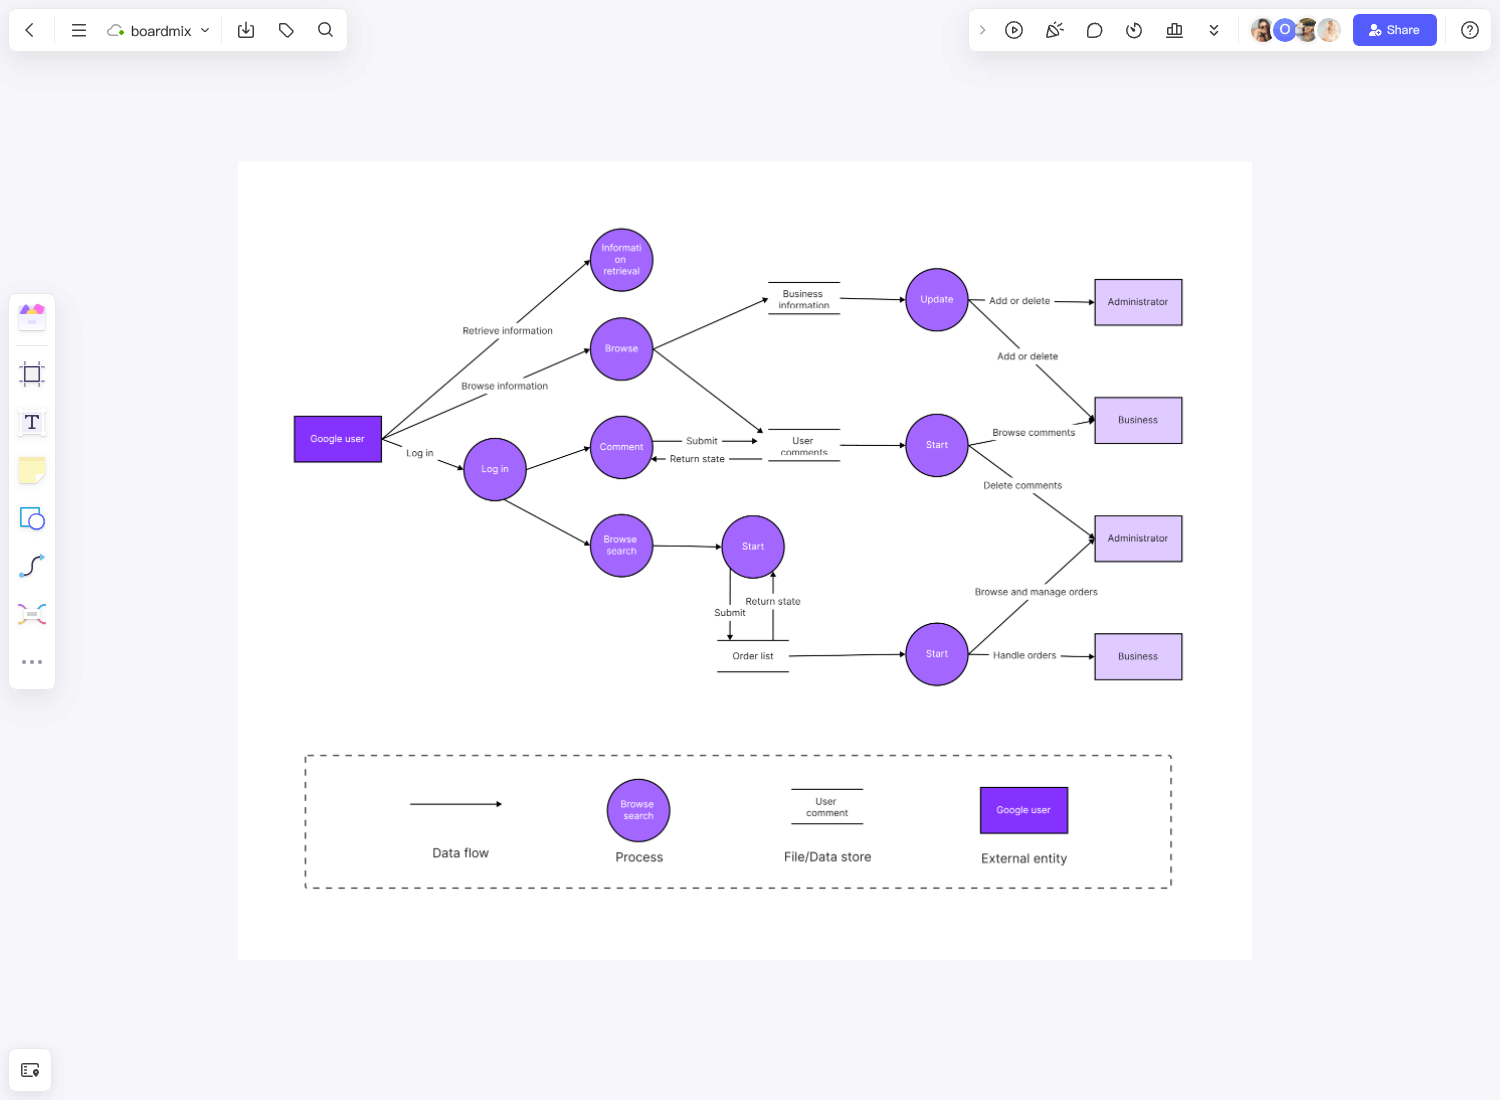
This includes all external and internal entities, processes, data stores and of course, the complete data flow. Oftentimes, the data flow goes in more than one direction so you must take this into careful consideration.
3. Draw the data flow diagram
With all the components identified, you can now begin drawing them into a Level 0 diagram. You can do it by hand or you can use a data flow diagram template like the one we have here at Boardmix. A template actually makes the process easier and also guarantees that your drawings are neat and organized.
4. Expand into Level 1 DFD
Unless you are happy with just a context diagram, you can then expand what you have into a Level 1, adding more details and more components as necessary.
5. Repeat as needed
Keeping expanding your diagram and adding components until you have reached the level that you are targeting to create.
Who Uses Data Flow Diagram?
Just about anyone can use a data flow diagram, but they are particularly useful for entities that are trying to design a new system and looking for a way to visualize how data moves through the components of that system.
Growth Team
A growth team is group of individuals that use data to support the functions of the sales, marketing and other departments, with the ultimate goal of promoting business growth. Since growth teams work mostly with data, it makes perfect sense for them to frequently use data flow diagrams to analyze these data and come up with suitable strategies to drive business growth.
Data Analysts
Again, data is the prime ingredient used in the day-to-day functions of data analysts. It is therefore not a huge surprise that they are among the most frequent users of DFDs. In fact, data analysts often use Level 3 DFDs for their operations.
Product Teams
The goal of product teams is to find out how customers respond to a particular product. Part of their procedure in achieving this goal is to follow the information that customers leave about or relevant to the product. A DFD is very useful in helping product teams trace the flow of this data.
Tips for Making a Great Data Flow Diagram
First of all, don’t get intimidated even if it seems like a complex process. Remember that it always starts with the very simple Level 0, which anyone can do. As you progress through higher levels, you can always think of each level as a Level 0, which makes it easier to do the expansion.
It is also very important that you use the right shapes, lines or arrows in creating your drawing. Using a data flow diagram template can help a lot because the right symbols are all there and you just have to enter the information.
No matter how complex your chosen process or system might be, always start with a Level 0 DFD and gradually build up on it.