

A project schedule chart, also known as a Gantt chart, is a stacked bar chart that includes project tasks on the vertical axis and a timeline representing task duration on the horizontal axis. Summary elements, task dependencies, and milestones are all included in the project schedule.
During project planning, the project schedule shows how to complete tasks by specific dates, helping project managers and team members view the project's start dates, end dates, and milestones in a simple bar chart. Boardmix is an ideal project schedule management software for creating project schedules. This article will introduce how to efficiently create a project schedule in seven steps. Let's take a look! Project schedule management templates are available for free!
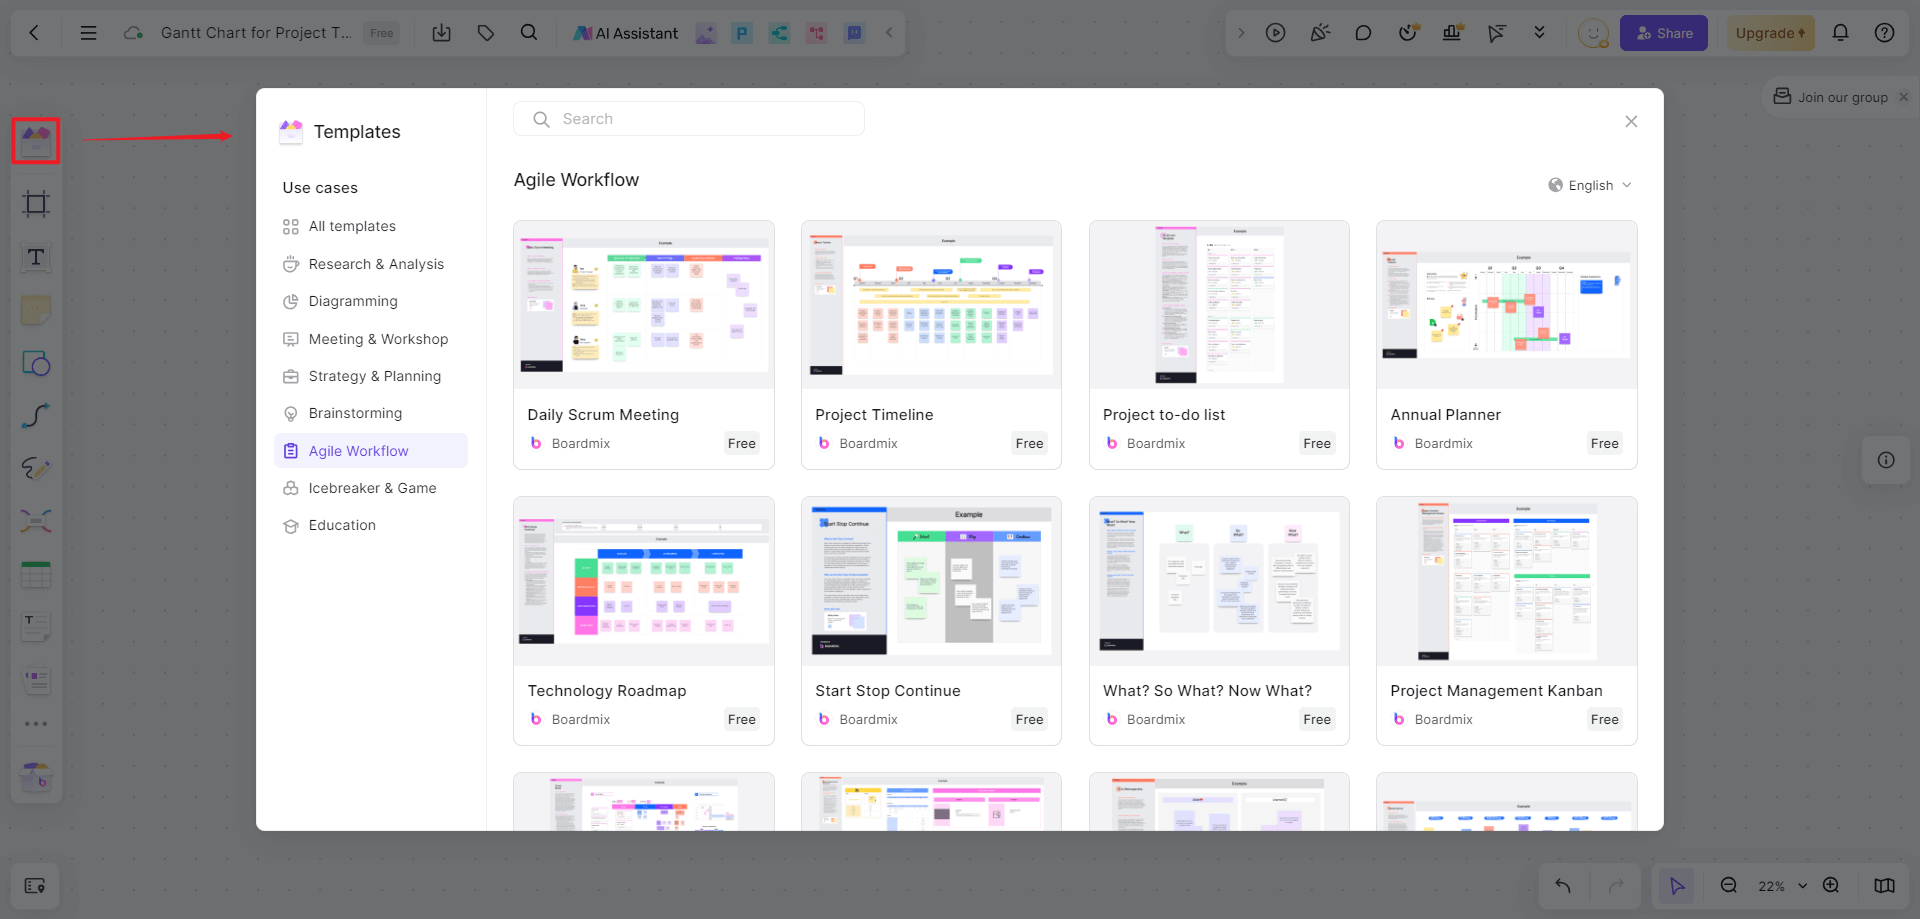
1. List All Project Tasks
First, list all the tasks required to complete the project. This is the most important and basic content of the project schedule. Be as detailed as possible and avoid omissions.
Project managers can use Boardmix's task management board to organize project tasks, categorizing tasks to save time. For example, in a software project management board, tasks are divided into major categories by process and then further subdivided into specific tasks, with task completion statuses added for later follow-up.
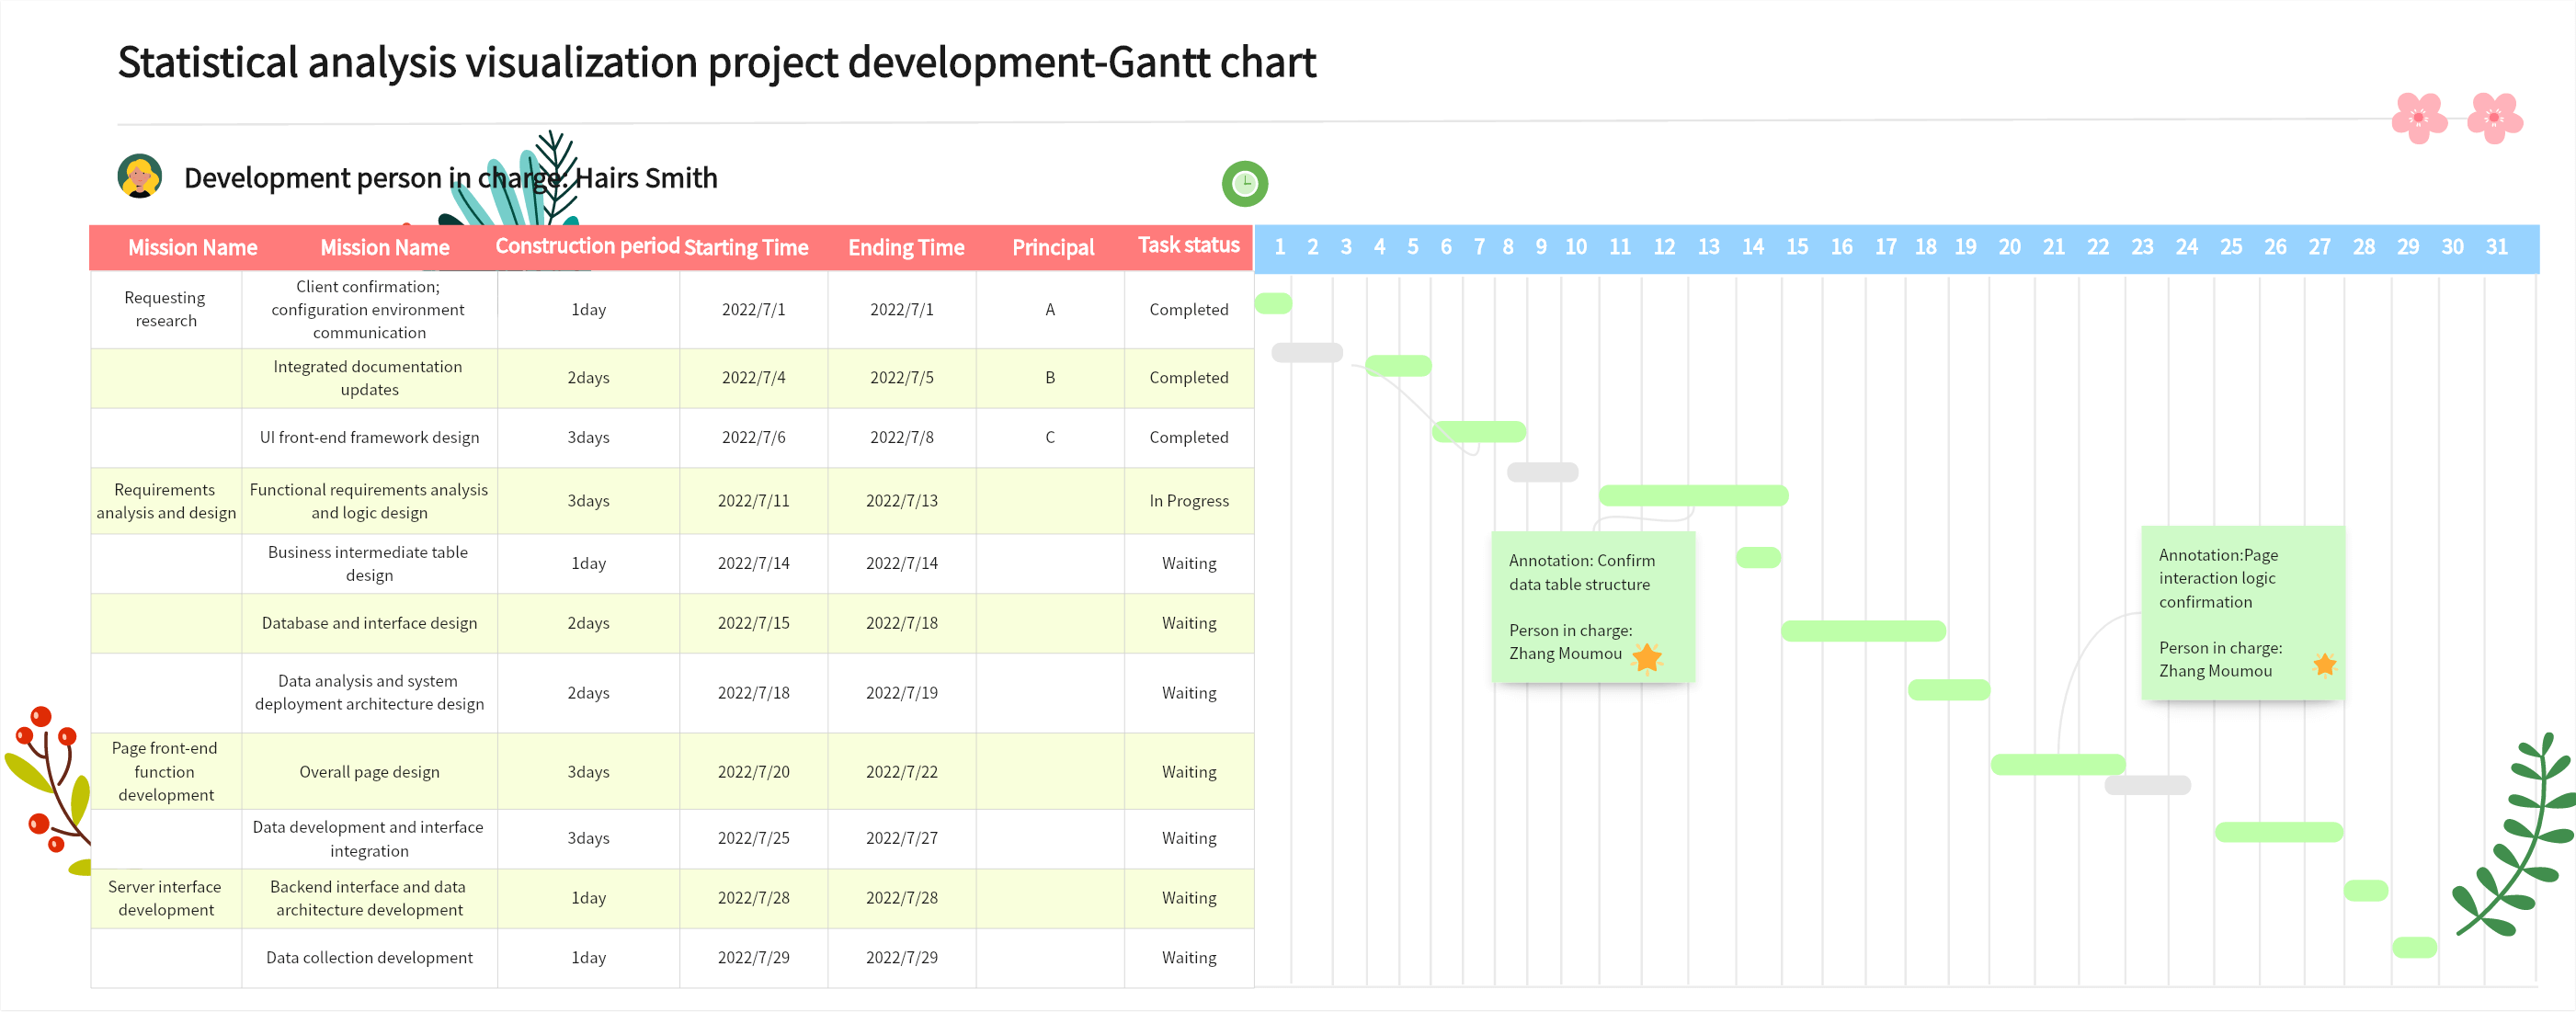
2. Determine Task Duration
Each task needs to have a clear start and end date to ensure the team completes the work on time. We can use Boardmix's project scheduling plan board, which details tasks, breaks down the project plan, and shows start and end dates.
3. Create a Project Timeline
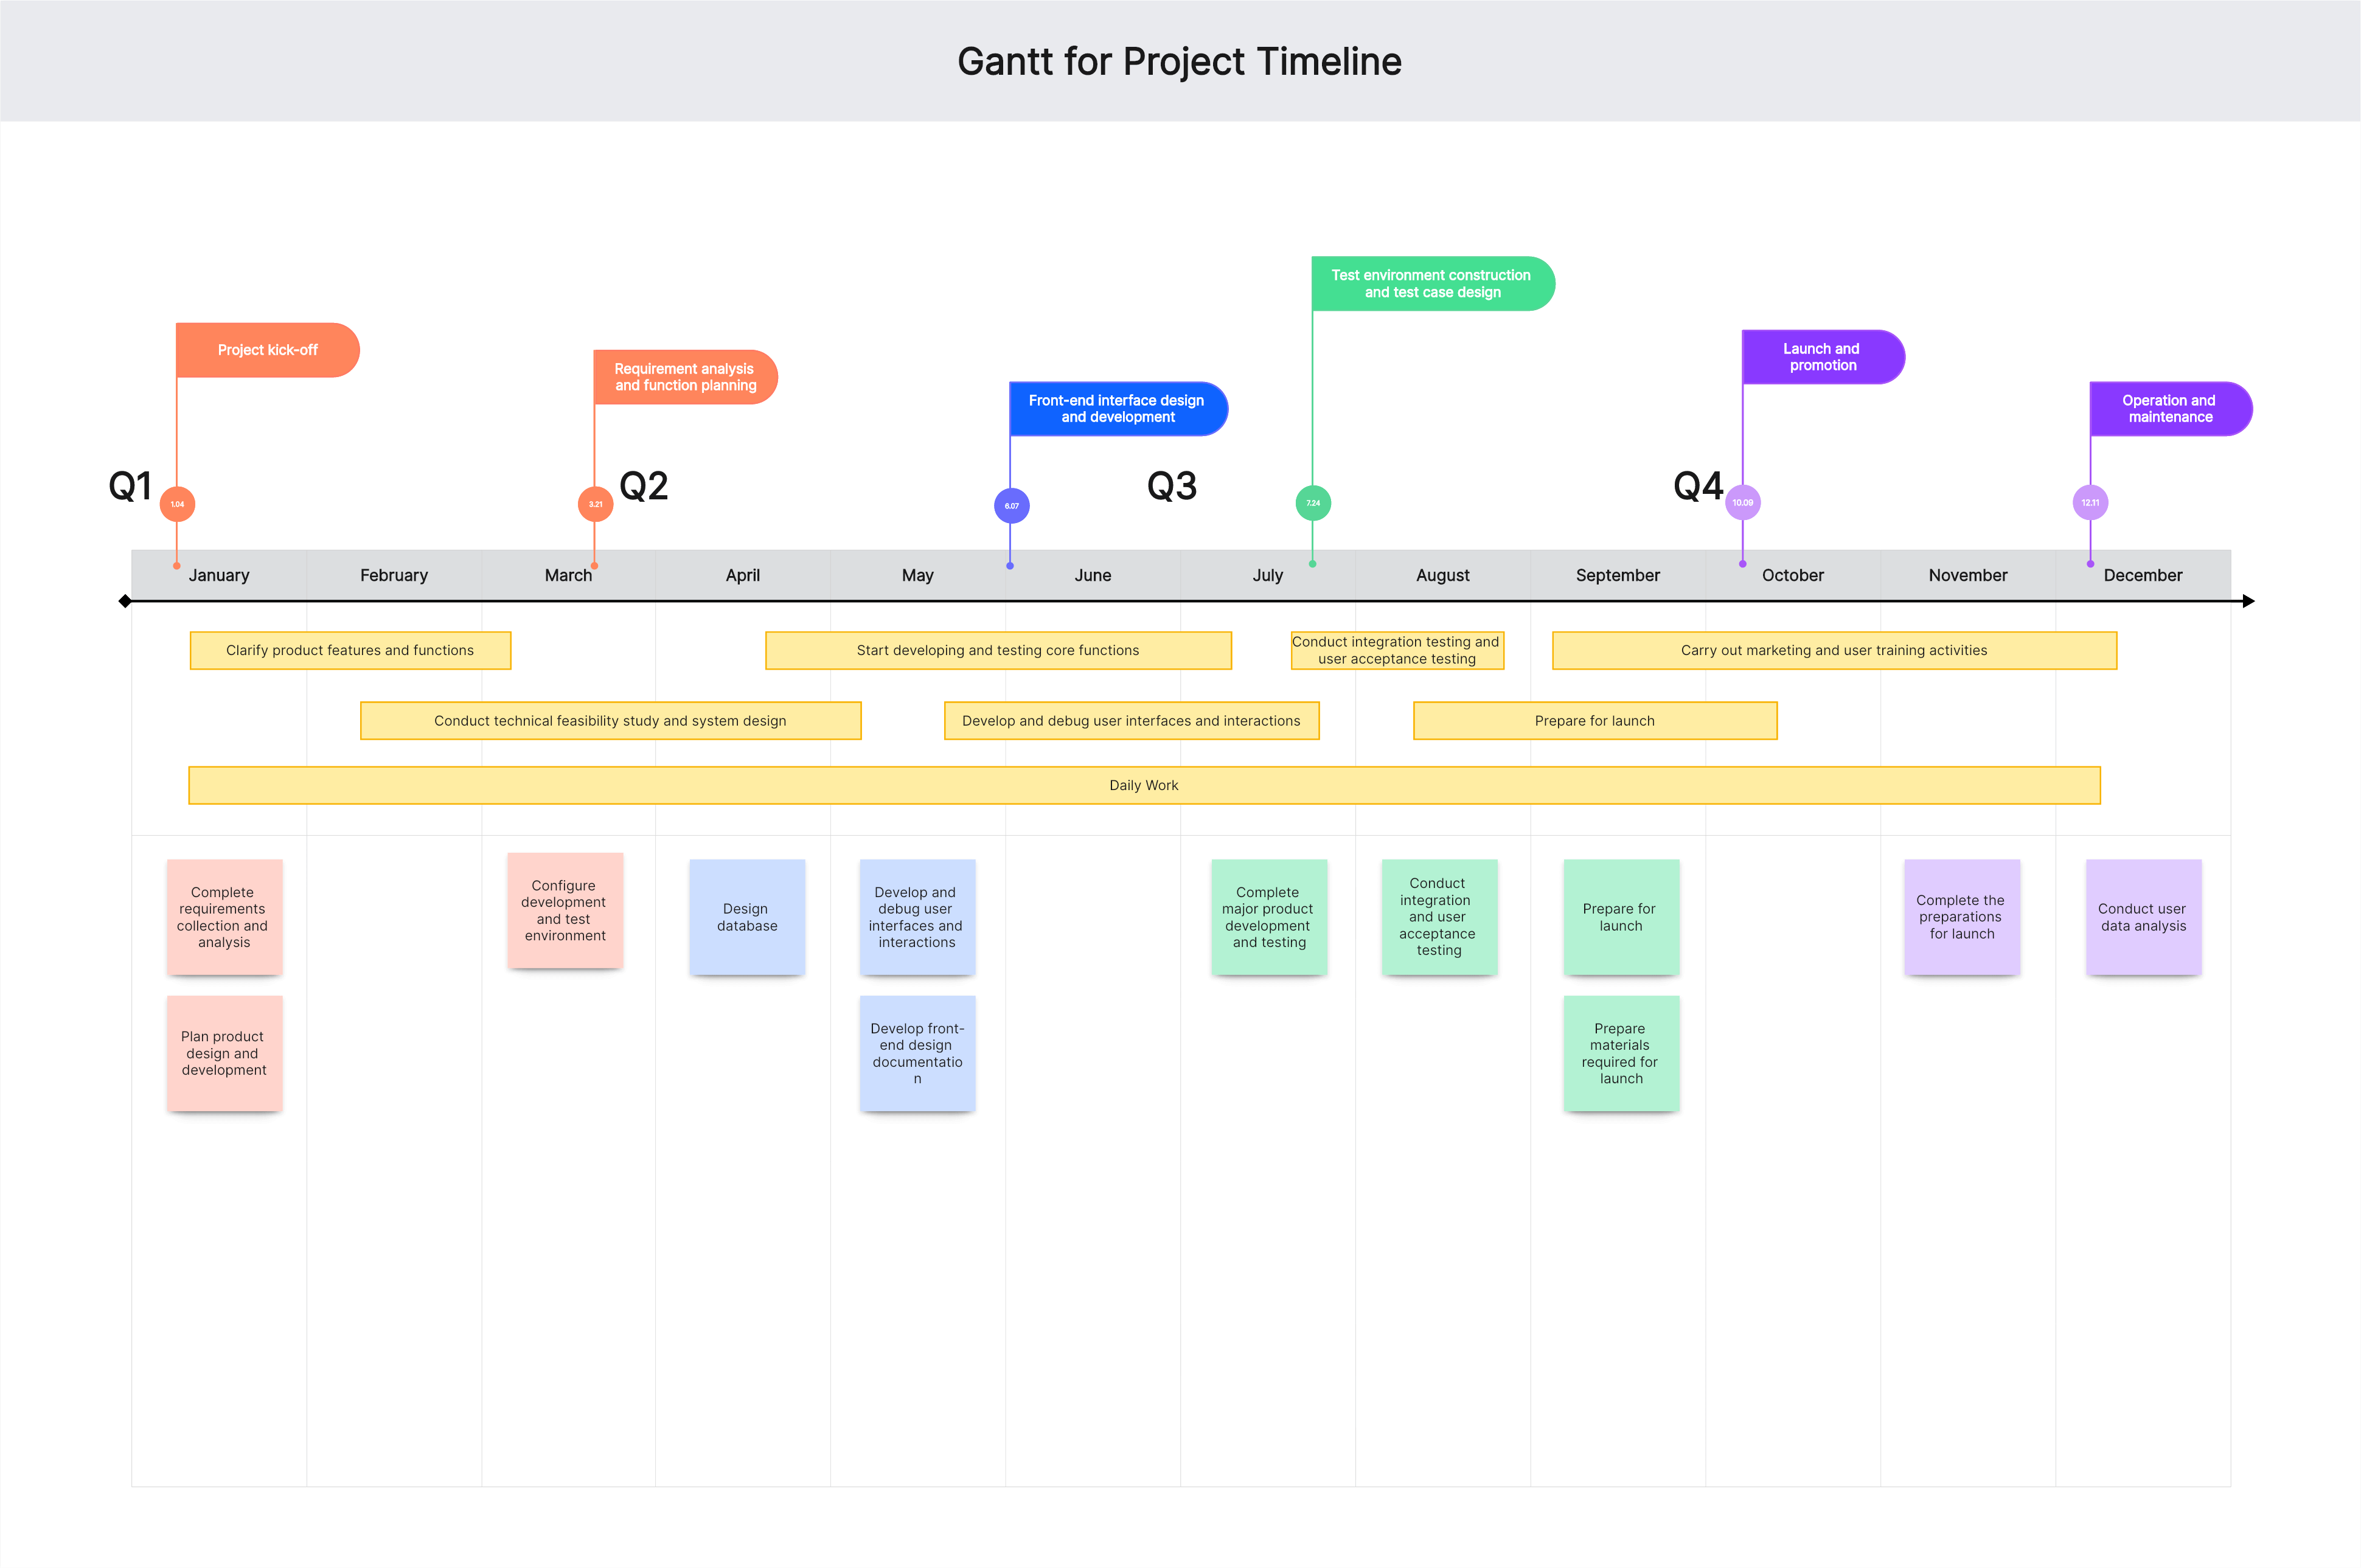
Boardmix's project schedule plan template can help us efficiently create a project timeline. For example, the management consulting project schedule plan template includes the duration of each module, planned start dates, expected completion dates, and deliverable submission dates. Tasks within each module are also detailed.
4. Determine Task Dependencies
After creating and scheduling tasks in the project, link tasks to indicate their relationships. You can display relationships between multiple projects through cross-project links or project-relatedness. Use Gantt charts, network diagrams, or calendar views to link tasks within the same project. For example, Boardmix's agile project management process uses flowcharts to link various stages of project management, making them clear and visual.
5. Assign Project Tasks
Assign project tasks to team members based on their real-time availability. When personnel are assigned to tasks, their names appear above the task bars in the Gantt chart. For example, Boardmix's management consulting project schedule plan details specific project tasks and their durations. Team members can claim tasks and update their progress in real-time within the chart, sharing information.
6. Set Milestones
Setting milestones can remind team members of key dates. Use Boardmix's milestone template to draw timelines, highlight key points, and sprint toward milestones to complete the project delivery.
7. Identify the Critical Path
The critical path usually determines the project's schedule. It is the longest path in the project, where even small deviations can directly affect the earliest completion time of the entire project. For example, in software project development management, every stage from project initiation, requirements, design, and development to testing includes numerous processes. Any deviation in each step can affect the overall project schedule. Therefore, it is crucial to identify the detailed critical path.
Once all the preparations are complete, use the vertical axis to list the tasks and the horizontal axis to draw the timeline. When you input tasks, start dates, end dates, and their dependencies, the bars in the stacked bar chart will populate, representing task durations. Project management tools with Gantt chart generators can automate this process.
Here is an example of a Gantt chart from Boardmix's skills center, which helps in project planning, resource, and budget management:
Most Gantt charts are created using Excel or project management software, sometimes referred to as Gantt chart software. The Boardmix community offers a wealth of Gantt chart and project management templates, supporting graphics/chart drawing functions, and includes various project management resource templates like project timelines, milestones, plans, product roadmaps, project kick-off meetings, and boards. These templates are suitable for different stages of project management and are great assistants for project management. Open the webpage to use them—give it a try now!


