

Creating charts online has become a necessity in today’s digital world. Whether you’re a business professional, educator, or student, using an online whiteboard to make chart online can greatly enhance your productivity and creativity. In this article, we'll explore the benefits of charting online, the features you should look for in a chart online maker, and a detailed guide on using Boardmix for your charting needs.
What are the Benefits of Using Online Tools for Charting?
Embracing digital solutions not only streamlines the chart creation process but also enhances the overall efficiency and effectiveness of data visualization.
Accessibility and Convenience
Making charts online provides unparalleled convenience. With just an internet connection, you can access your charts from anywhere, anytime. This flexibility is crucial for remote work and collaboration.
Collaboration and Sharing
Online charting tools often come with features that allow multiple users to work on the same chart simultaneously. This enhances teamwork and ensures that everyone is on the same page, literally and figuratively.
Cost-Effectiveness
Many online chart makers offer free or affordable plans, making them accessible to a wide range of users. This cost-effectiveness is particularly beneficial for small businesses and educational institutions.
Variety of Features
When you make chart online, you have access to a plethora of features such as templates, design elements, and customization options. This variety allows you to create professional and visually appealing charts without the need for advanced technical skills.
What Features Should You Look for in a Chart Online Maker?
To ensure you choose the best tool for your needs, it’s essential to understand the key features that can enhance your charting experience. Here’s a breakdown of the critical aspects to consider when evaluating a chart online maker.
User-Friendly Interface
A chart online maker should have an intuitive interface that allows users to easily create and modify charts. Drag-and-drop functionality and pre-designed templates can significantly enhance the user experience.
Customization Options
Look for tools that offer a wide range of customization options. This includes colors, fonts, and chart types. The ability to personalize your charts ensures that they align with your brand or presentation style.
Integration Capabilities
Ensure that the chart online maker integrates well with other tools you use, such as Google Workspace, Microsoft Office, or project management software. This integration can streamline your workflow and improve productivity.
Real-Time Collaboration
Real-time collaboration features are essential for teamwork. They allow multiple users to edit and comment on charts, facilitating effective communication and decision-making processes.
Boardmix: Your Versatile Online Charting Whiteboard
In the realm of digital tools for data visualization, Boardmix emerges as a standout choice for creating charts online. Its comprehensive charting capabilities and user-friendly design make it a go-to solution for diverse charting needs. Whether you're looking to produce detailed business reports or engaging educational materials, Boardmix provides a robust platform for all your charting requirements.
Introduction to Boardmix's Online Charting Feature
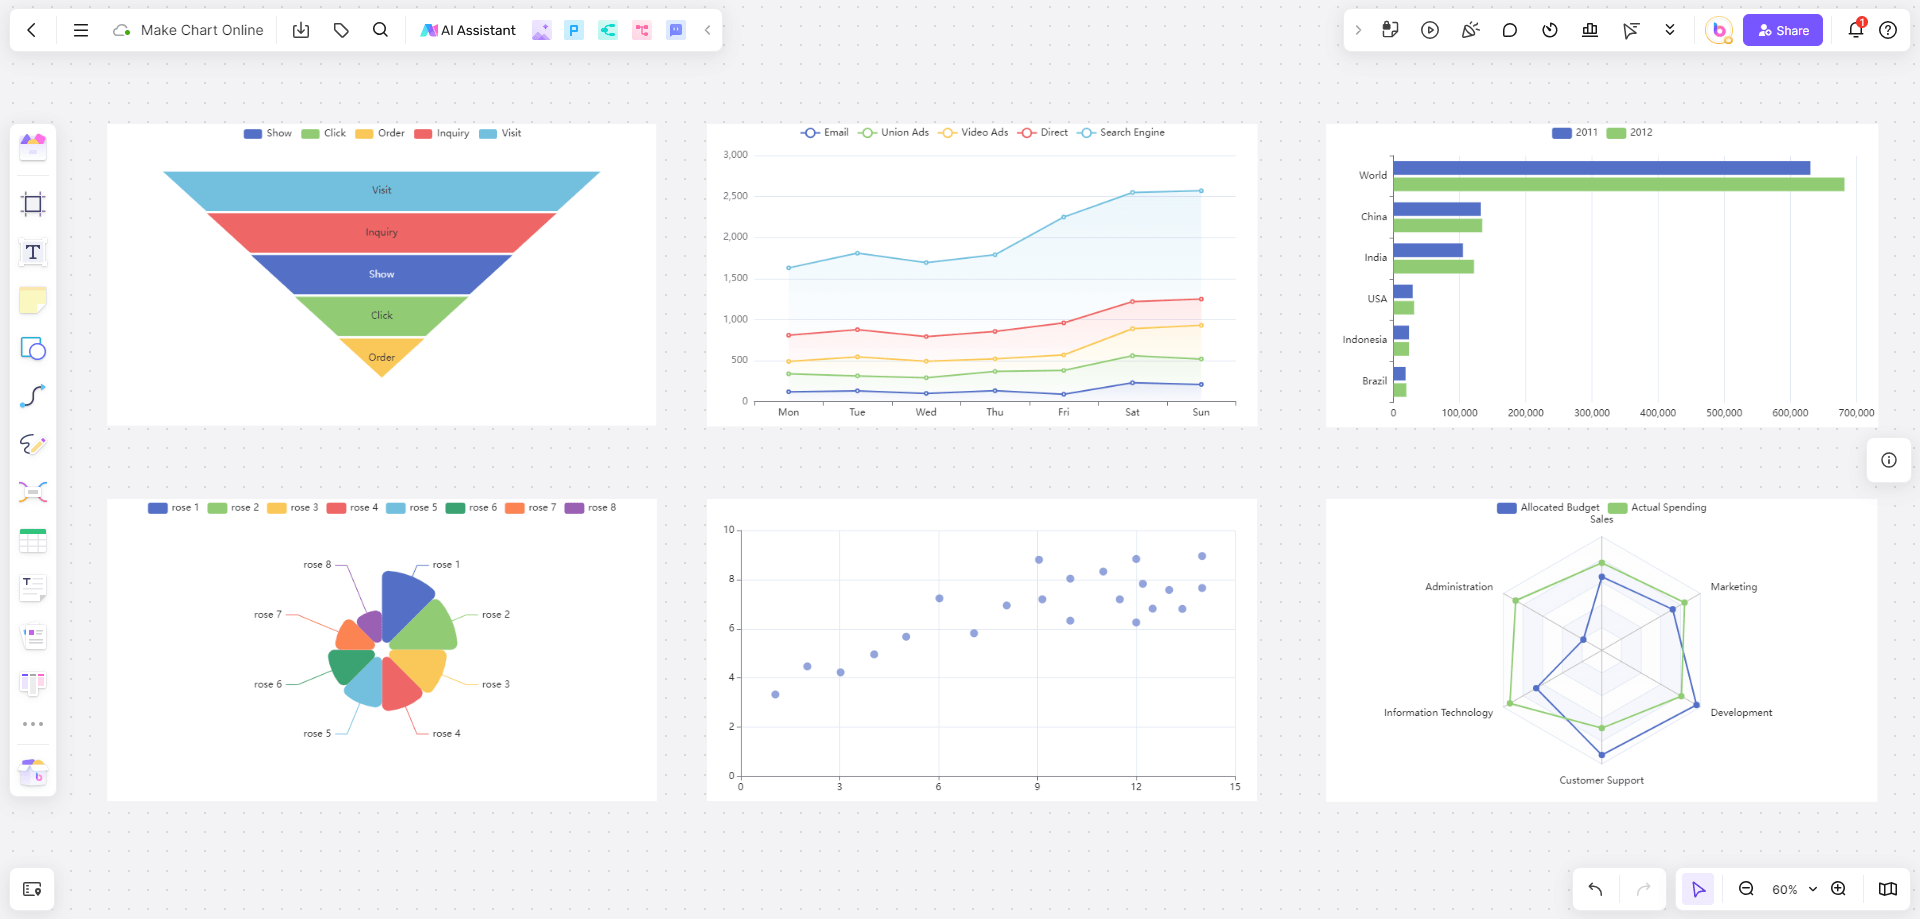
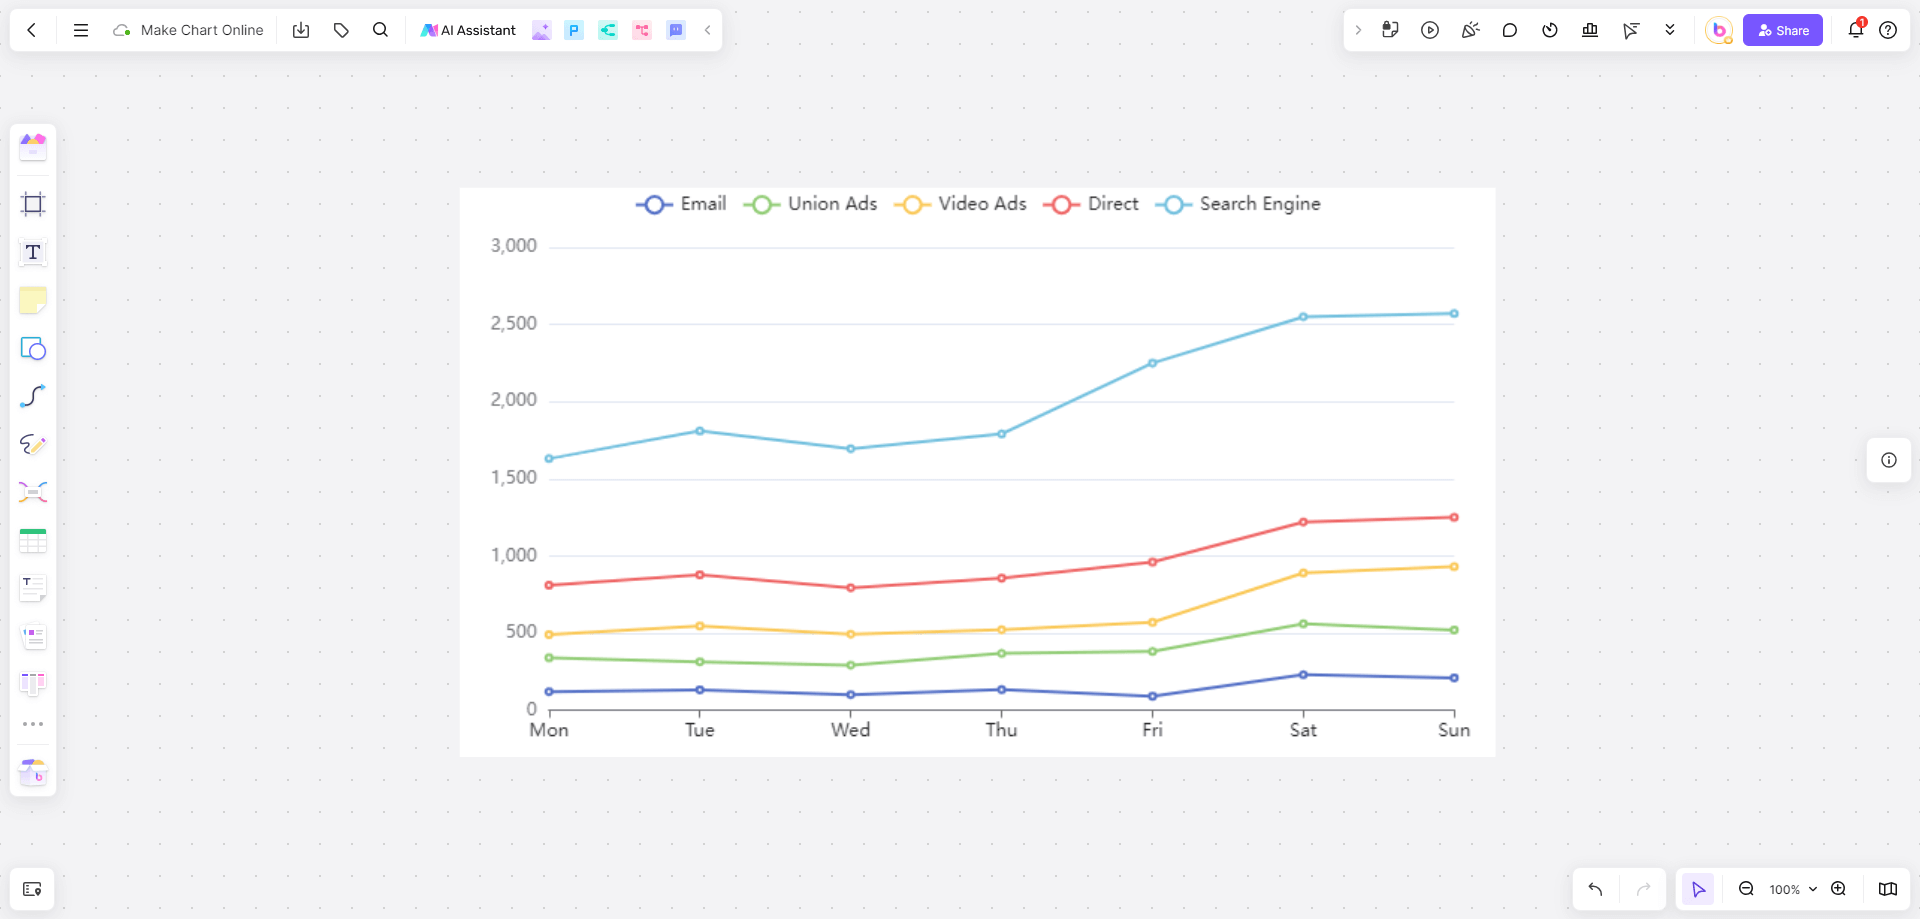
Boardmix is a highly versatile online whiteboard that stands out for its extensive charting capabilities. It provides users with a comprehensive suite of tools designed to facilitate the creation of diverse chart types, such as line charts, bar charts, pie charts, scatter plots, funnel charts, and radar charts. This variety enables users to select the most appropriate chart type for their data visualization needs, whether for business analysis, academic projects, or personal use. The platform’s intuitive interface ensures that users of all skill levels can effortlessly navigate and utilize these charting tools, making it an excellent choice for both beginners and seasoned professionals.
Moreover, Boardmix excels in offering customization flexibility, allowing users to tailor their charts to specific needs and preferences. With a range of customization options, you can modify colors, fonts, and chart styles to match your branding or presentation requirements. This degree of personalization ensures that each chart is not only functional but also visually appealing and aligned with the intended message or aesthetic. Whether you need to create a professional report, an engaging presentation, or an insightful data analysis, Boardmix’s robust customization features provide the tools necessary to produce charts that effectively communicate your data.
A Step-by-Step Tutorial on Making Bar Charts with Boardmix
Step 1: Sign Up and Access the Dashboard

To get started with charting online using Boardmix, sign up for an account and log in to access the dashboard. The dashboard provides an overview of all your projects and the tools available for chart creation.
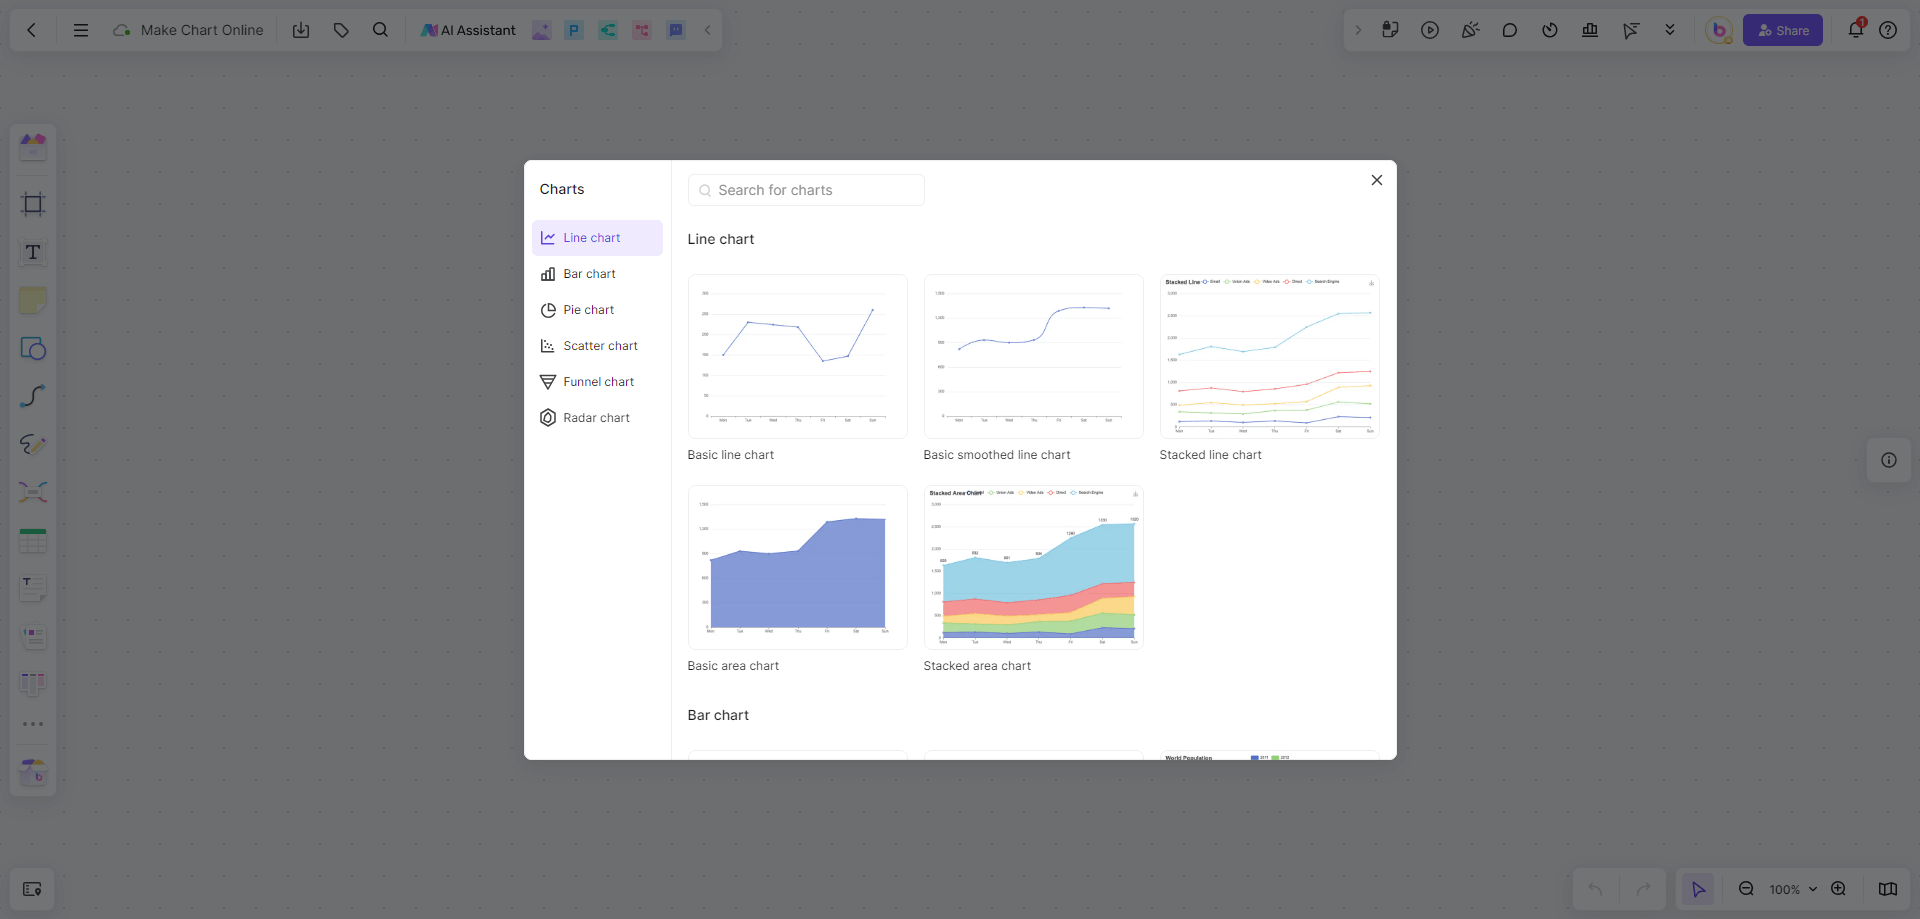
Step 2: Choose the Bar Chart Type
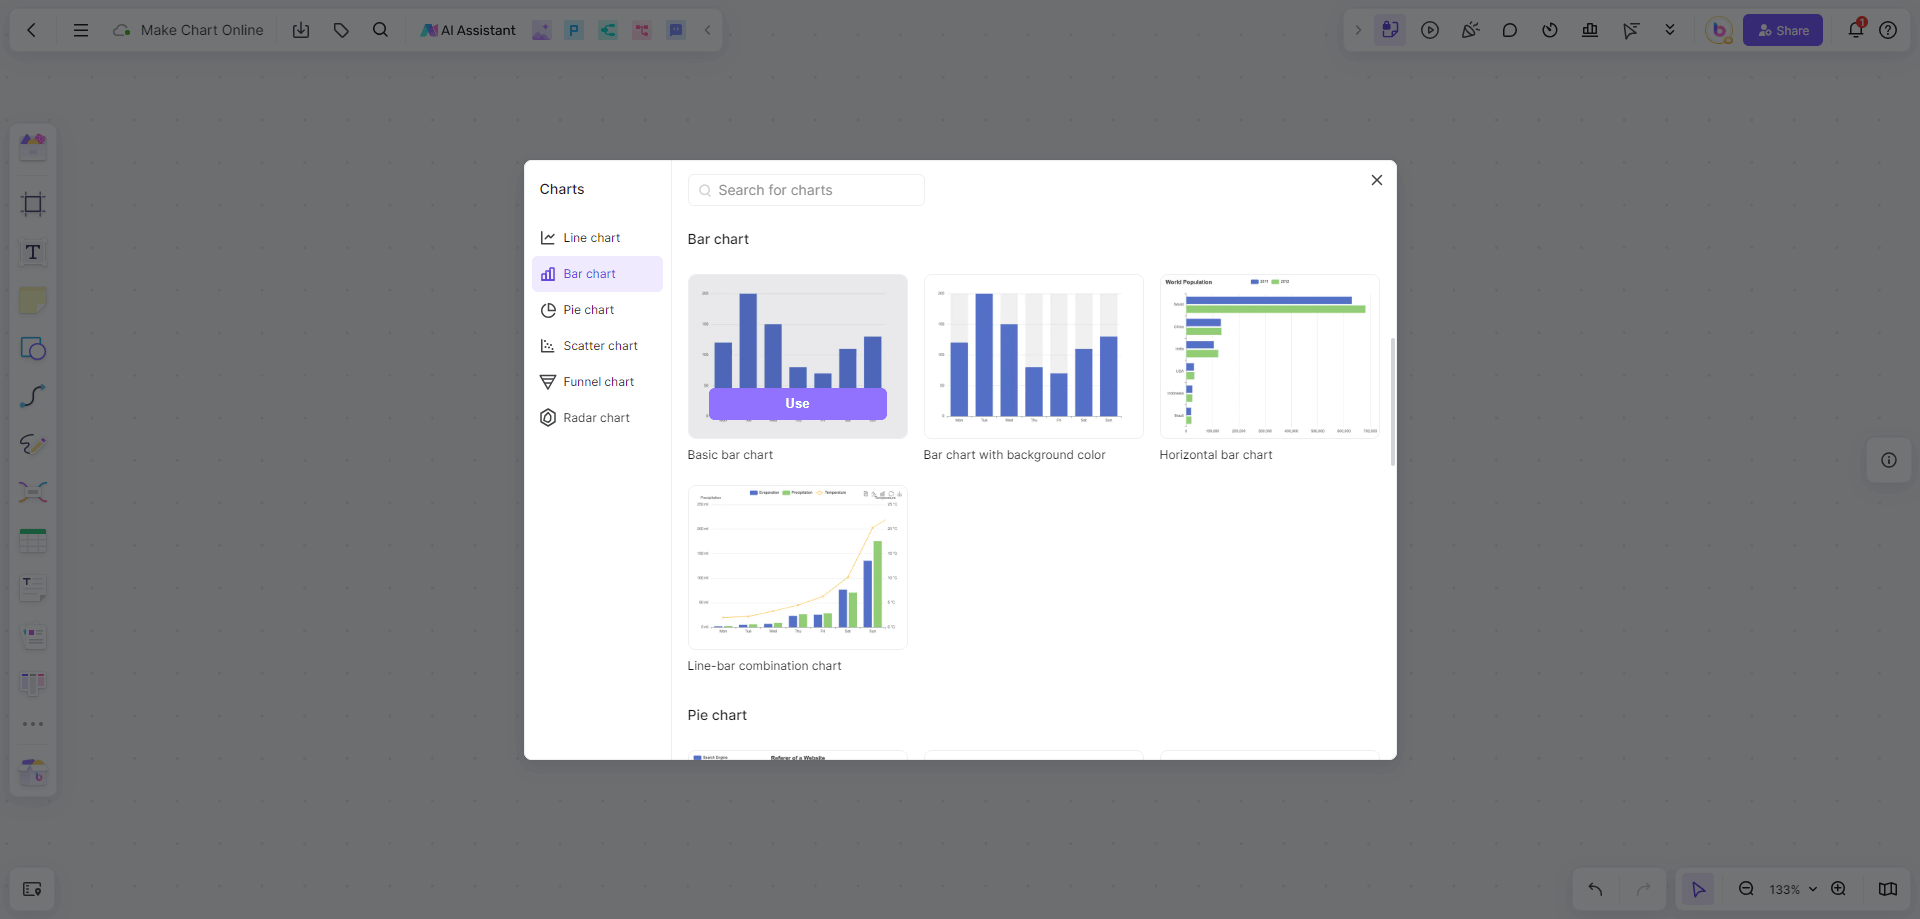
Select the bar chart option from the toolbar. Boardmix offers various templates to make chart online creation straightforward and efficient.
Step 3: Input Data
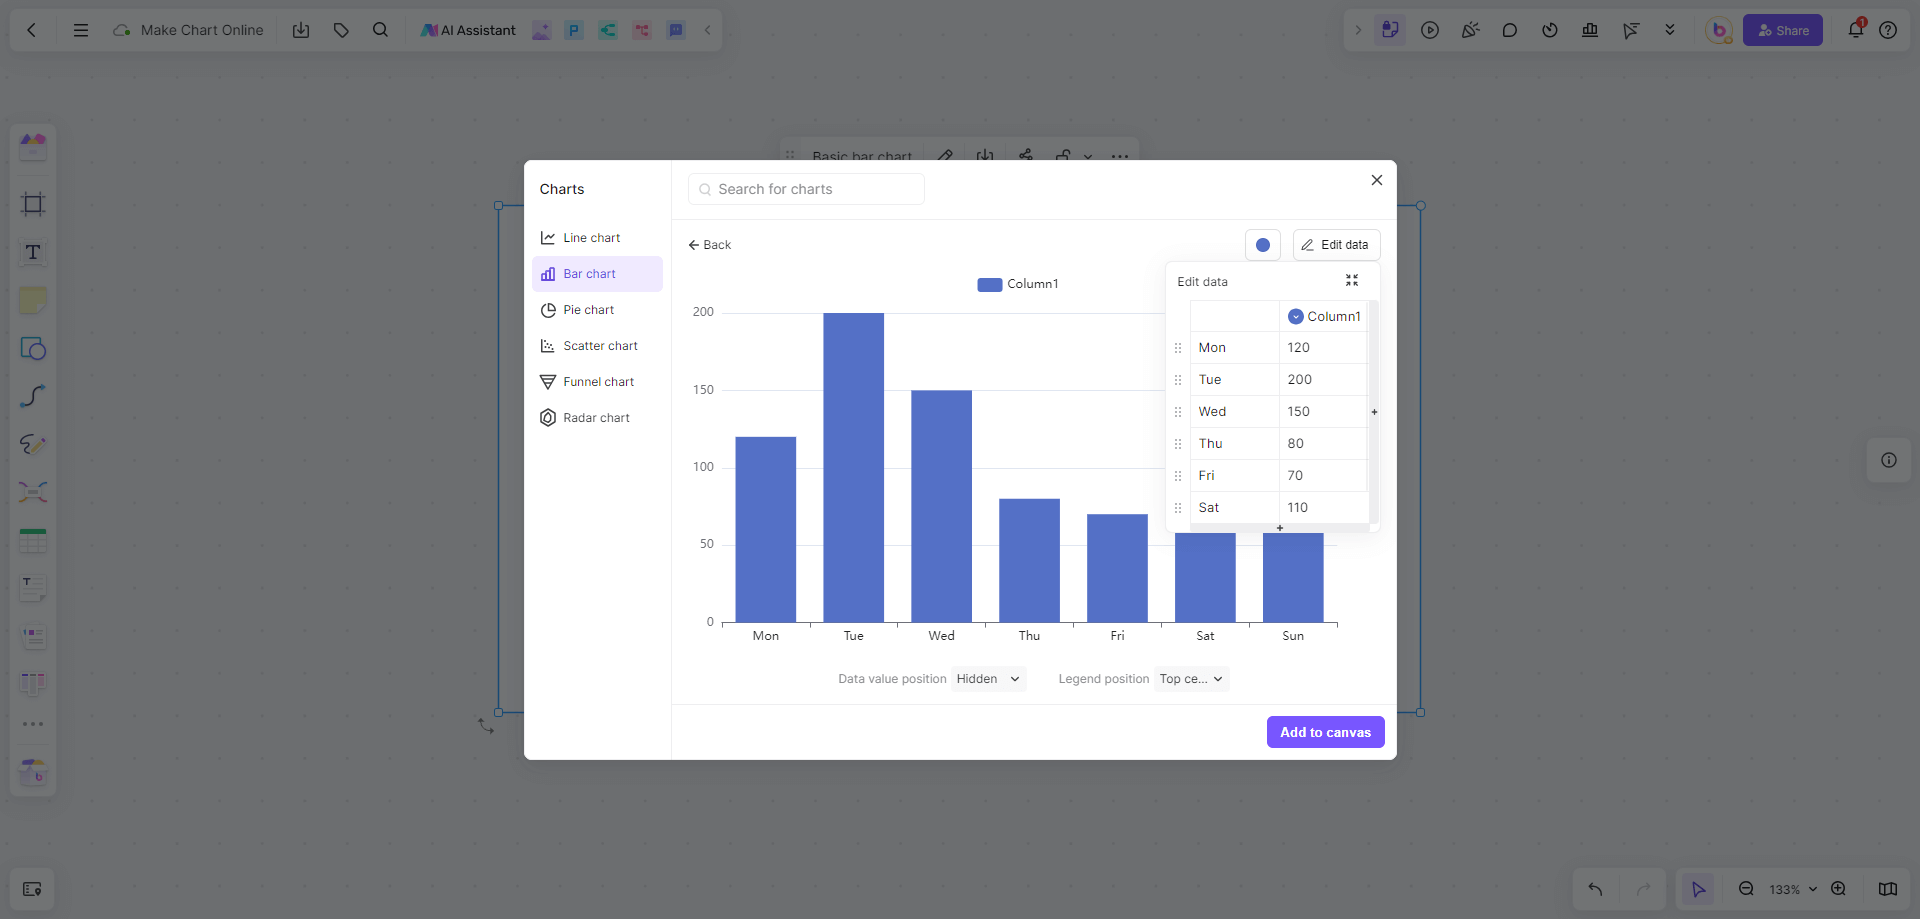
Enter your data manually or import it from a spreadsheet. Boardmix supports various data formats, making it easy to integrate your existing data.
Step 4: Customize Your Bar Chart
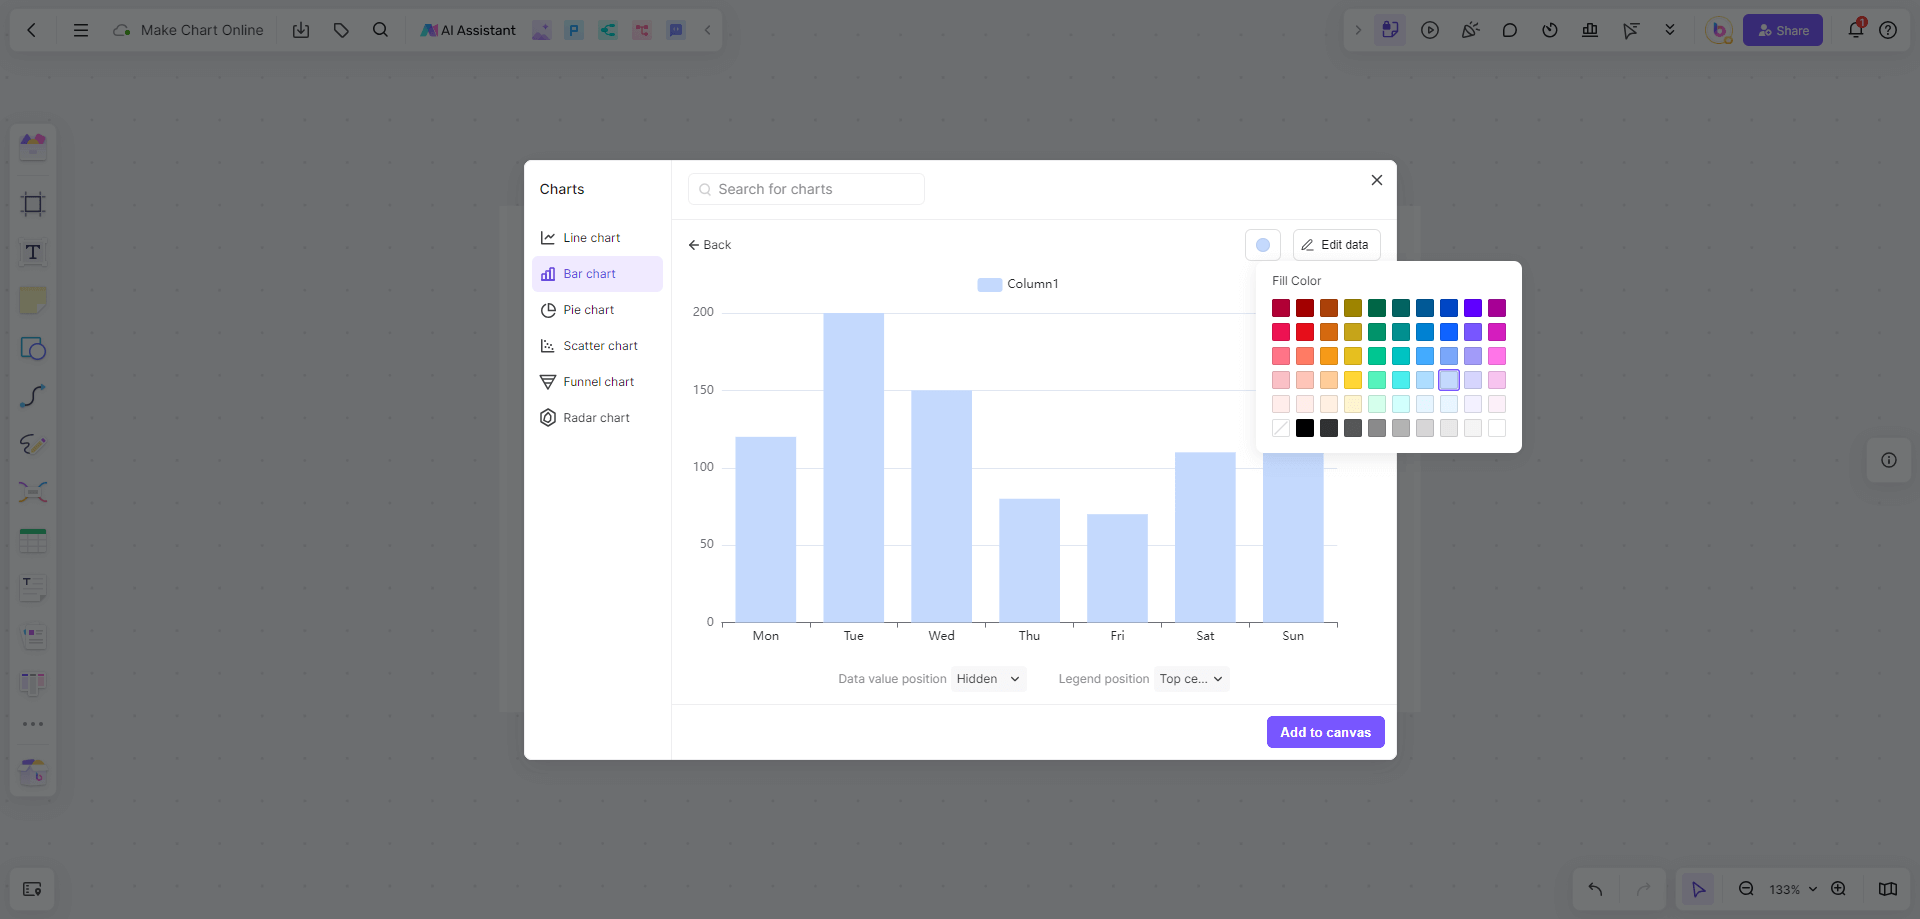
Utilize Boardmix’s customization tools to modify the appearance of your bar chart. Change colors, fonts, and labels to ensure your chart aligns with your presentation style.
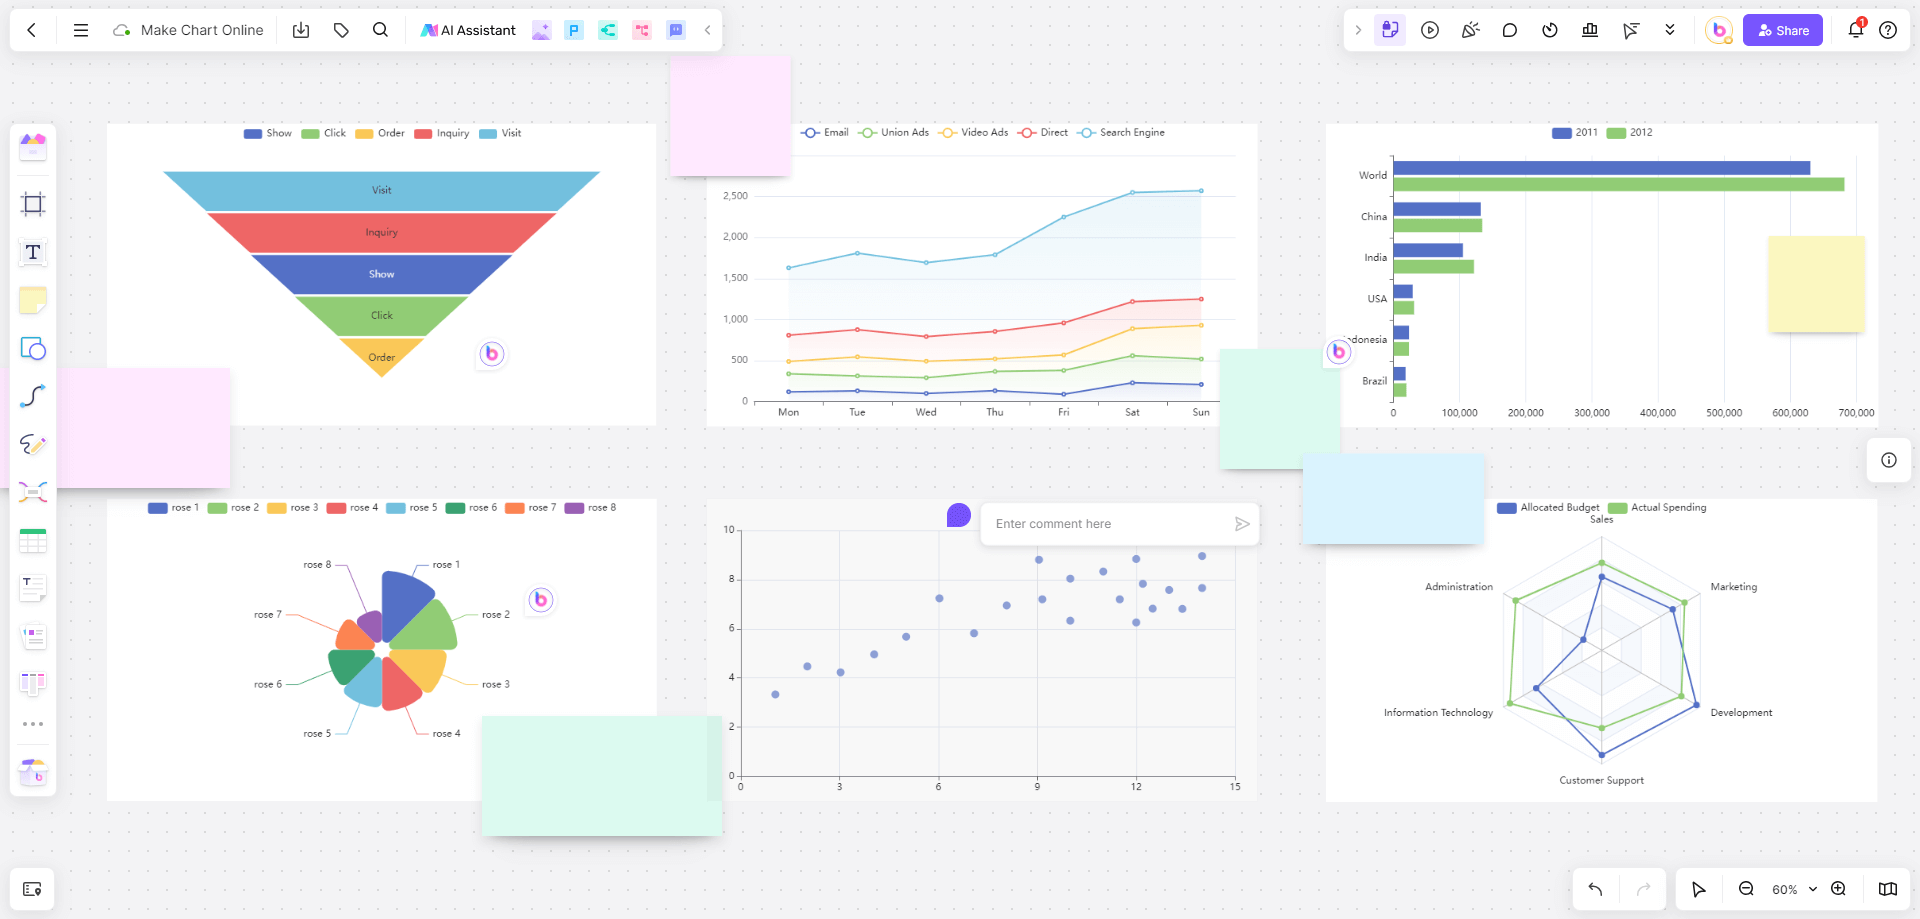
Step 5: Collaborate and Share
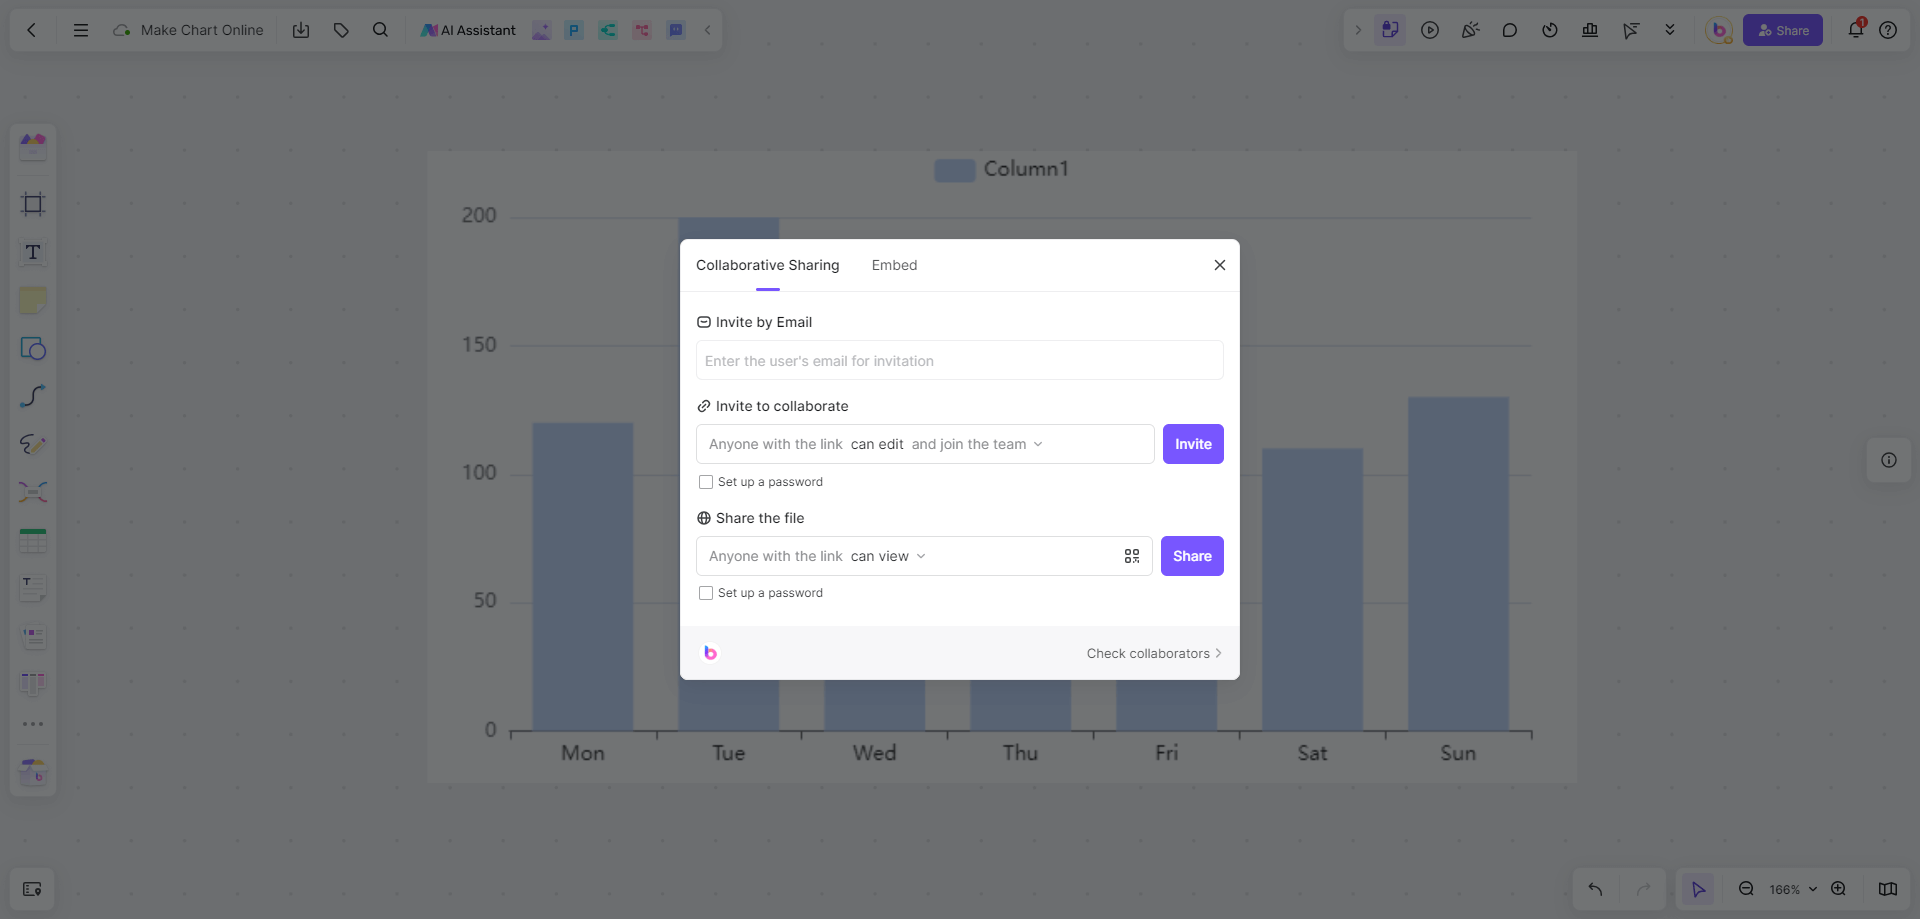
Invite team members to view or edit your chart. Boardmix’s real-time collaboration feature allows multiple users to work on the same chart simultaneously, facilitating seamless teamwork in charting online.
Step 6: Export and Present
Once your chart is complete, export it in your desired format. Boardmix supports various file types, ensuring that your chart is ready for presentations or reports.
How can Online Whiteboard Tools Facilitate Teamwork in Charting Online?
Online whiteboard tools have revolutionized how teams work together on charting tasks by offering features that enhance cooperative efforts. Here’s how these tools can facilitate more efficient and productive teamwork in creating and managing charts online.
Enhanced Communication
Online whiteboard tools like Boardmix enhance communication by allowing team members to visualize data collectively. This visualization is crucial for brainstorming sessions and strategic planning.
Synchronized Workflows
With real-time updates, team members can make changes simultaneously, ensuring that everyone is working with the most current data. This synchronization reduces errors and improves efficiency.
Accessibility and Inclusivity
Team members from different geographical locations can collaborate without barriers. This inclusivity fosters diverse perspectives and innovative solutions.
Feedback and Iteration
Online whiteboards allow for easy feedback and iteration. Team members can comment directly on charts, suggesting improvements and modifications. This iterative process leads to more refined and effective charts.
In conclusion, making charts online using tools like Boardmix not only simplifies the process but also enhances collaboration and creativity. By leveraging the features of a robust chart online maker, you can create impactful visualizations that support your data-driven decisions. Whether you're new to charting online or an experienced user, Boardmix offers the versatility and functionality you need to succeed.


