

A positioning map serves as a strategic tool to visualize your brand’s position relative to competitors and the broader market environment. However, not all positioning maps are created equal—different models cater to specific needs, from analyzing customer perceptions to evaluating external market forces.
In this article, we explore five essential positioning map models: Perceptual Maps, SWOT Analysis, Porter’s Five Forces Model, Value Proposition Canvas, and PEST Analysis. Each model offers unique insights, helping businesses identify opportunities, mitigate risks, and craft winning strategies.
Brand Positioning Map - Perception Map
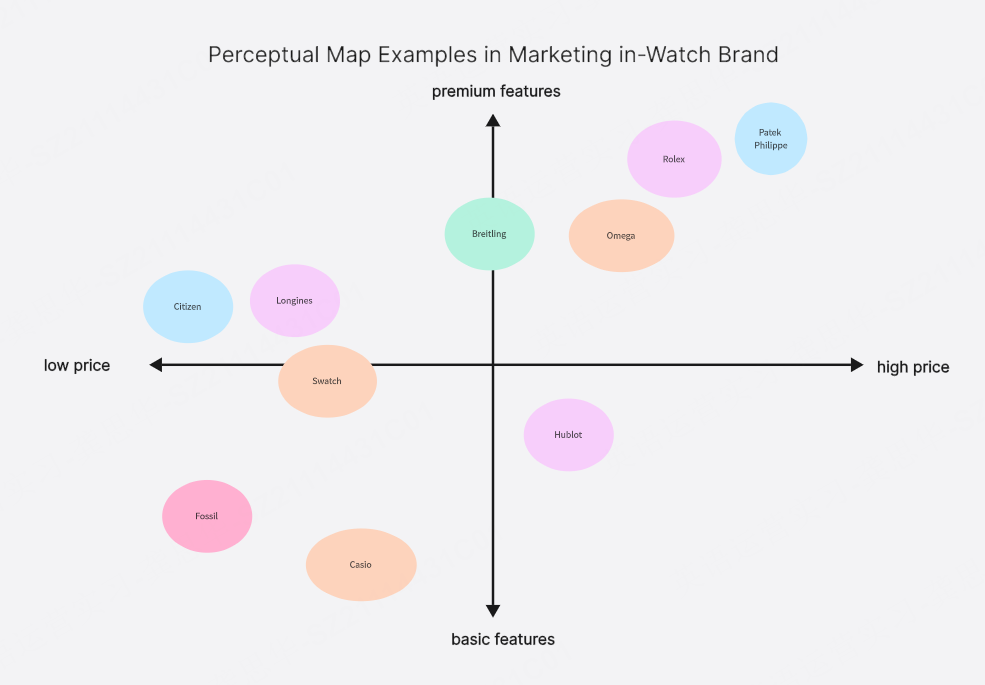
Perception map is a commonly used visual analysis tool in brand positioning map, which is used to present the differences in consumers' perception of a brand and its competitors in key attributes. The map is usually based on a two-dimensional coordinate system.
The horizontal and vertical axes represent the core dimensions that consumers pay attention to when making decisions (such as price level, functional innovation, quality perception, etc.). Each brand is marked in the corresponding position according to market research data, so as to intuitively show its market positioning and competitive landscape.
The core value of brand positioning map is to assist enterprises in identifying market opportunities and optimizing competitive strategies:
- Positioning calibration: By comparing the position of itself and competitors, evaluate whether the current positioning meets the expectations of target consumers;
- Opportunity mining: Discover the blank areas of market demand that are not fully met, and provide a basis for differentiation strategies;
- Competition avoidance:Avoid direct confrontation with strong opponents in overcrowded market segments to reduce the risk of resource loss.
Taking the new energy vehicle industry as an example, the early market positioning map often used "range" and "price" as the core dimensions. Tesla has opened up a new position outside the "practical" area dominated by traditional car companies by focusing on "high-end technology" and "long battery life", and successfully occupied the high-value market segment.
The brand positioning map simplifies complex market information and helps companies make data-driven decisions. It is an effective tool for small and medium-sized enterprises to optimize resource allocation and achieve precise breakthroughs.
Brand Positioning Map - SWOT Analysis
SWOT analysis is a strategic planning tool in the brand positioning map, which is used to systematically evaluate key factors in the internal and external environment of the enterprise. It represents the initials of four English words: Strengths, Weaknesses, Opportunities, and Threats.
Among them, Strengths and Weaknesses focus on the internal resources and capabilities of the enterprise (such as technology, funds, and teams), while Opportunities and Threats focus on the external market environment (such as policies, competition, and consumer trends).
The SWOT analysis chart reduces the complexity of decision-making through a structured framework. It is a practical tool for small and medium-sized enterprises to improve strategic clarity and balance risks and opportunities.
Brand Positioning Map - Porter's Five Forces Model
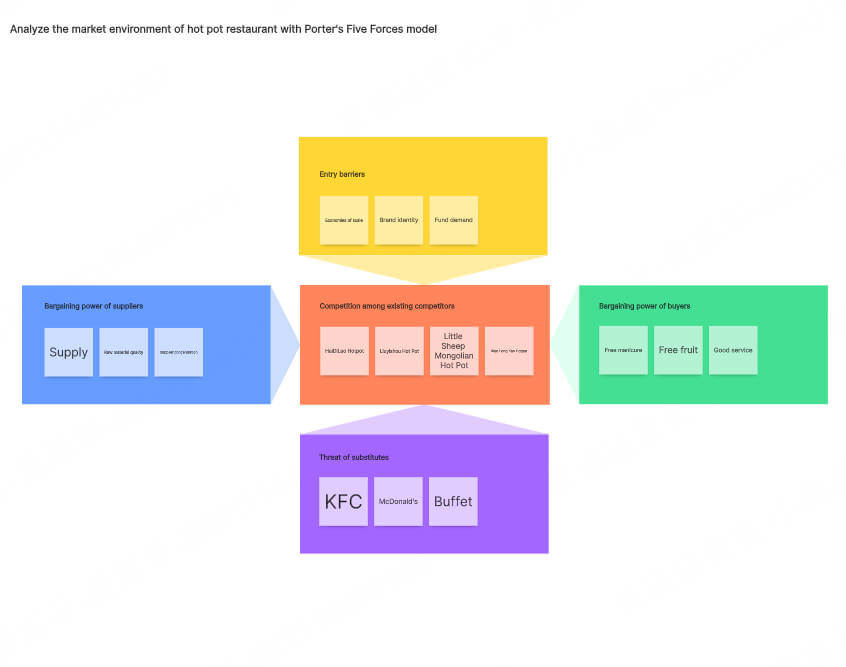
Porter's Five Forces Model was proposed by strategic scholar Michael Porter and is used to systematically analyze the competitive landscape of the industry in which the company is located. The model summarizes the industry's competitive pressure into five core forces: the intensity of confrontation between existing competitors, the threat of potential entrants, the ability of substitutes to replace, the bargaining power of suppliers, and the bargaining power of buyers.
The core value of Porter's Five Forces Model is to help companies identify industry competition risks and optimize strategic choices.
For example, if the bargaining power of suppliers in a certain industry is too strong (such as chip manufacturing to mobile phone manufacturers), companies need to reduce risks through diversified procurement; if the threat of substitutes is significant (such as takeout impacting the instant noodle market), it is necessary to accelerate product innovation to consolidate barriers.
For small and medium-sized enterprises, this model can assist in judging the feasibility of market entry or guide resources to tilt towards high-barrier, low-threat segments.
Brand Positioning Map - Value Proposition Canvas
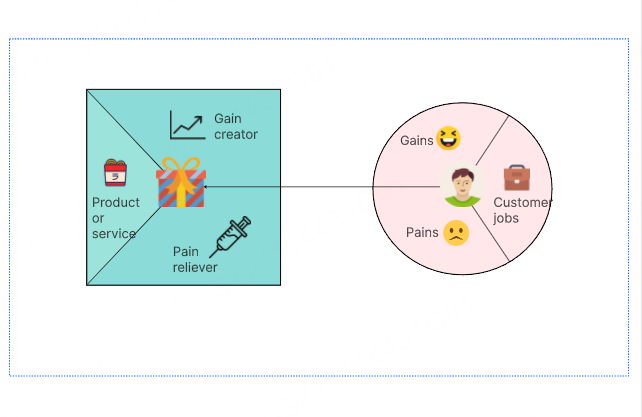
The brand value proposition canvas can help companies accurately match customer needs with the value provided by their own products or services. The canvas consists of two parts: Customer portrait (describing the core tasks, pain points and expected benefits of the target customer group) and Value map (sorting out the product functions, service experience and solutions designed by the company to meet customer needs). By juxtaposing the two for analysis, companies can systematically verify the effectiveness of the value proposition and avoid misalignment between supply and demand.
There are three steps to building a brand value proposition canvas:
- The first step: clarify the customer portrait through user interviews and behavioral data analysis, including the tasks that customers need to complete, the pain points when performing tasks, and the expected benefits;
- The second step: define the value map based on the customer portrait, list product functions, service commitments and customer pain points that can be eliminated;
- The third step: perform a matching test to ensure that each value provided by the company corresponds to at least one core customer need, and delete irrelevant or low-priority functions.
Taking the online education industry as an example, a language learning platform found through the canvas that the core pain point of the target users (newcomers in the workplace) is "fragmented time makes it difficult to learn systematically", while the original course design of the platform focuses on a long class system. By adjusting and launching "15-minute scenario-based micro-classes" and matching them with instant feedback functions, user retention and paid conversion rates have been significantly improved.
The brand value proposition canvas helps small and medium-sized enterprises optimize innovation paths with a customer-centric approach by structurally deconstructing the supply and demand relationship, and is a practical tool to enhance market competitiveness.
Brand Positioning Map - PEST Analysis
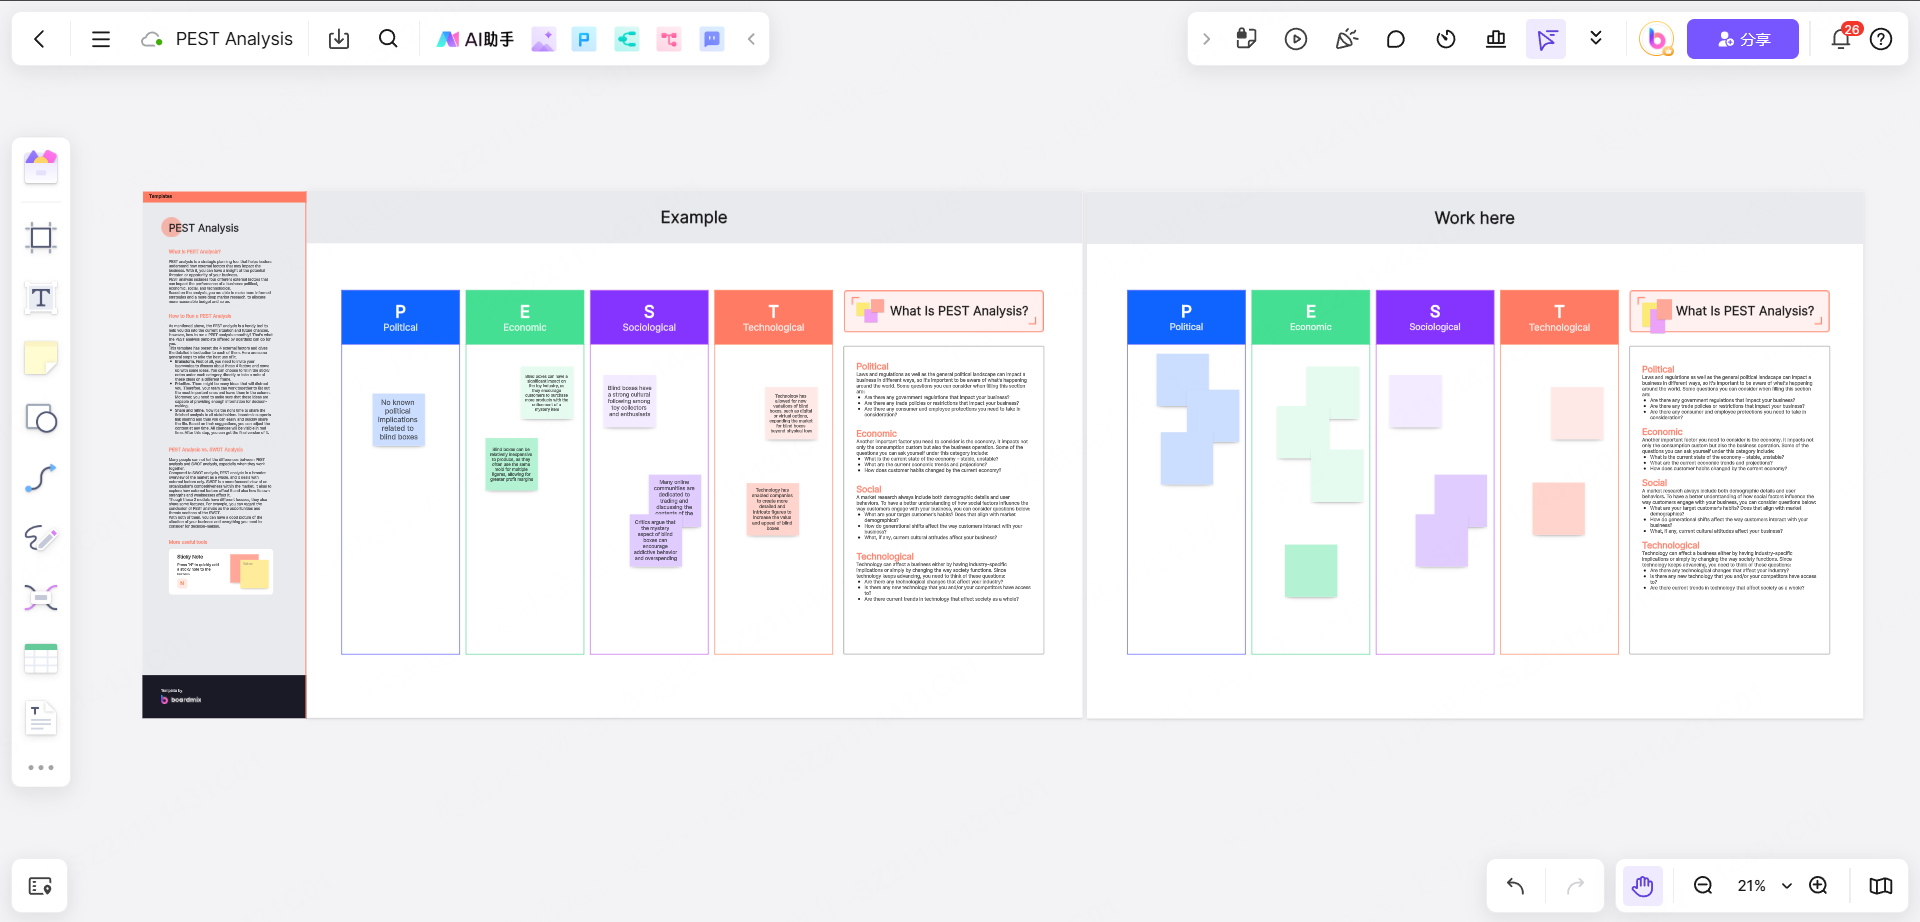
PEST analysis is a strategic tool used to evaluate the external macro-environment of an enterprise. Its name is composed of the initials of four key factors: political, economic, social, and technological. This tool systematically scans the external environment of the enterprise, identifies macro trends and potential risks that may affect business development, and provides a basis for the enterprise to formulate long-term strategies.
There are four steps to create a PEST analysis chart:
Step 1: Clarify the scope of analysis (such as a regional market or industry field);
Step 2: Collect data related to the four factors (such as policy documents, economic indicators, social surveys, and technical reports);
Step 3: Evaluate the impact of each factor on the enterprise item by item (such as whether a certain policy brings market access barriers);
Step 4: Summarize the conclusions and formulate response strategies (such as planning research and development in advance for technological changes). Pay attention to dynamic and regional differences when analyzing.
PEST analysis helps small and medium-sized enterprises identify opportunities and risks by systematically scanning the external environment. It is an important tool for formulating long-term strategies.
Create Your Brand Positioning Map with Boardmix
Boardmix is an online collaboration platform with AI ability, which is designed for team collaboration and suitable for drawing various strategic charts, including brand positioning maps. Here are the main features for creating brand positioning map:
- User-friendly interface: Simple and intuitive operation interface, suitable for beginners to quickly get started.
- Rich template library: Provides a variety of preset templates (such as SWOT analysis, perceptual map, etc.) to save creation time.
- Real-time collaboration: Supports multi-person online editing and commenting to improve team communication efficiency.
- AI template generation capability: Built-in AI chart tool, which can quickly convert content into visual graphics.
- Cross-platform support: Supports web, desktop and mobile terminals, access and edit anytime, anywhere.
Steps to create a brand positioning map with Boardmix
- Register and log in to Boardmix
Visit the Boardmix official website, click the "Register" button, fill in the email or use a third-party account (such as Google) to quickly register.
After completing the email verification, log in to the account to enter the workspace.
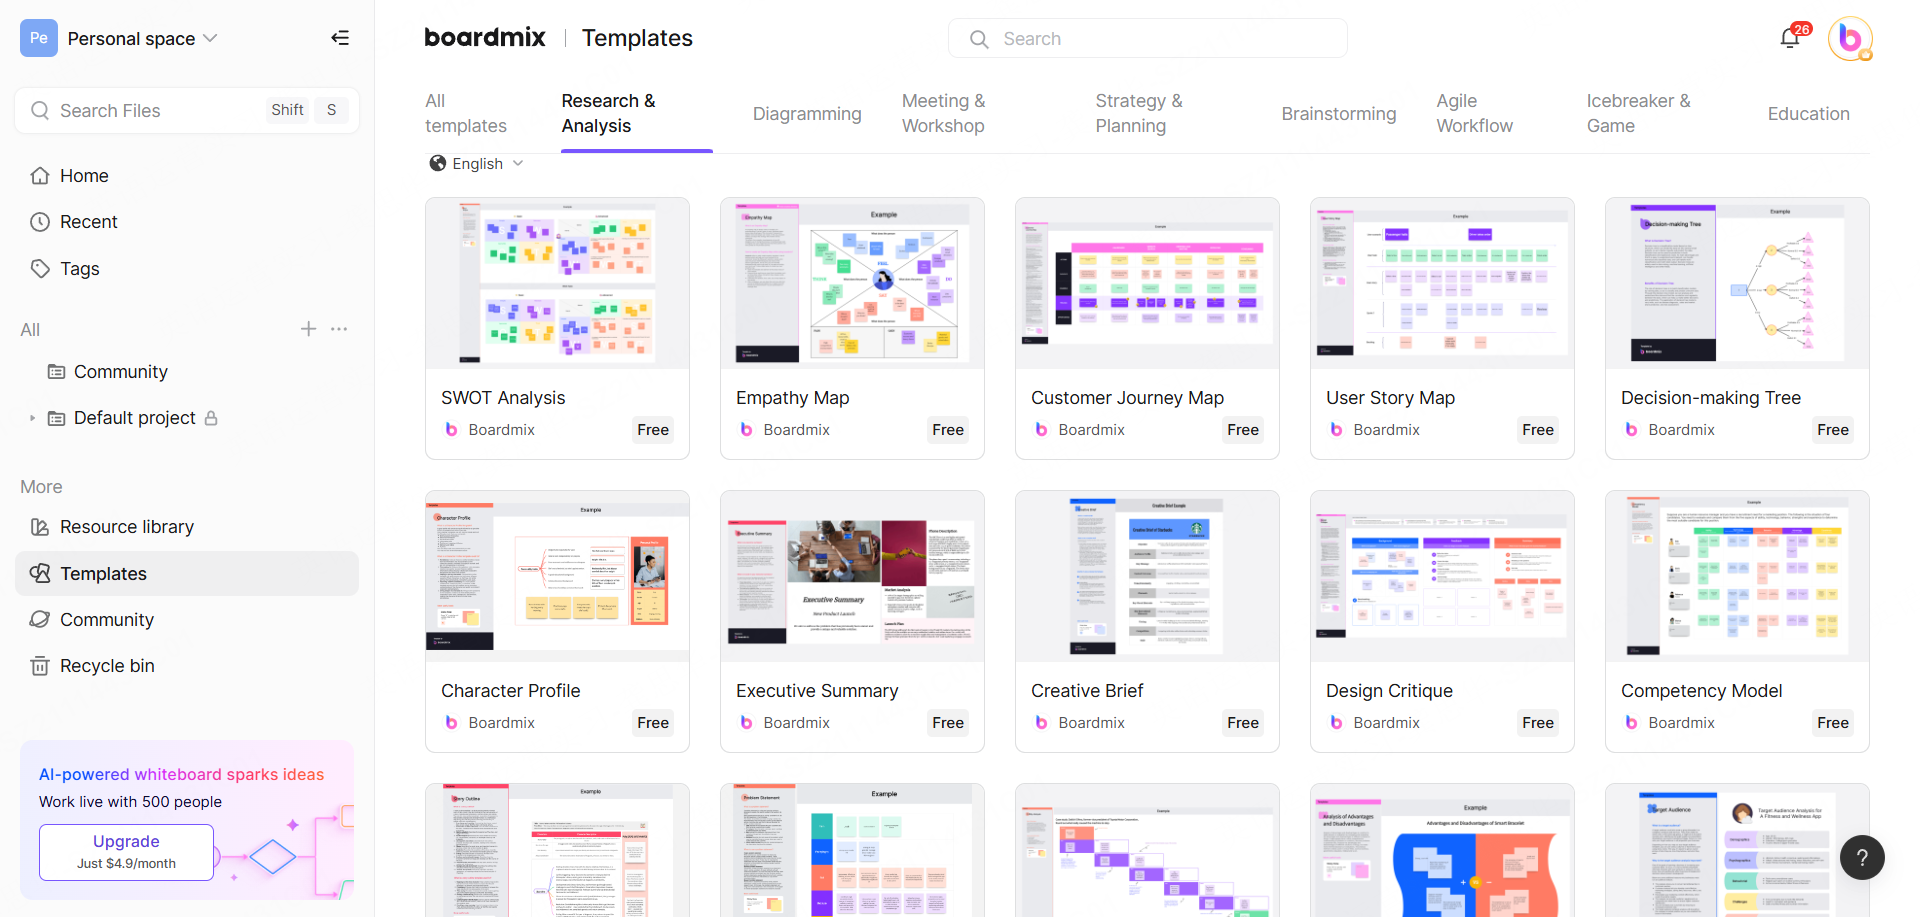
- Select a brand positioning template
Click "New Project" on the homepage and select the "Strategic Analysis" category.
Select a template that suits your needs (such as a perceptual map, SWOT analysis, etc.), or start with a blank canvas.
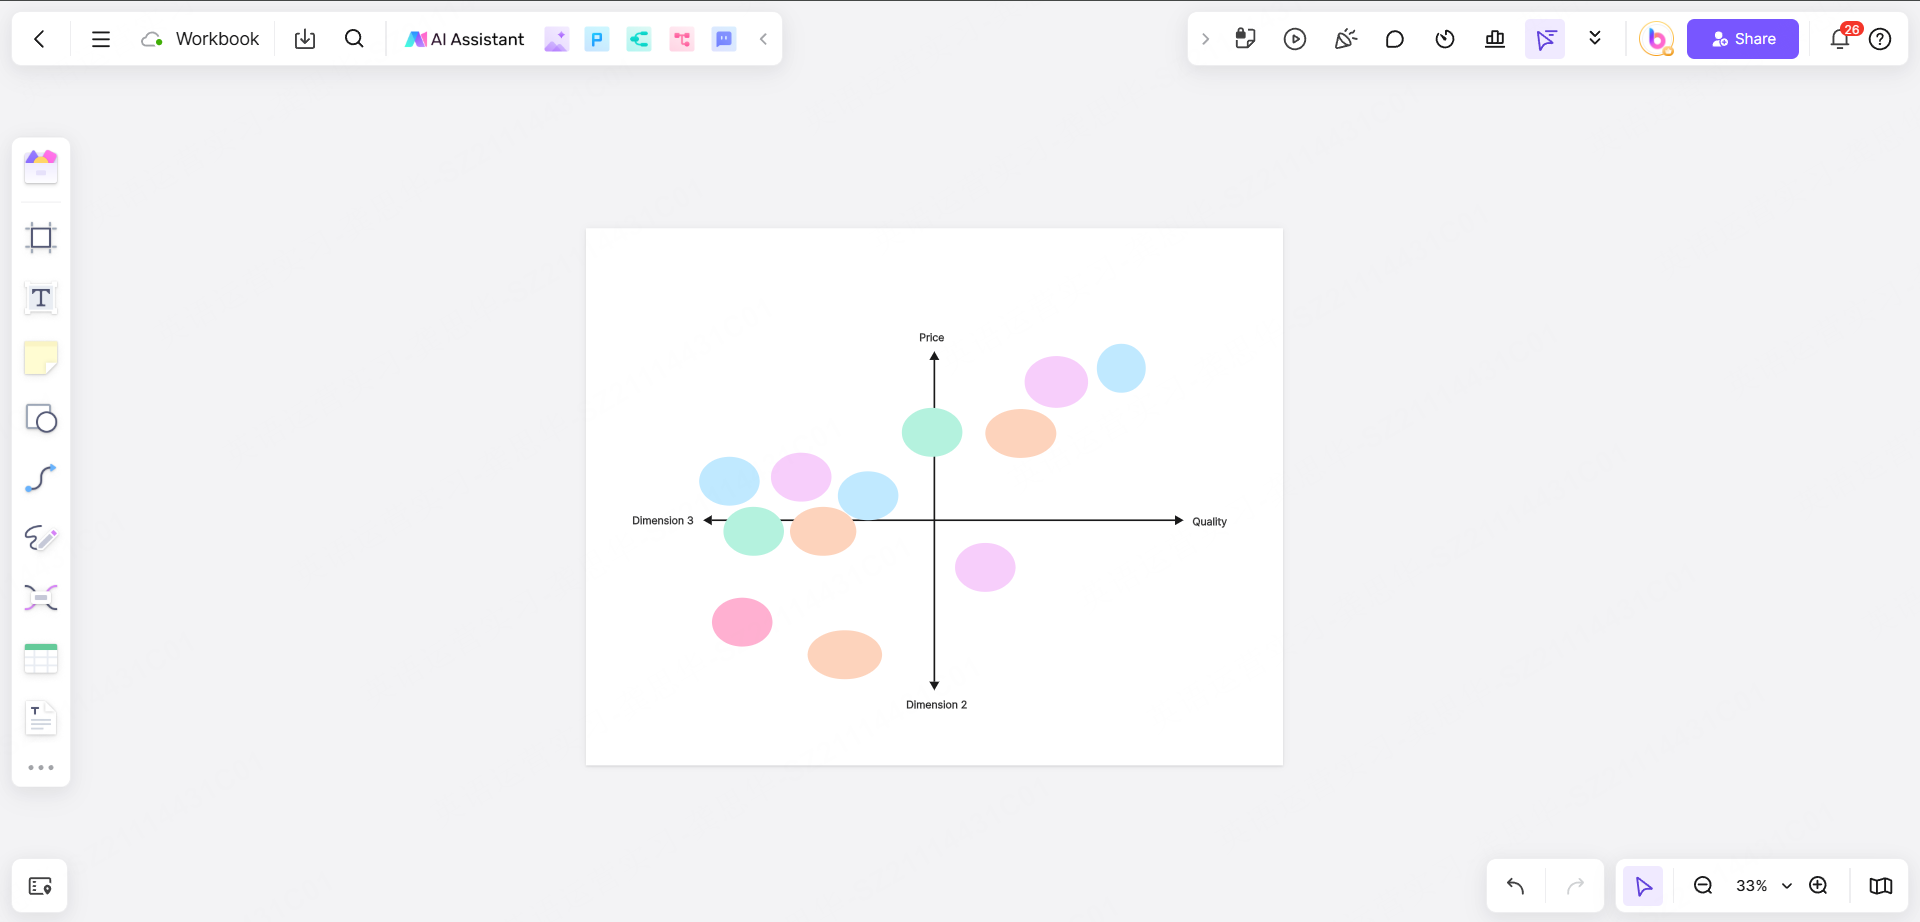
- Add brand positioning information
Define the axes: For a perceptual map, drag the text box to mark the horizontal and vertical axes (such as "price" vs. "quality").
Mark brand positions: Use shape tools (such as circles and rectangles) to represent different brands and adjust the positions to match consumer perception data.
Add descriptions: Use the annotation tools to add detailed descriptions for each brand or data point (such as market share, user reviews).
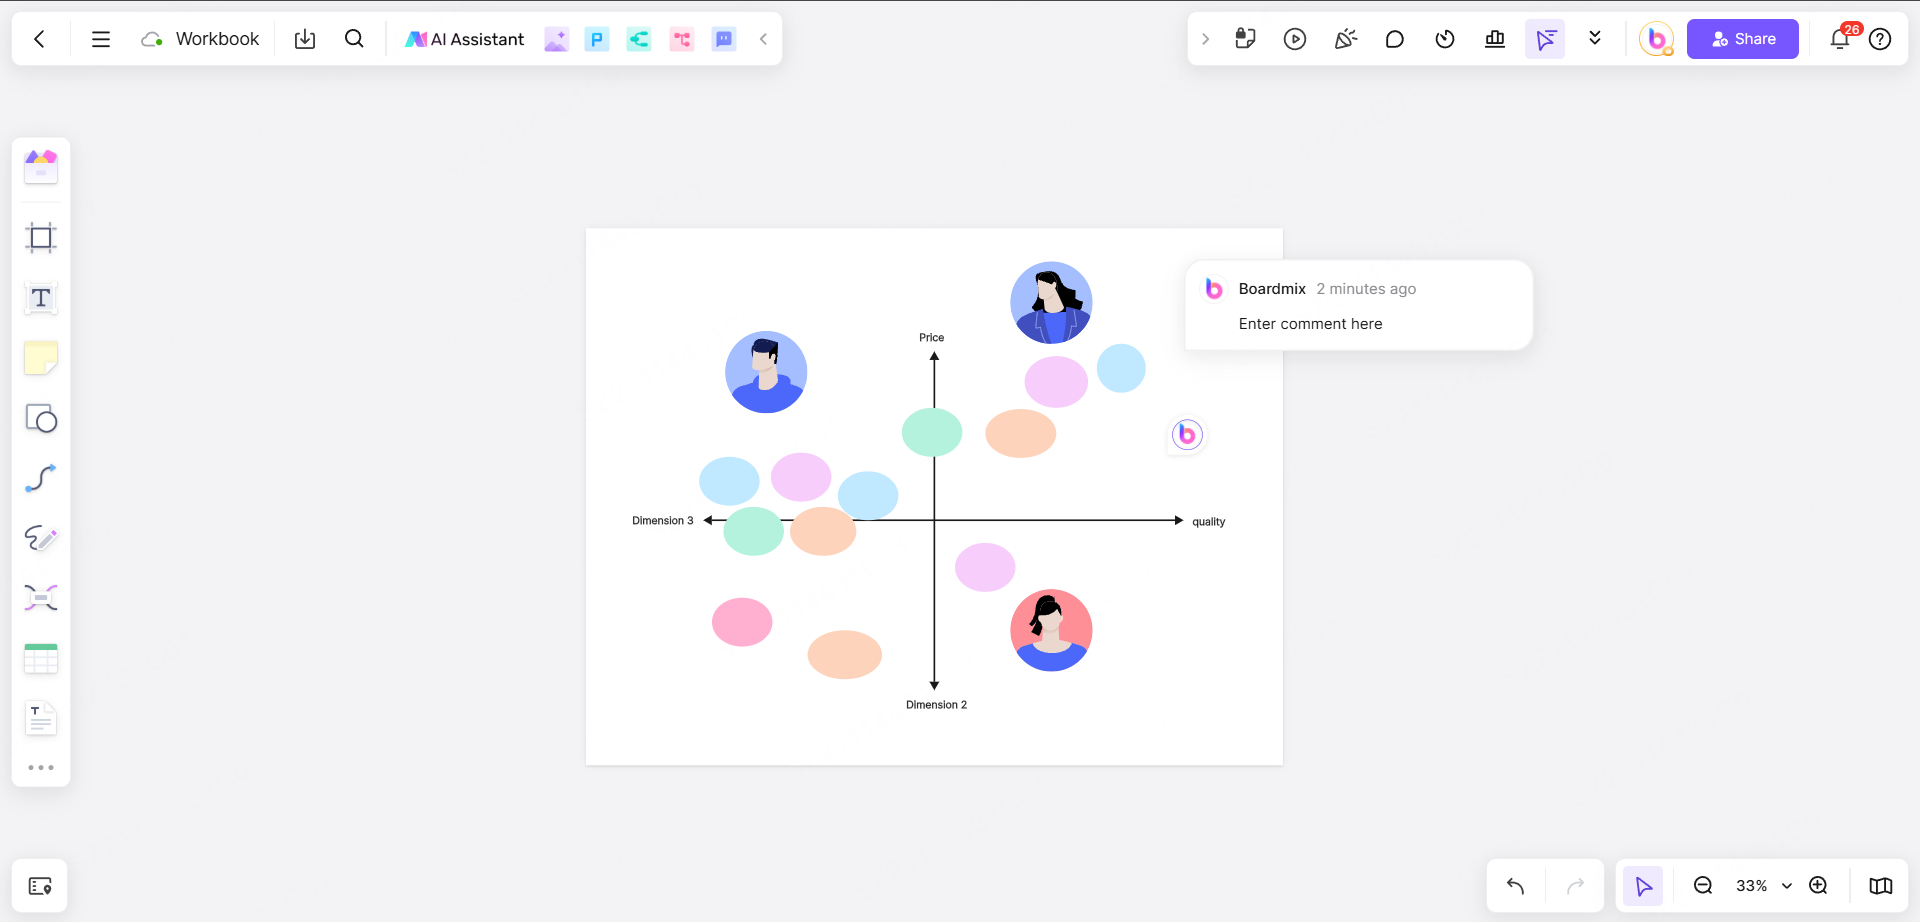
- Collaborate and optimize the brand positioning map
Invite team members to join the project and assign editing or commenting permissions.
Discuss optimization suggestions and adjust chart details through real-time chat or commenting functions.
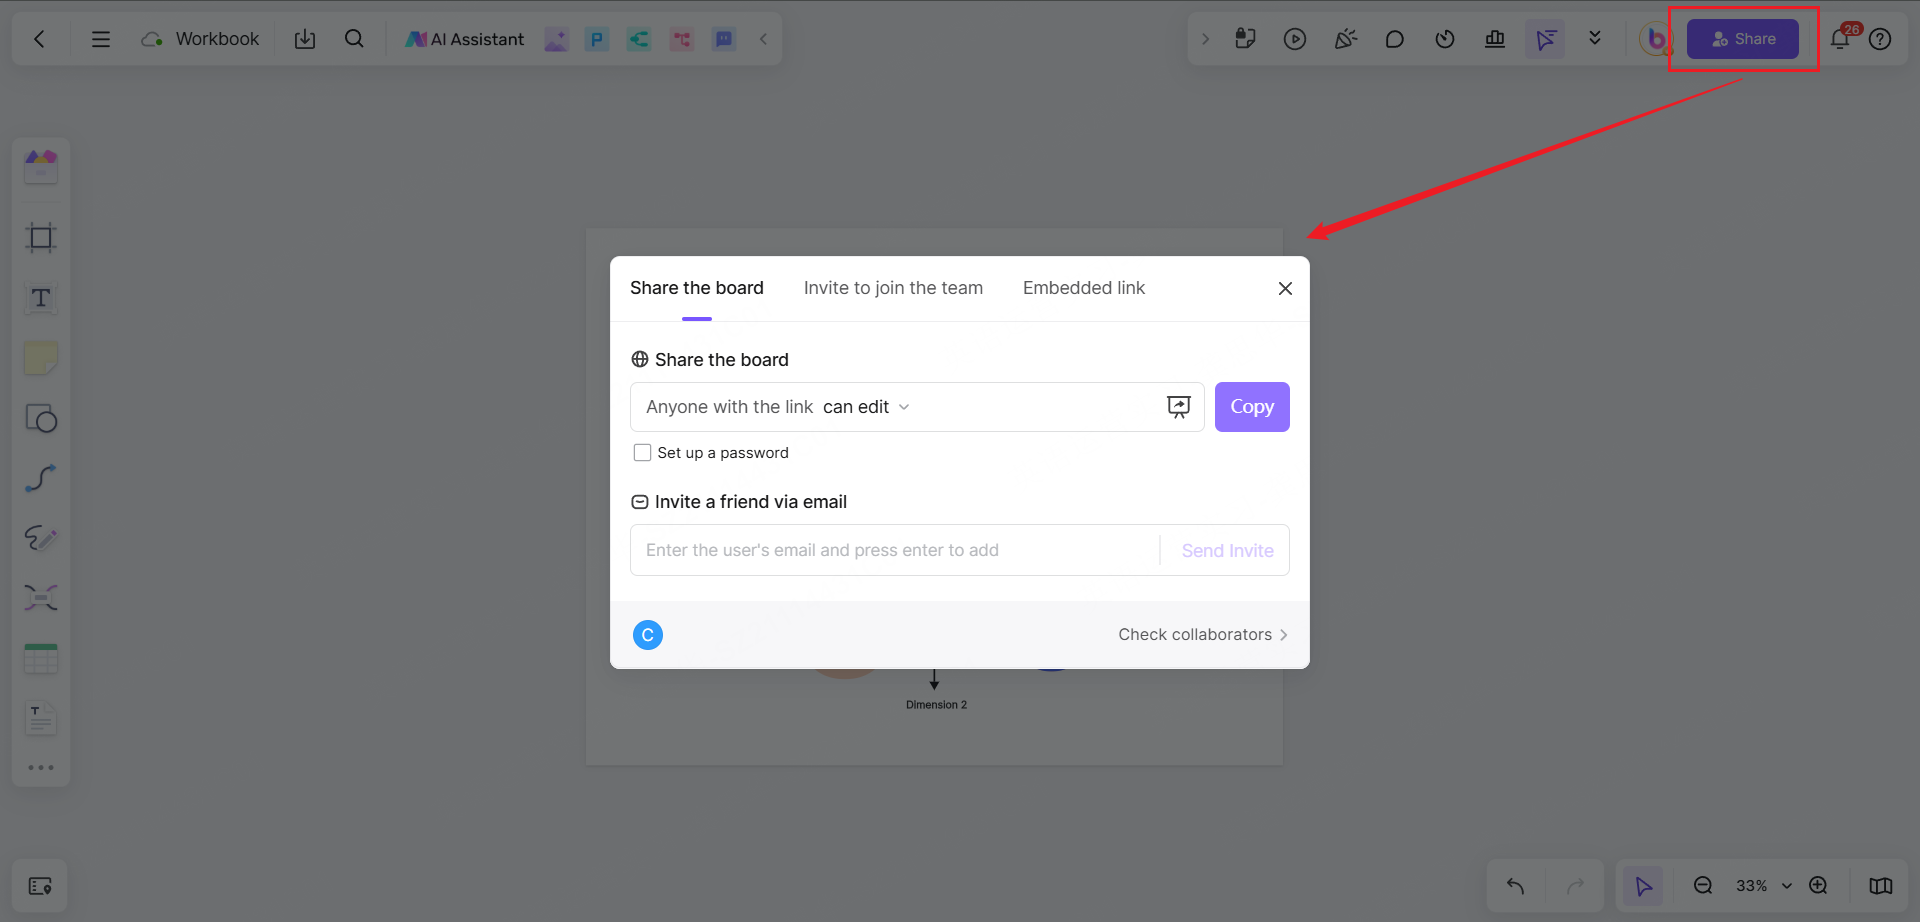
- Export and share your brand positioning map
Click the "Export" button in the upper right corner and select the file format (such as PNG, PDF, PPT).
Set the export scope (such as the current page or all content), and click "Download" to save it locally.
Generate an accessible link through the link sharing function for external partners to view.
With its ease of use and collaboration features, Boardmix is an ideal tool for companies to draw brand positioning maps, helping teams to efficiently complete strategic analysis and decision support.
Conclusion
Positioning maps use visual methods to clearly present the corporate strategic framework to help people make more informed decisions. You can use a perception map to understand customer perception, a SWOT analysis to balance internal strengths with external opportunities, or a PEST analysis to predict changes in the macro environment. Each model provides a unique perspective to improve your brand positioning.
As a whiteboard for team collaboration and project management, Boardmix provides powerful drawing functions and is a free platform for companies to draw brand positioning maps. Use Boardmix to create your brand positioning map for free now!


