

When encountering complex problems in team collaboration or business optimization, intuition is often not enough to find the root cause. Process mapping is a visual method that can help teams sort out processes, identify bottlenecks, and find the best improvement plan. This article will introduce how to use process mapping to solve problems efficiently, and provide free online tools and free templates for drawing process maps.
What Is Process Mapping?
Process mapping is a way to visually display the steps, key players, decision points, and information flow within a process. It's like drawing a map that guides you through a project or a workflow.
The main goals of process mapping are to:
- Identify inefficiencies: Spot the slow or redundant steps that might be holding you back.
- Streamline processes: Eliminate unnecessary steps to make your process smoother.
- Improve team alignment: Ensure everyone understands the process, which boosts collaboration and reduces confusion.
The following are common process map types and their core functions to help you accurately select tools according to your needs:
Types of Process Mapping
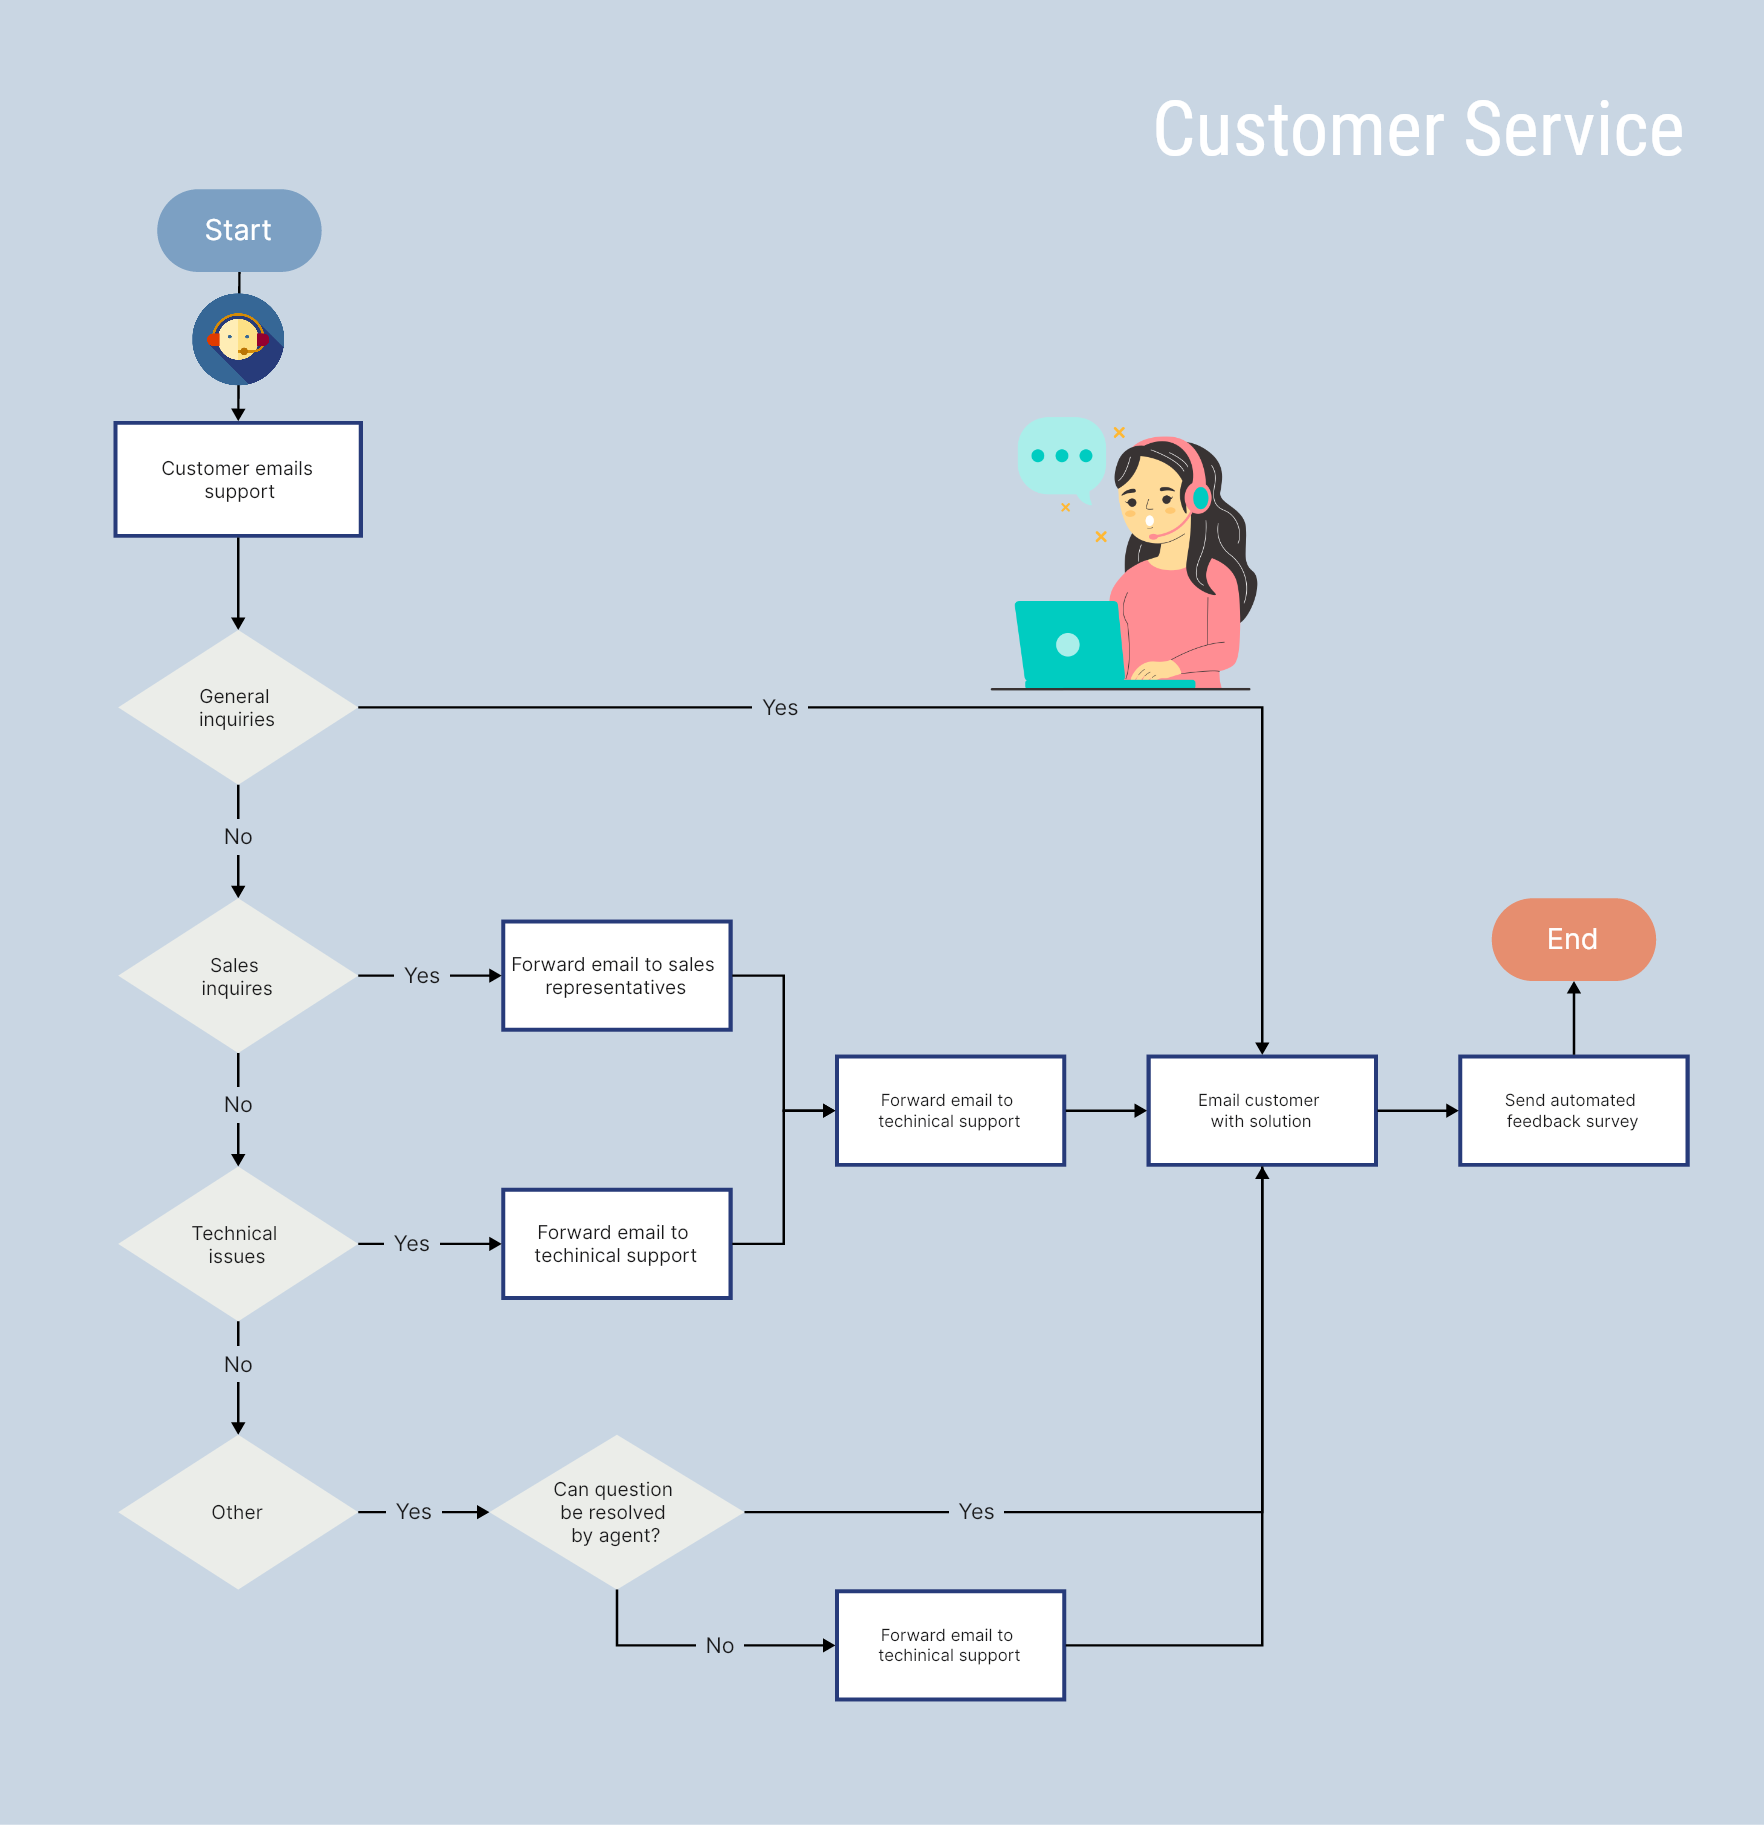
Flowchart
Flowchart is a basic tool suitable for most scenarios, which uses standardized symbols (such as arrows and boxes) to intuitively display the linear steps of the process. It quickly sorts out the process logic, identify redundant links or execution bottlenecks, and is suitable for new employee training or cross-team process alignment.
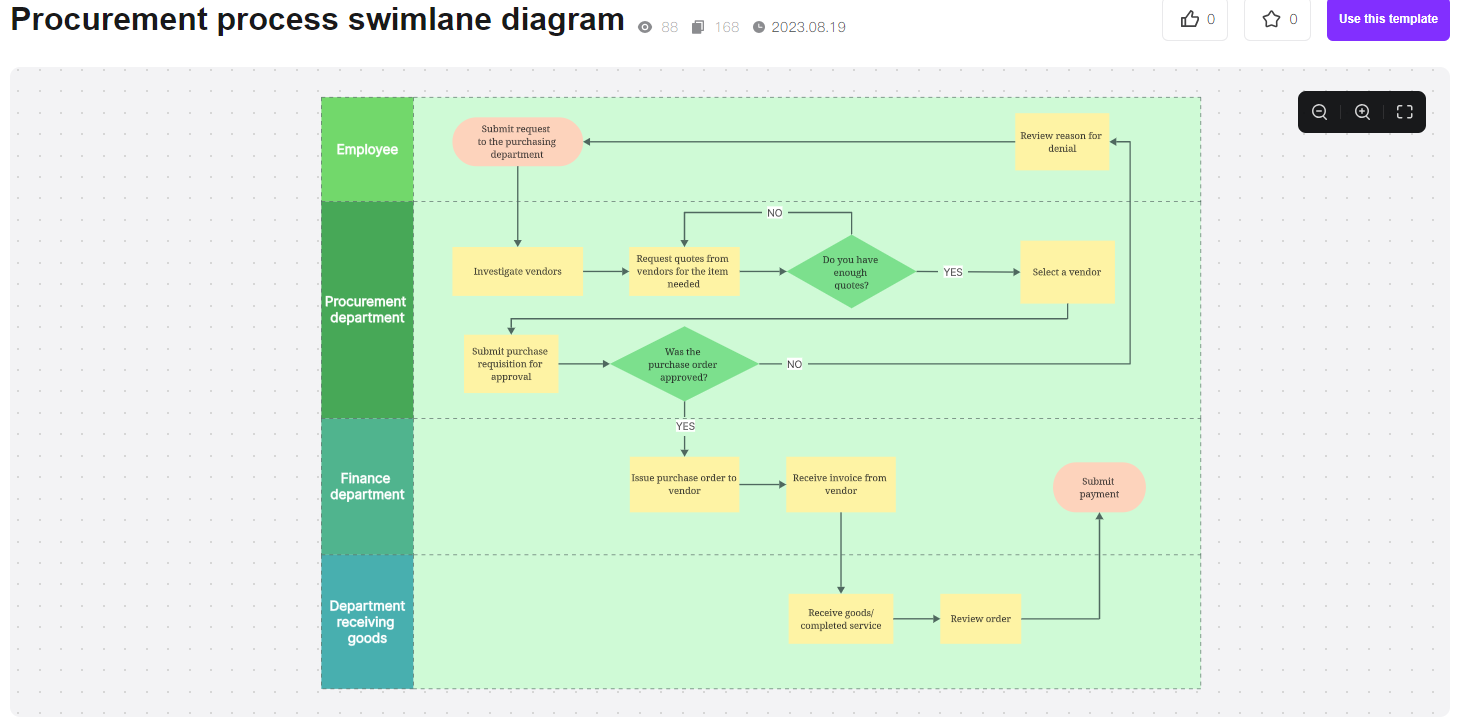
Swimlane Diagram
Swimlane diagram use "lanes" to divide the scope of responsibility of different roles or departments, such as the marketing department and the customer service department each occupy a column. It can clarify the boundaries of power and responsibility, solve the problem of buck-passing in cross-departmental collaboration, and is especially suitable for locating "who should do what" in complex processes.
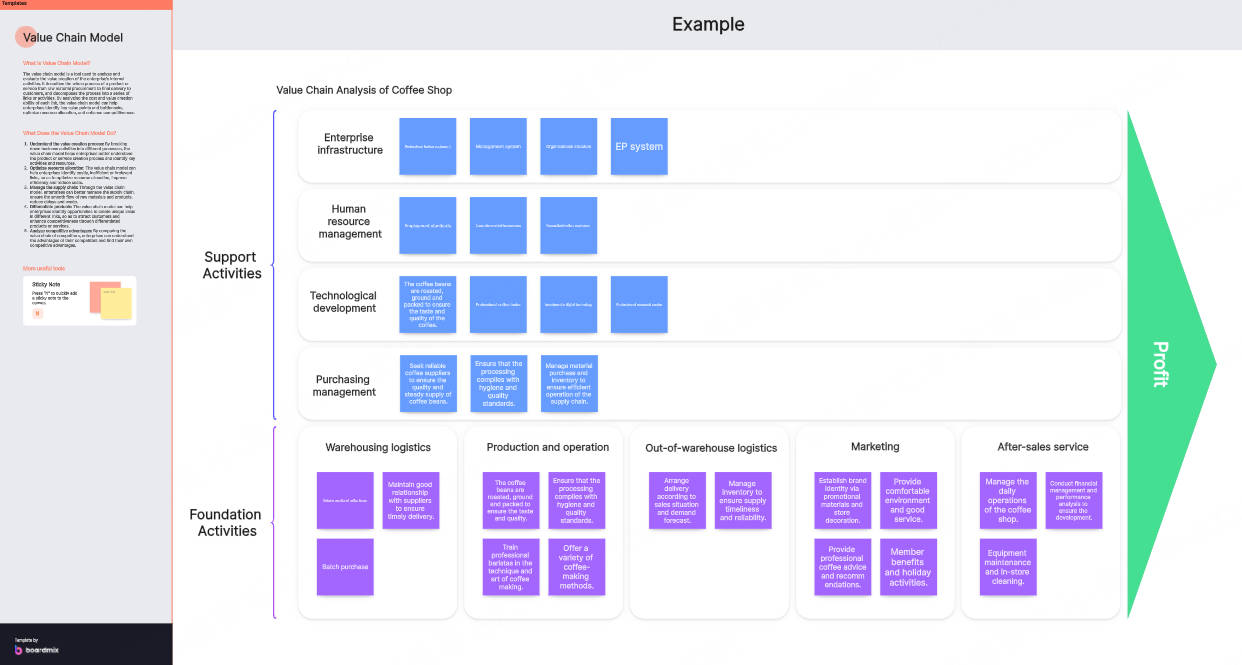
Value Stream Map
The value stream map focus on distinguishing between value-added and non-value-added activities, marking the flow of materials, information and time consumption. It can systematically eliminate waste (such as waiting, over-processing), optimize end-to-end efficiency, and is often used in manufacturing and service delivery chain transformation.
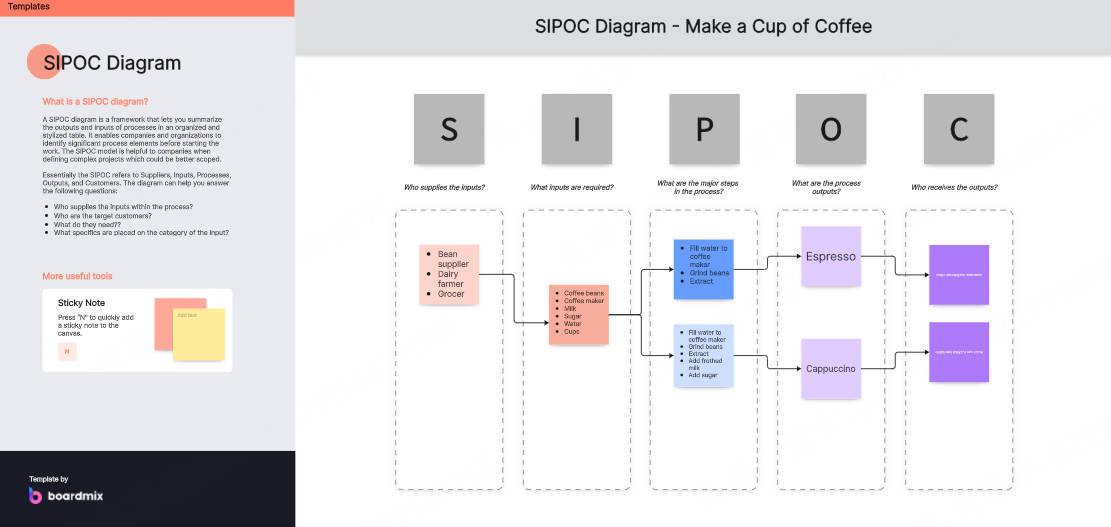
SIPOC diagram (Suppliers, Inputs, Process, Outputs, Customers)
The SIPOC diagram defines the process boundaries using a five-element framework (suppliers-inputs-processes-outputs-customers). It quickly presents a global perspective and ensures that the needs of key stakeholders (such as suppliers and customers) are aligned. It is suitable for project launch or the early stages of process reconstruction.
3. Why Use Process Mapping for Problem Solving?
Process Mapping Helps Identify Root Causes
When you map out your process, you can quickly pinpoint where things are going wrong instead of just fixing symptoms. For example, in a customer support process, a clear process map might reveal that slow response times are causing delays rather than insufficient training. This clarity allows you to address the real issues and make more effective improvements.
Process Mapping Improves Team Collaboration
A visual process map ensures that everyone involved understands how the process works. This shared understanding reduces miscommunication and helps teams work together more smoothly. For instance, in cross-department projects, a swimlane diagram can clearly show who is responsible for each step, making teamwork more efficient.
Process Mapping Provides a Basis for Continuous Improvement
Once you have a process map, you have a clear picture of your workflow, which serves as a baseline for making improvements. Teams can regularly revisit the map, spot bottlenecks, and experiment with changes. For example, in software development, a value stream map might reveal delays in testing that you can then work to eliminate. This ongoing review supports continuous improvement and keeps processes running at their best.
Using process mapping for problem solving is a smart way to take control of your workflow, boost team collaboration, and drive ongoing success. Give it a try to see where you can make a real difference!
Step-by-step Guide: How to Create Process Map for Solving Problem?
How to quickly create a process map and solve the problem? Boardmix online whiteboard is a tool worth trying. It not only supports multiple types of process maps, but also provides a free template library, making professional mapping as easy as building blocks.
Why choose Boardmix to create a process map?
- Covering all types of process maps
Boardmix supports all mainstream process map types and presets symbol libraries for different scenarios:
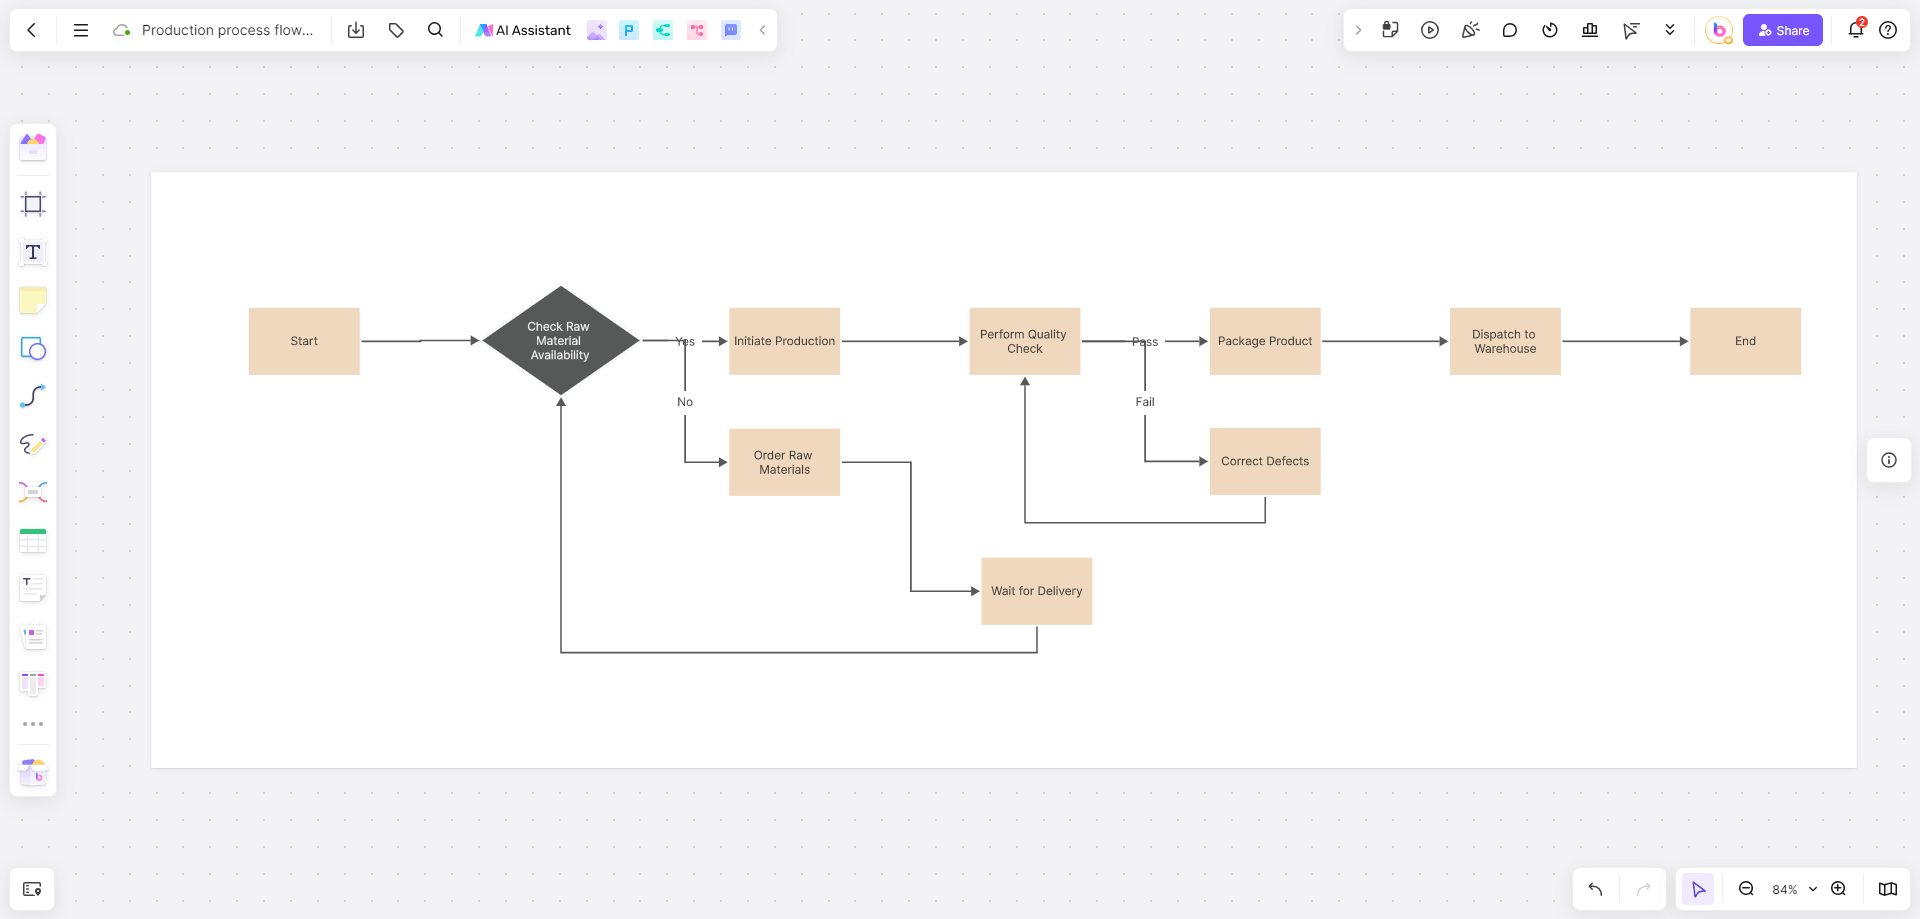
Flowchart: drag and drop standardized symbols (decision diamonds, process boxes), and complete the steps in 5 minutes;
Swimlane Diagram: add horizontal/vertical lanes with one click to clarify departmental responsibilities (such as "customer service receives requirements → technical department processes → finance department settles");
Value Stream Map: built-in timeline, inventory identifier, intuitive analysis of value-added links;
SIPOC diagram: quickly fill in suppliers, input and output items, and clarify process boundaries.
For example, an e-commerce company used Boardmix lane diagram to optimize the return process, dividing it horizontally into four lanes: "customer, customer service, warehousing, and finance". It was found that "financial refund delay" was the bottleneck. After rectification, the average return cycle was reduced from 7 days to 2 days.
- Free and ready-made template library
Boardmix has ready-to-use templates. Users can search for keywords such as "flowchart" and "value stream analysis" and directly apply templates for industries such as retail, manufacturing, and IT services;
Flexibly customize templates, modify color schemes, add and delete nodes, and adjust movement lines to adapt to the unique needs of enterprises.
- Multi-person real-time collaboration and version management
Team members can edit and comment synchronously, and mark process pain points (such as "quality inspection steps need to be added to this link"); Boardmix online whiteboard will automatically save historical versions, and backtrack or compare optimization effects at any time.
- Seamless connection between multiple terminals
Boardmix supports drawing on the computer, previewing on the mobile phone, and presentation on the tablet, and iteration anytime, anywhere.
How to create a process map with Boardmix templates?
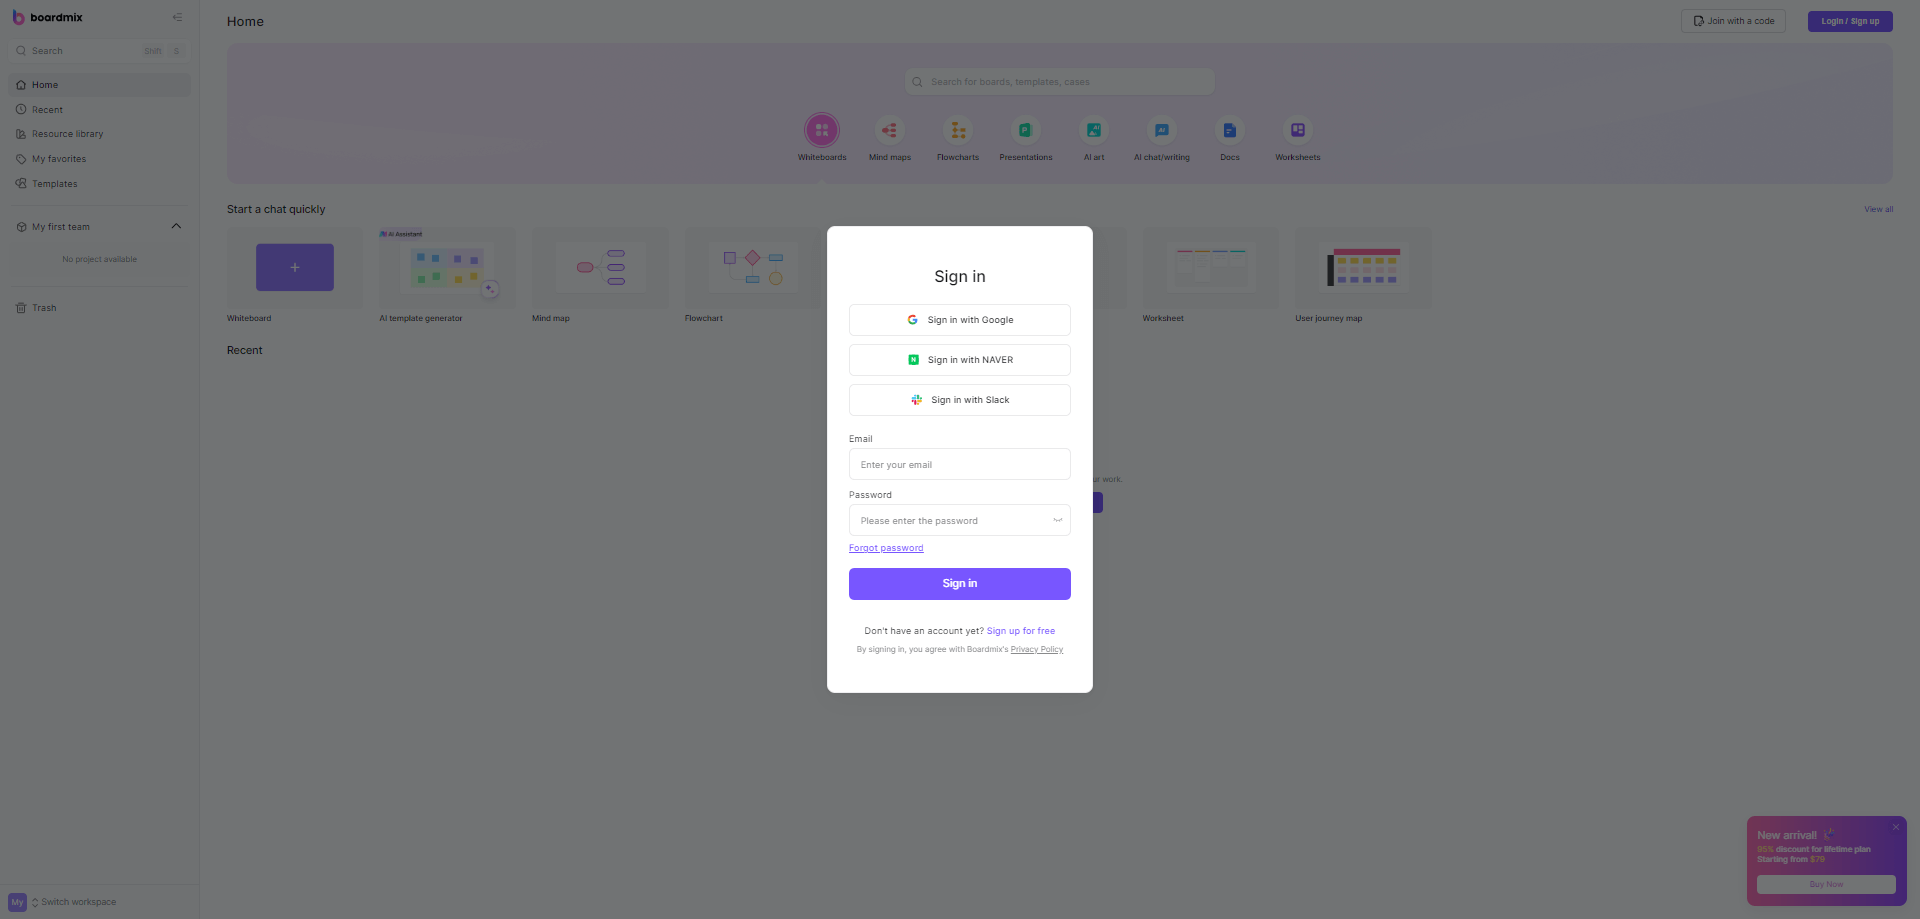
Step 1: Visit and log in to your Boardmix account
Visit the Boardmix official website and click to register to get a free Boardmix account.
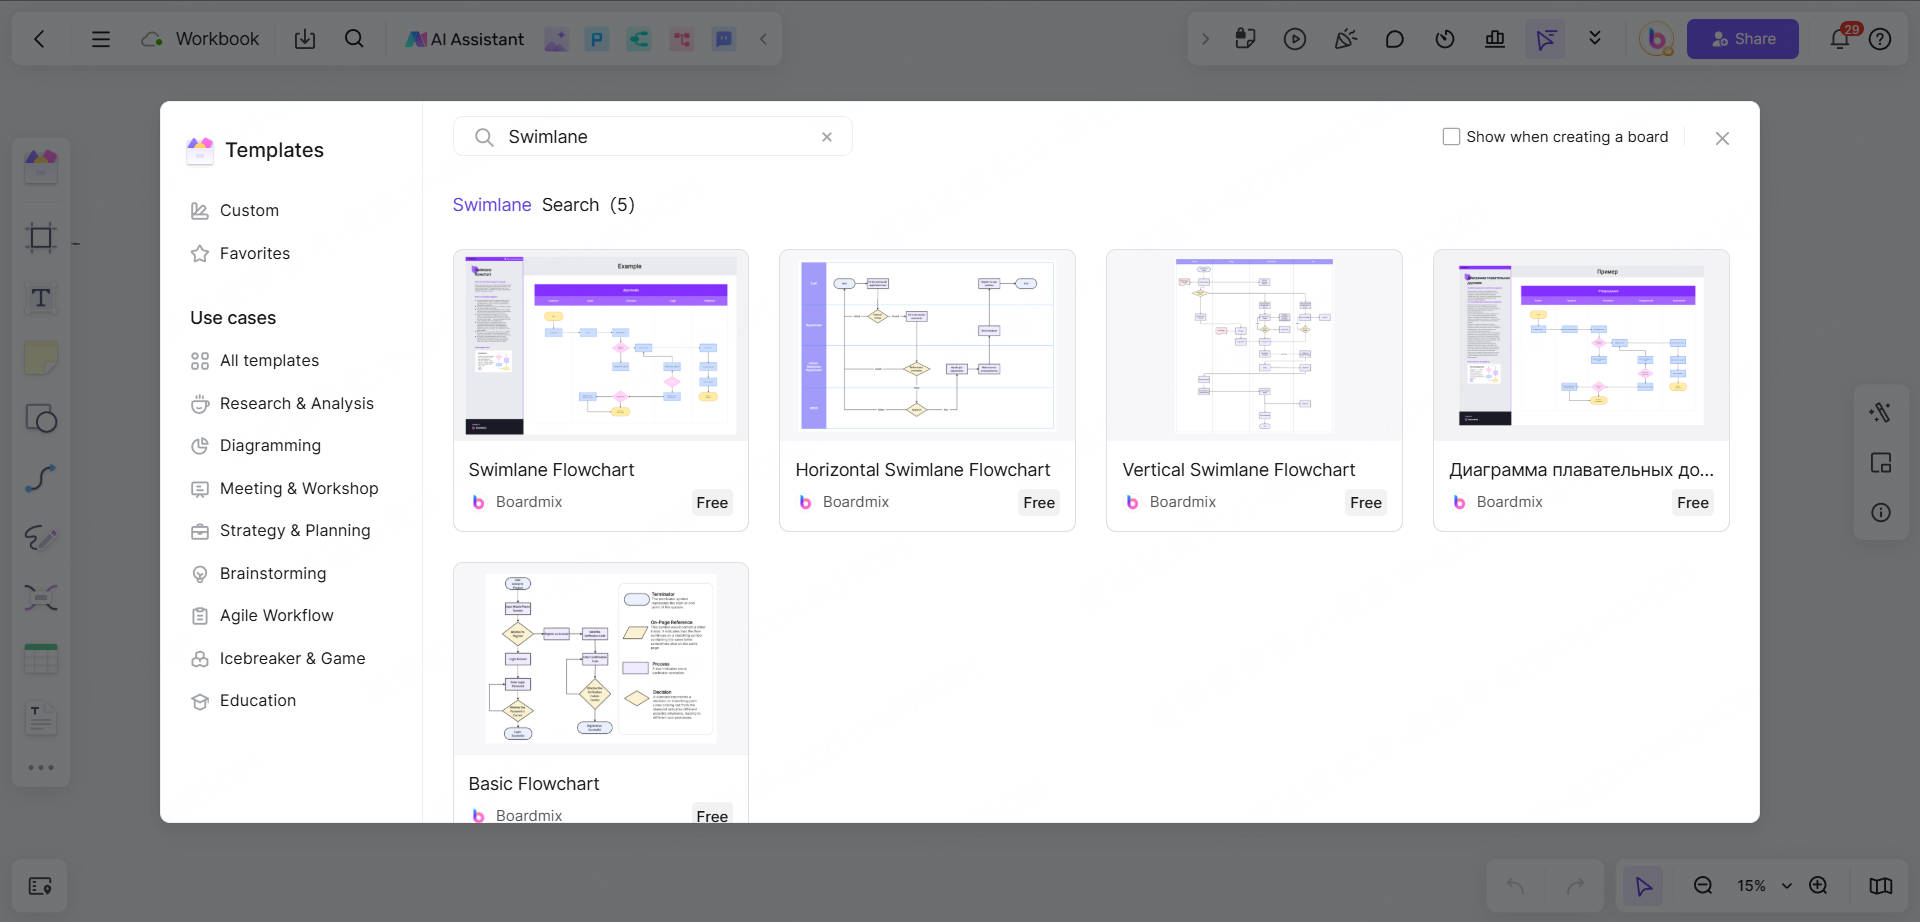
Step 2: Choose a suitable process template
If you need to clarify responsibilities, choose the "Swimming Lane Diagram Template";
If you need to eliminate waste, choose the "Value Stream Map Template";
If you need a global overview, choose the "SIPOC Diagram Template".
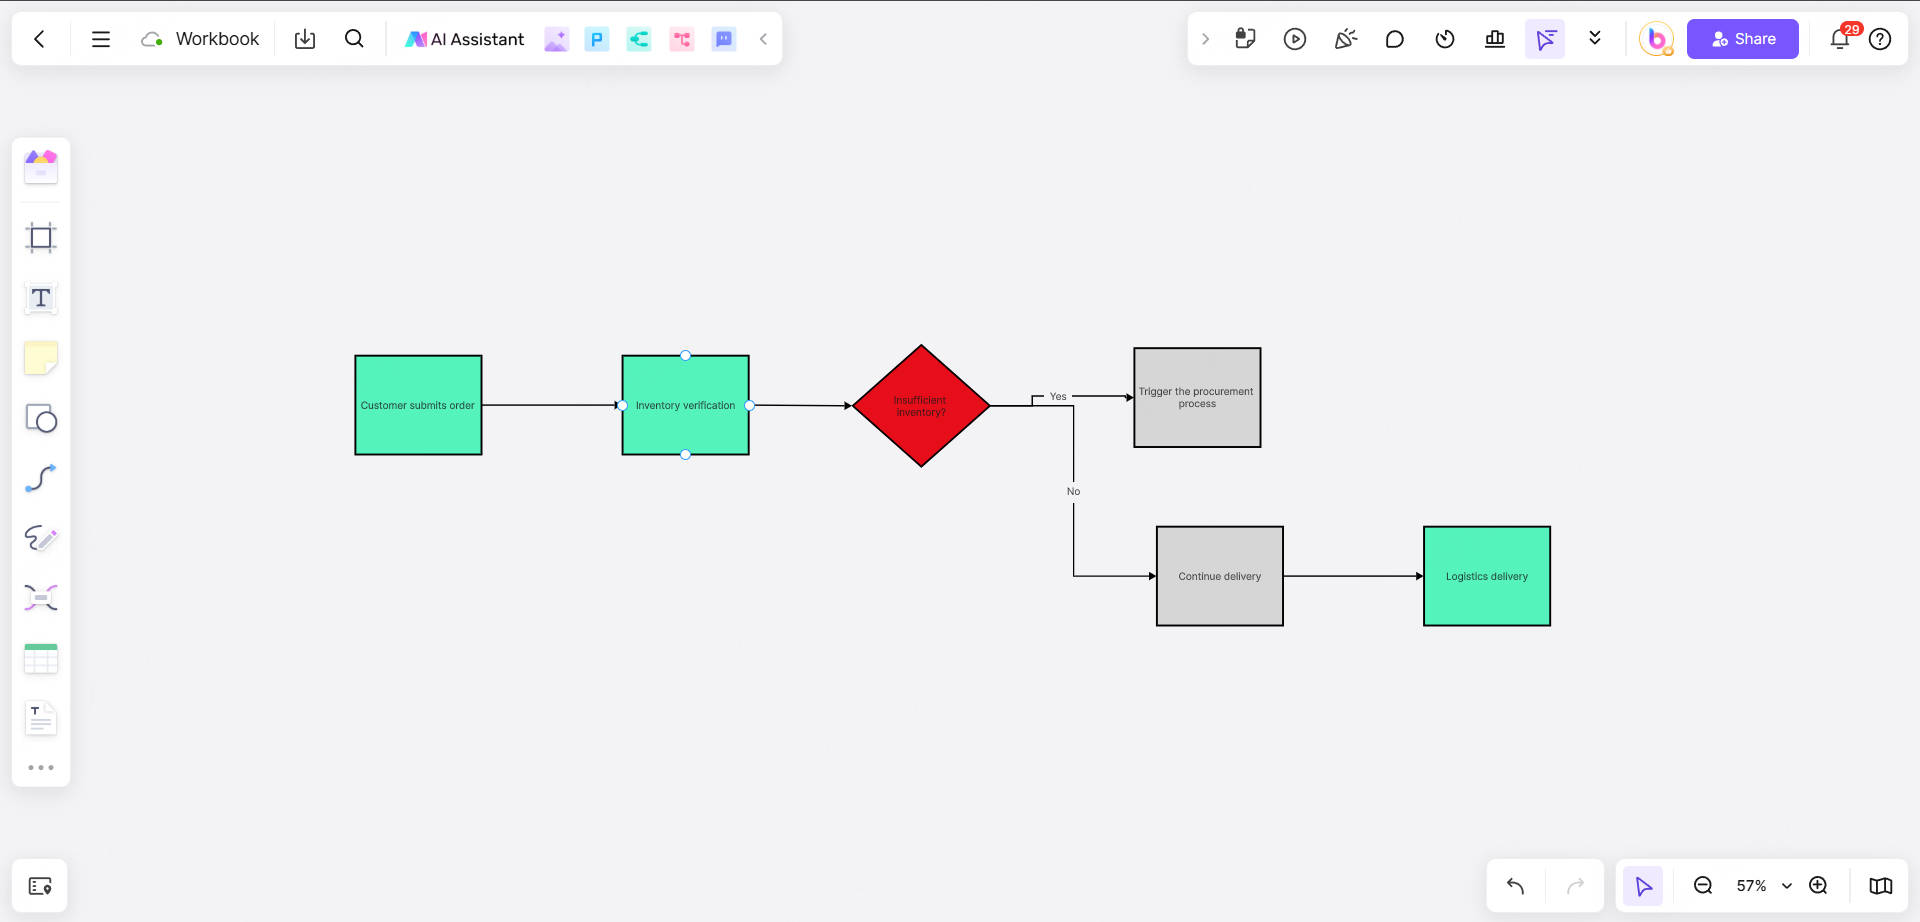
Step 3: Fill in the flowchart content and focus on the core issues
For example, when drawing a flowchart, you can:
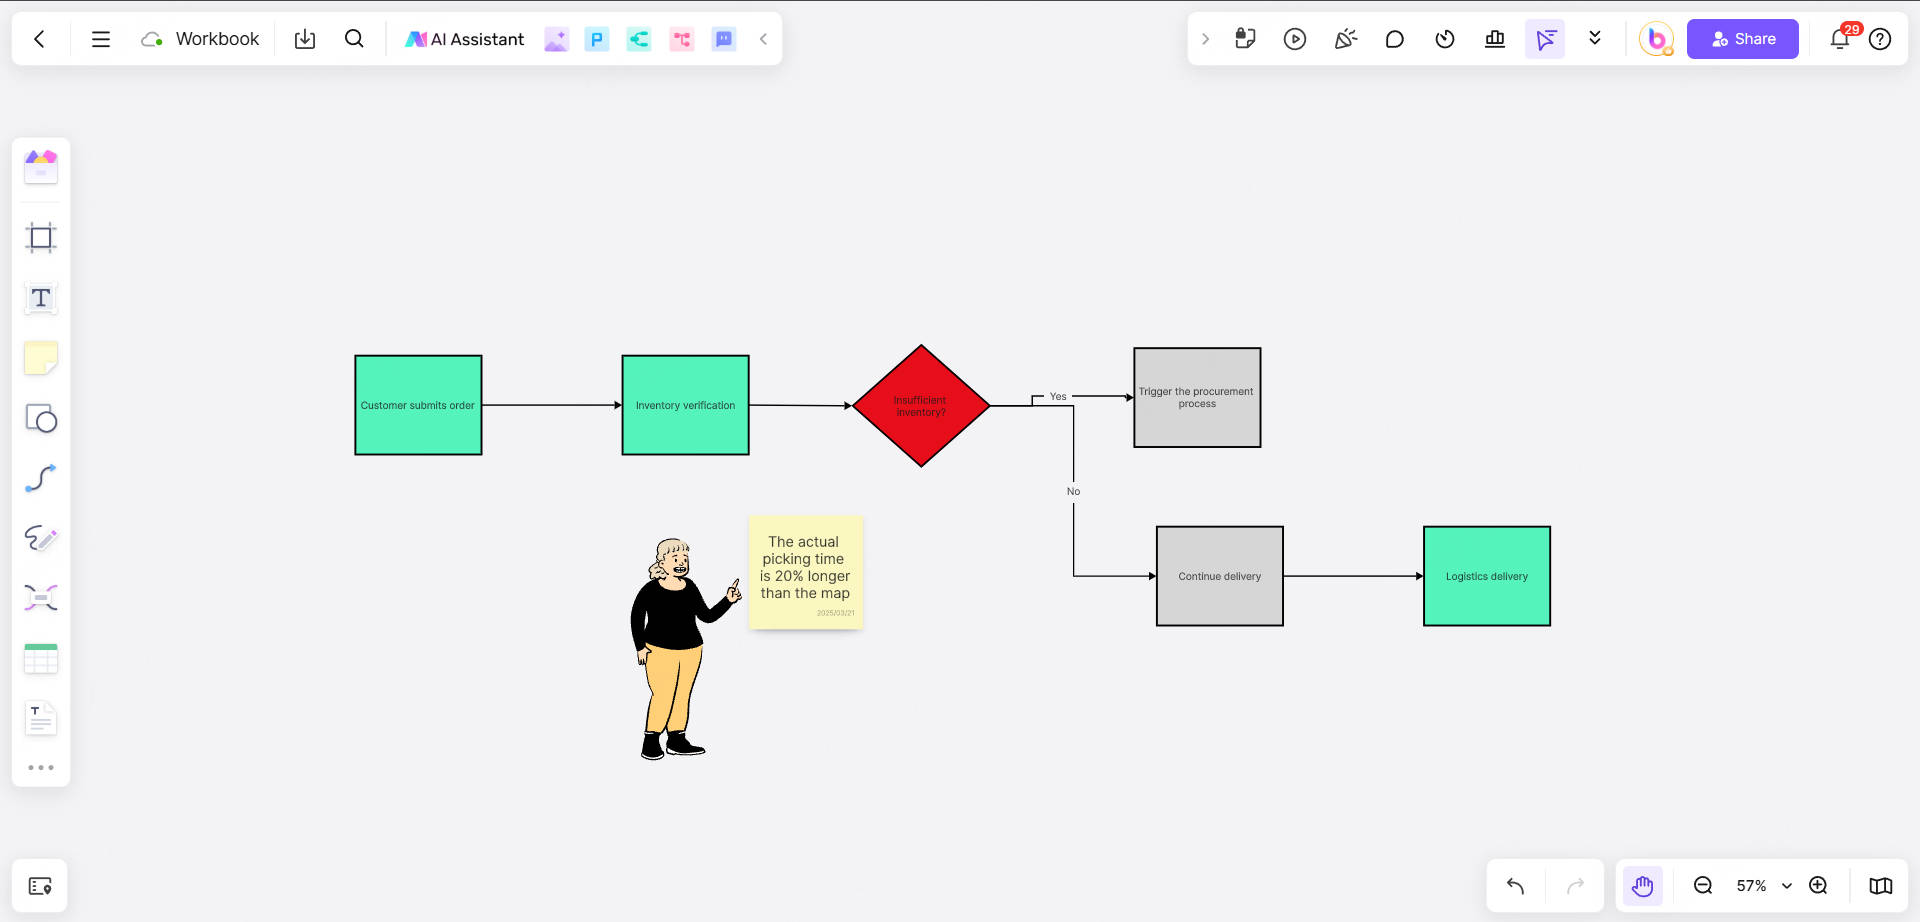
Mark the core steps with green boxes (such as "Customer submits order → Inventory verification → Logistics delivery");
Mark the decision points with red diamonds (such as "Insufficient inventory? Yes → Trigger the procurement process; No → Continue delivery").
If you want to draw a value stream map, you can:
Mark the time of each link (such as "Order review: 30 minutes" "Packaging: 15 minutes");
Mark waiting waste with a red lightning icon (such as "The average delay in logistics handover is 2 hours").
Step 4: Team verification and iteration of the flowchart
You can invite frontline employees to participate in the review (such as the warehouse manager pointed out that "the actual picking time is 20% longer than the map").
Step 5: Export or share your flowchart
Finally, you can export the flowchart as a PDF or link to embed it in an internal knowledge base or training materials.
Tips for using boardmix:
"/" brings up the graphics library, "Ctrl+Z" quickly undoes;
Right-click the node → "One-click copy style" to keep the map visually consistent.
Start simple: copy the template to complete the first draft, and then gradually deepen the details.
Boardmix provides free flowchart templates, users can quickly transform chaotic processes into clear action guides. Now, you can open Boardmix immediately, choose a free process template and optimize the process!


