

A clear social media marketing strategy can help brands build an effective bridge with consumers. However, many teams feel overwhelmed by the complexity of goal setting, platform selection, content curation and data analysis. Therefore, we need a social media flowchart for marketing strategy development that breaks down the complex strategy into clear steps to help teams collaborate efficiently and achieve their goals.
What is a social media flowchart for marketing strategy development?
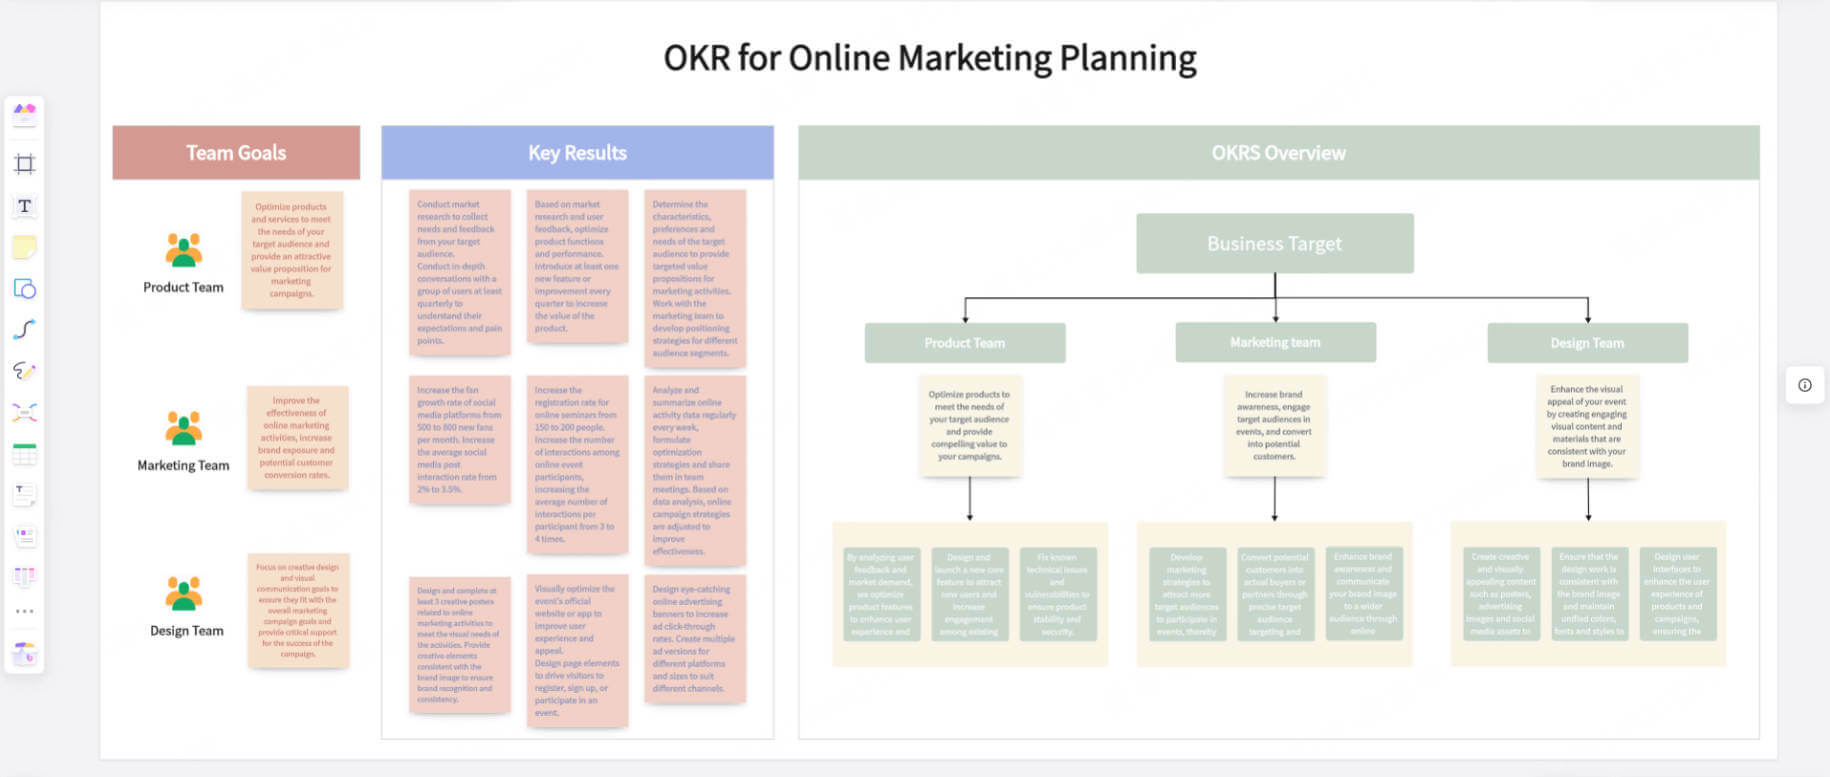
A social media flowchart for marketing strategy development is a visualization tool that shows the complete process from strategy development to execution and evaluation. It graphically presents the logical relationships and decision points of each step in a clear manner. Whether you're developing an annual marketing plan or a strategy for a specific campaign, a flowchart can help your team better understand the division of tasks, timelines, and key decisions.
For example, let's say you're the head of marketing for an e-commerce company, and you need to develop a social media marketing strategy for the upcoming Black Friday shopping season. With a flowchart, you can clearly show every step of the process, from goal setting (e.g., increasing brand exposure) to content publishing (e.g., designing promotional posters) to performance evaluation (e.g., analyzing click-through rates). This not only allows team members to see at a glance, but also avoids missing important aspects.
Next, we'll detail how to create a social media flowchart for marketing strategy development from scratch.
What should be included in a social media flowchart?
Creating a social media marketing strategy development flowchart is not complicated, but it requires clear logic as well as knowing the basic steps of a flowchart.
1.Main process of the social media flowchart
First, we need to identify the main process of the flowchart.
Social media marketing strategy development usually includes the following core steps:
Goal Setting: Define the marketing goals (e.g., increase brand awareness, increase sales, etc.).
Audience Analysis: Study the characteristics of the target audience (e.g. age, interest, behavioral habits, etc.).
Platform Selection: Select appropriate social media platforms based on audience characteristics (e.g. Instagram, TikTok, etc.).
Content planning: Develop the content theme, format and publishing frequency.
Execution and Publishing: Publish content according to the plan and interact with users.
Performance Evaluation: Analyze the data, evaluate the effectiveness of the strategy and optimize.
These steps form the backbone of the flowchart, and then we can add detailed branches for each step.
2.Branches of a social media flowchart
Depending on the goals of the social media marketing strategy, the branches of the flowchart may be different. And it can be adjusted accordingly. Below we have listed the social media marketing flowchart branches available for reference.
Step 1: Goal Setting
Branch 1: Determine marketing goals (e.g. increase brand awareness, increase website traffic, increase conversion rate, etc.).
Branch 2: Set quantifiable KPIs (e.g. “Increase Instagram followers by 20% in three months”).
Branch 3: Define a budget and timeframe.
Step 2: Audience Analysis
Branch 1: Collect audience data (e.g. age, gender, geographic location, interests, etc.).
Branch 2: Create a user profile (Persona) to help the team better understand the target audience.
Branch 3: Analyze the audience's behavioral habits on social media (e.g., active time, content preferences, etc.).
Step 3: Platform Selection
Branch 1: List all possible social media platforms (e.g. Facebook, Instagram, TikTok, etc.).
Branch 2: Filter appropriate platforms based on audience characteristics and marketing objectives.
Branch 3: Evaluate the resource investment (e.g. time, budget, labor) for each platform.
Step 4: Content Planning
Branch 1: Determine the content theme (e.g. product promotion, brand story, user-generated content, etc.).
Branch 2: Choose the content format (e.g., images, videos, live broadcasts, etc.).
Branch 3: Develop a content calendar, specifying the release time and frequency.
Step 5: Execution and Publishing
Branch 1: Assign tasks (e.g., designers are responsible for content production, operators are responsible for publishing).
Branch 2: Monitor the effect of publishing (e.g. real-time tracking of data such as likes, comments, shares, etc.).
Branch 3: Interact with users (e.g. reply to comments, start topic discussions, etc.).
Step 6: Performance Evaluation
Branch 1: Collect data (e.g. click rate, conversion rate, fan growth, etc.).
Branch 2: Analyze the data and evaluate whether the KPIs are reached.
Branch 3: Optimize the strategy (e.g. adjust the content form, change the platform, etc.) according to the evaluation results.
3.Flowchart symbols and parameter labeling
When drawing flowcharts, the use of standardized symbols and parameter labels can make the diagrams clearer and easier to understand. Learning the following are commonly used symbols and their meanings can help you create professional flowcharts.
Oval (start/end): Used to indicate the start and end of a process. For example, “Goal Setting” can be labeled as “Start” with an oval.
Rectangle (operation): Used to indicate a specific operation step. For example, “content planning” can be labeled with a rectangle.
Rhombus (conditional judgment): used to indicate the decision point. For example, “Is the KPI reached?” can be labeled with a diamond.
Arrow (process direction): used to connect the steps, indicating the order of the process.
Comment box (parameter labeling): Used to add additional explanatory information. For example, next to the “Platform Selection” step, you can add a comment: “Prioritize platforms with high user activity”.
By using these symbols and parameter annotations wisely, you can make the flowchart more intuitive and professional.
Create social media flowchart on Boardmix for free
If you are looking for an easy-to-use and powerful tool to create flowcharts, Boardmix is undoubtedly an excellent choice. As an online whiteboard collaboration platform, Boardmix not only supports real-time collaboration among multiple people, but also provides rich flowcharting features that allow you to create professional-grade social media marketing strategy flowcharts easily.
Steps to create social media flowchart for marketing strategy
Next, we will introduce in detail how to make a social media marketing strategy flowchart using Boardmix to help you visualize your social media strategy quickly.
Step 1. Register for a Boardmix Account and Create a Whiteboard
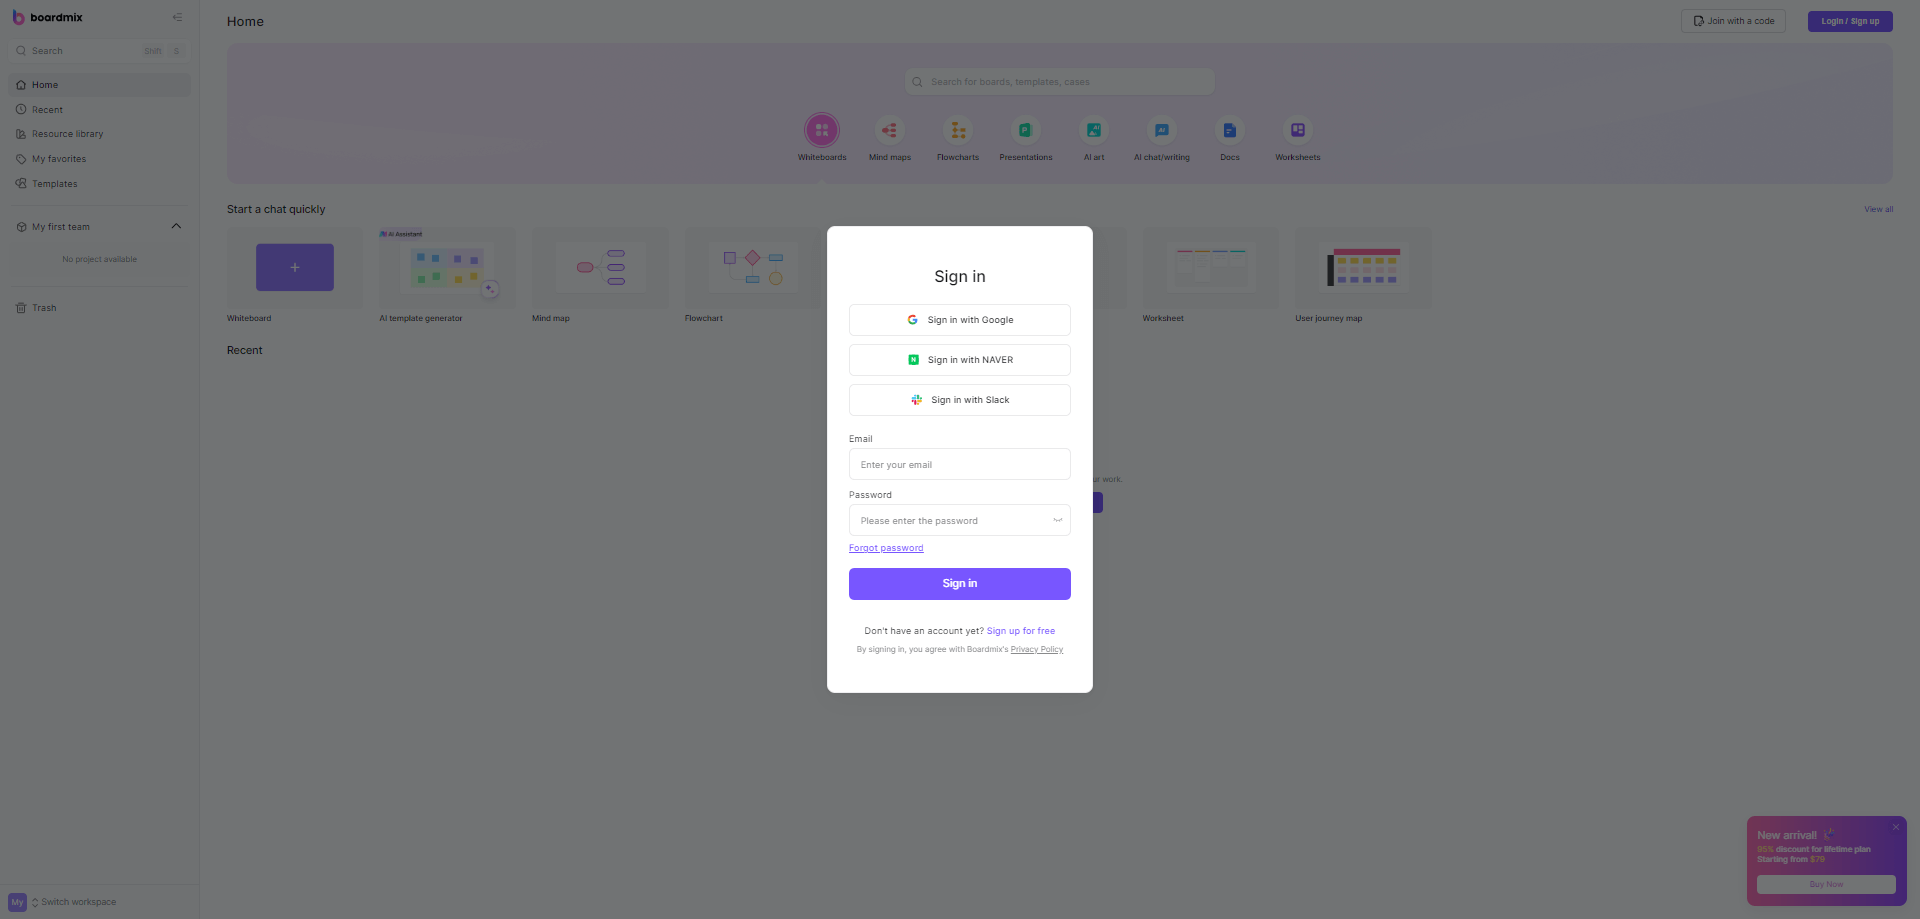
Visit the Boardmix website and register an account. After logging in, click “New Whiteboard” and select the “Flowchart” template, or start with a blank canvas.
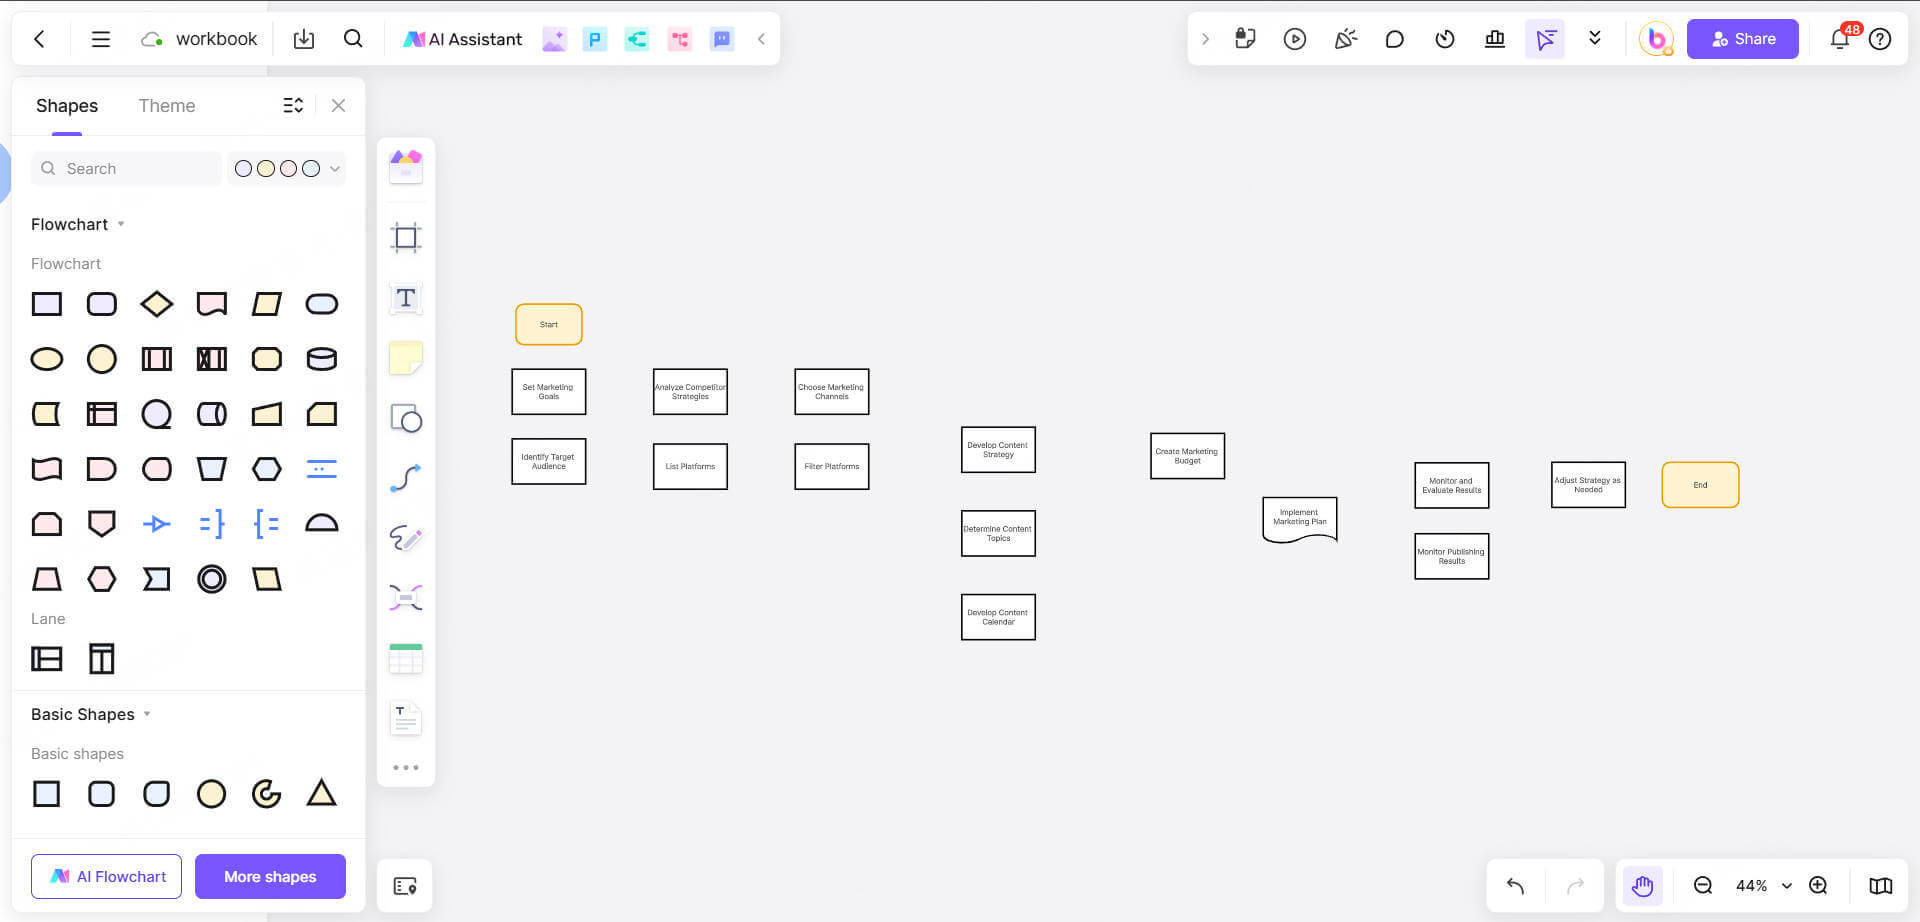
Step 2. Add Flowchart Symbols
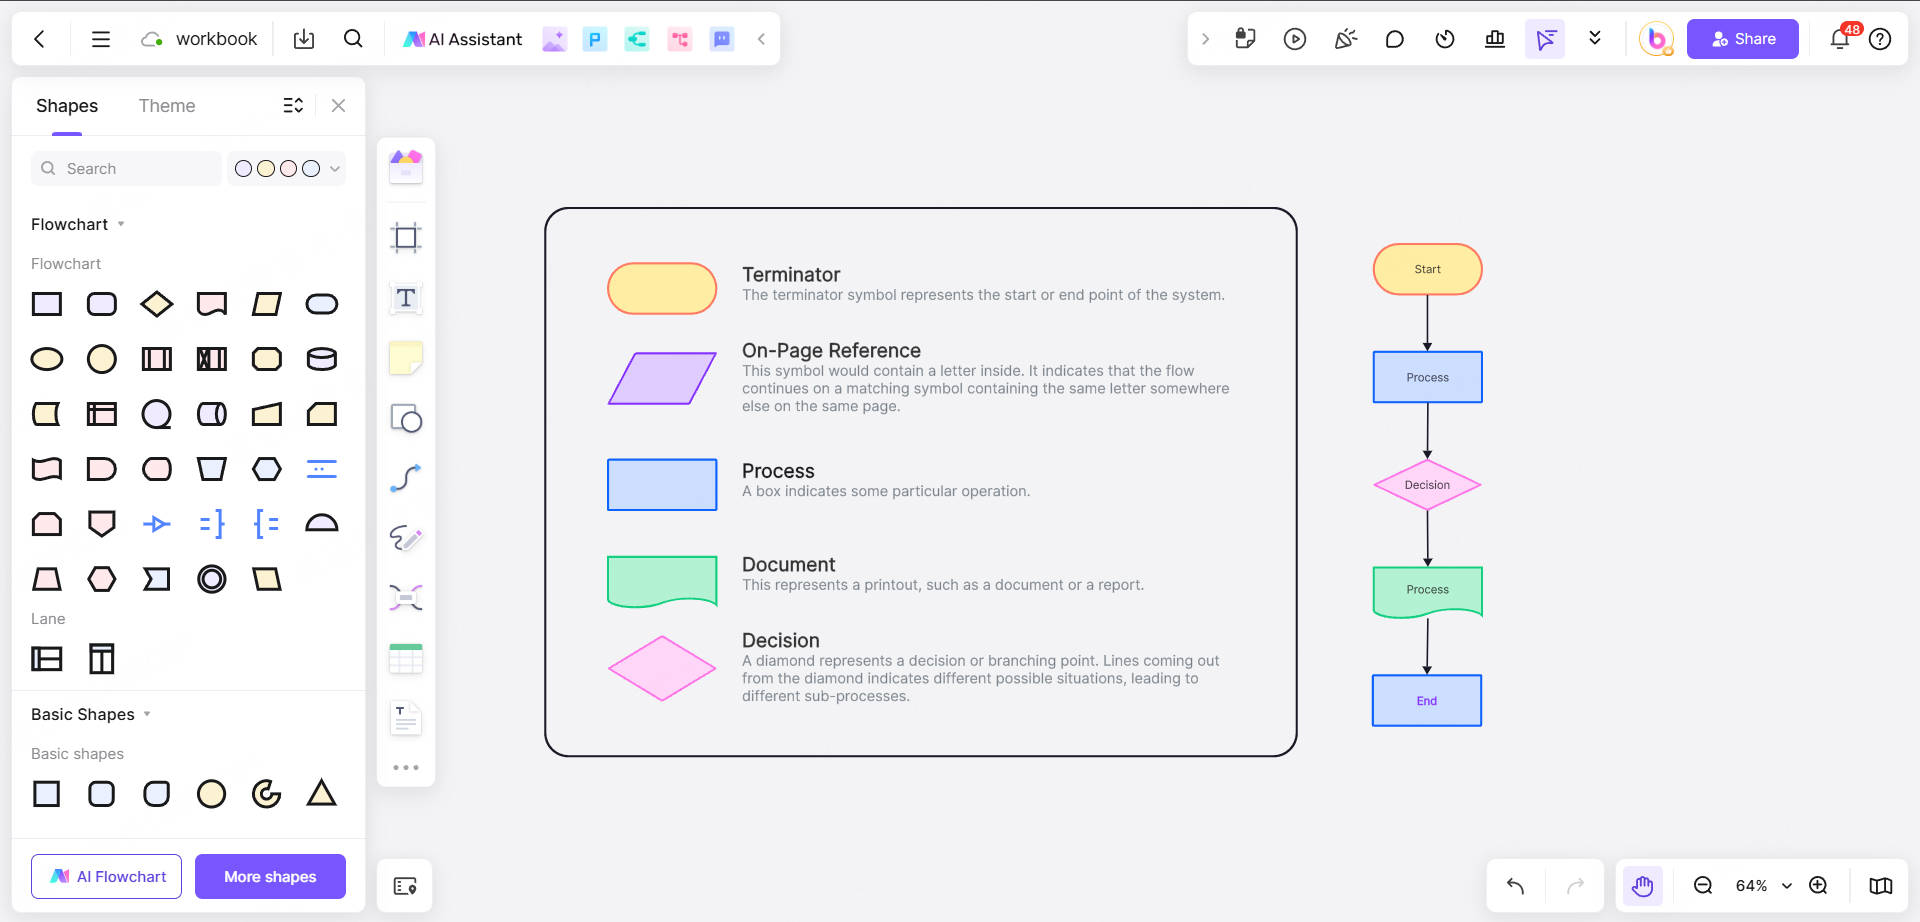
Boardmix provides a rich library of flowchart symbols, including ellipse (start/end), rectangle (operation), diamond (conditional judgment) and so on.
Drag and drop symbols from the left toolbar onto the canvas to start building the flowchart backbone.
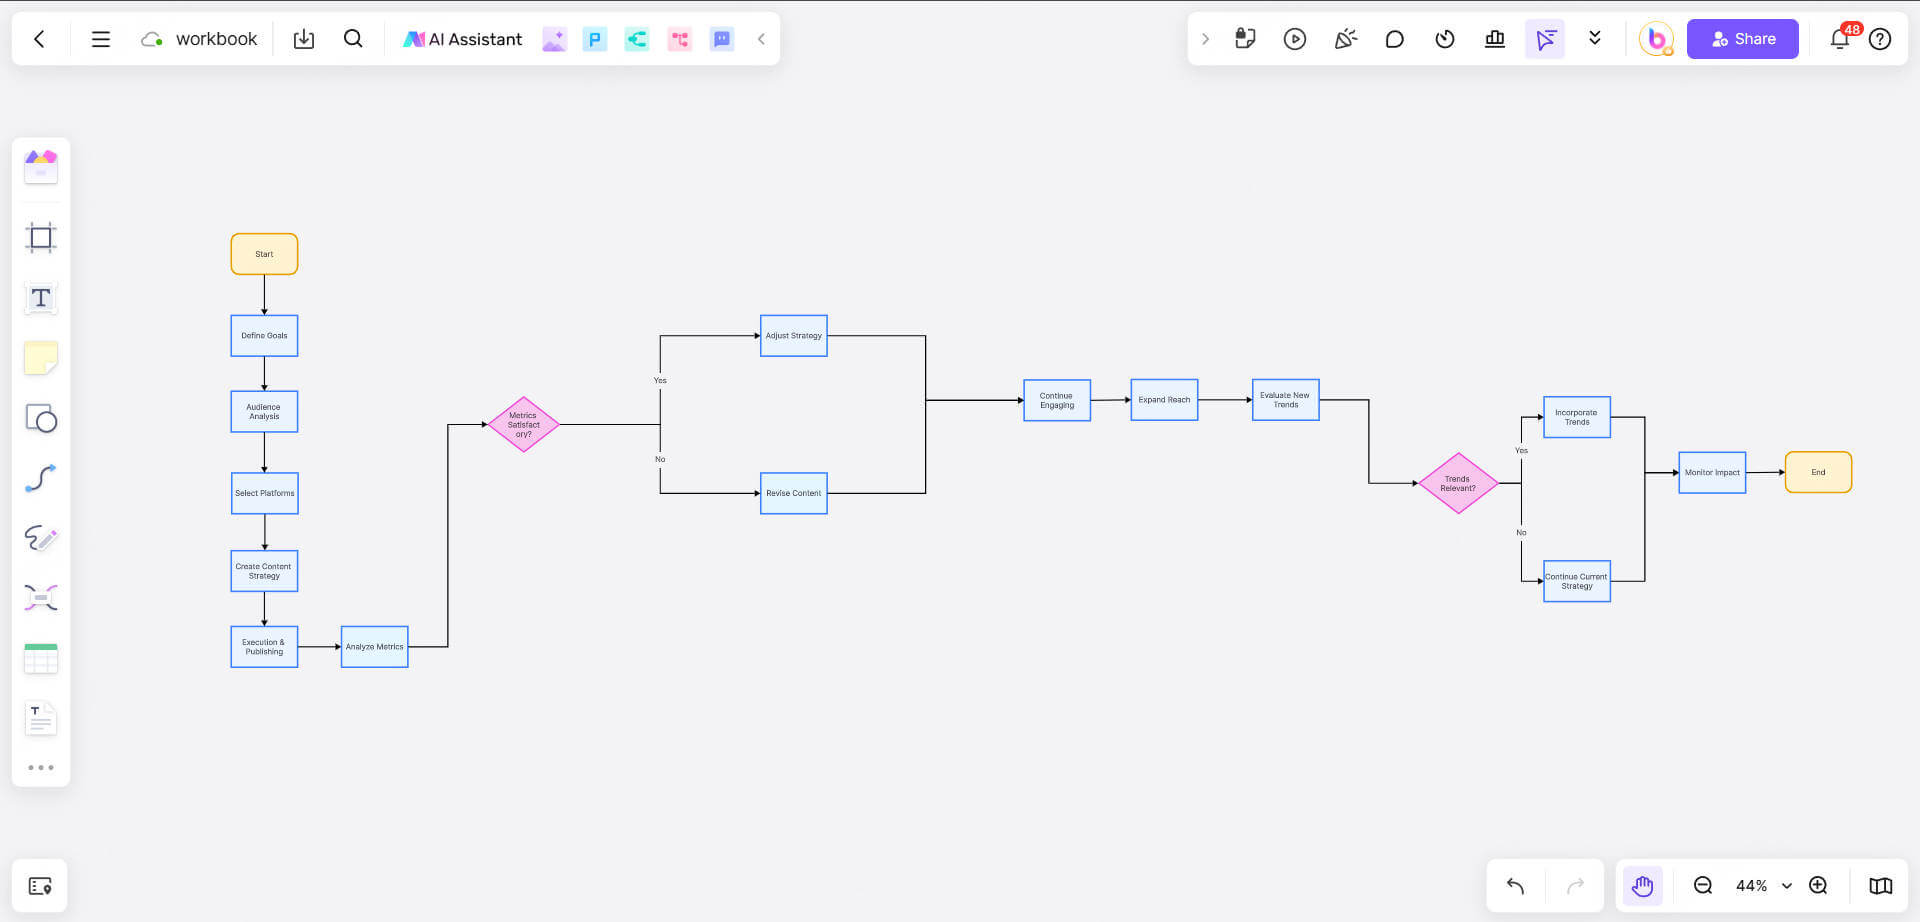
Step 3. Drawing the Main Process
Process 1: Goal Setting
Use the ellipse to label the “Start” and add a rectangular box and type “Goal Setting”.
Below the rectangle, add branches, e.g. “Define marketing objectives” and “Set KPIs”.
Process 2: Audience Analysis
Use the rectangular box labeled “Audience Analytics” and add branches such as “Collect Audience Data” and “Create User Profiles”.
Process 3: Platform Selection
Use the diamond to label “Platform Selection” and add branches, such as “List Platforms” and “Filter Platforms”.
Process 4: Content Planning
Use the rectangular box to label “Content Curation” and add branches, such as “Determine Content Topics” and “Develop Content Calendar”.
Process 5: Execution and Publishing
Use the rectangular box to label “Execution and Publishing” and add branches, such as “Assign Tasks” and “Monitor Publishing Results”.
Process 6: Performance Evaluation
Use the ellipse to label “End” and add branches, such as “Collect Data” and “Optimize Strategy”.
Step 4. Connecting Symbols and Adding Arrows
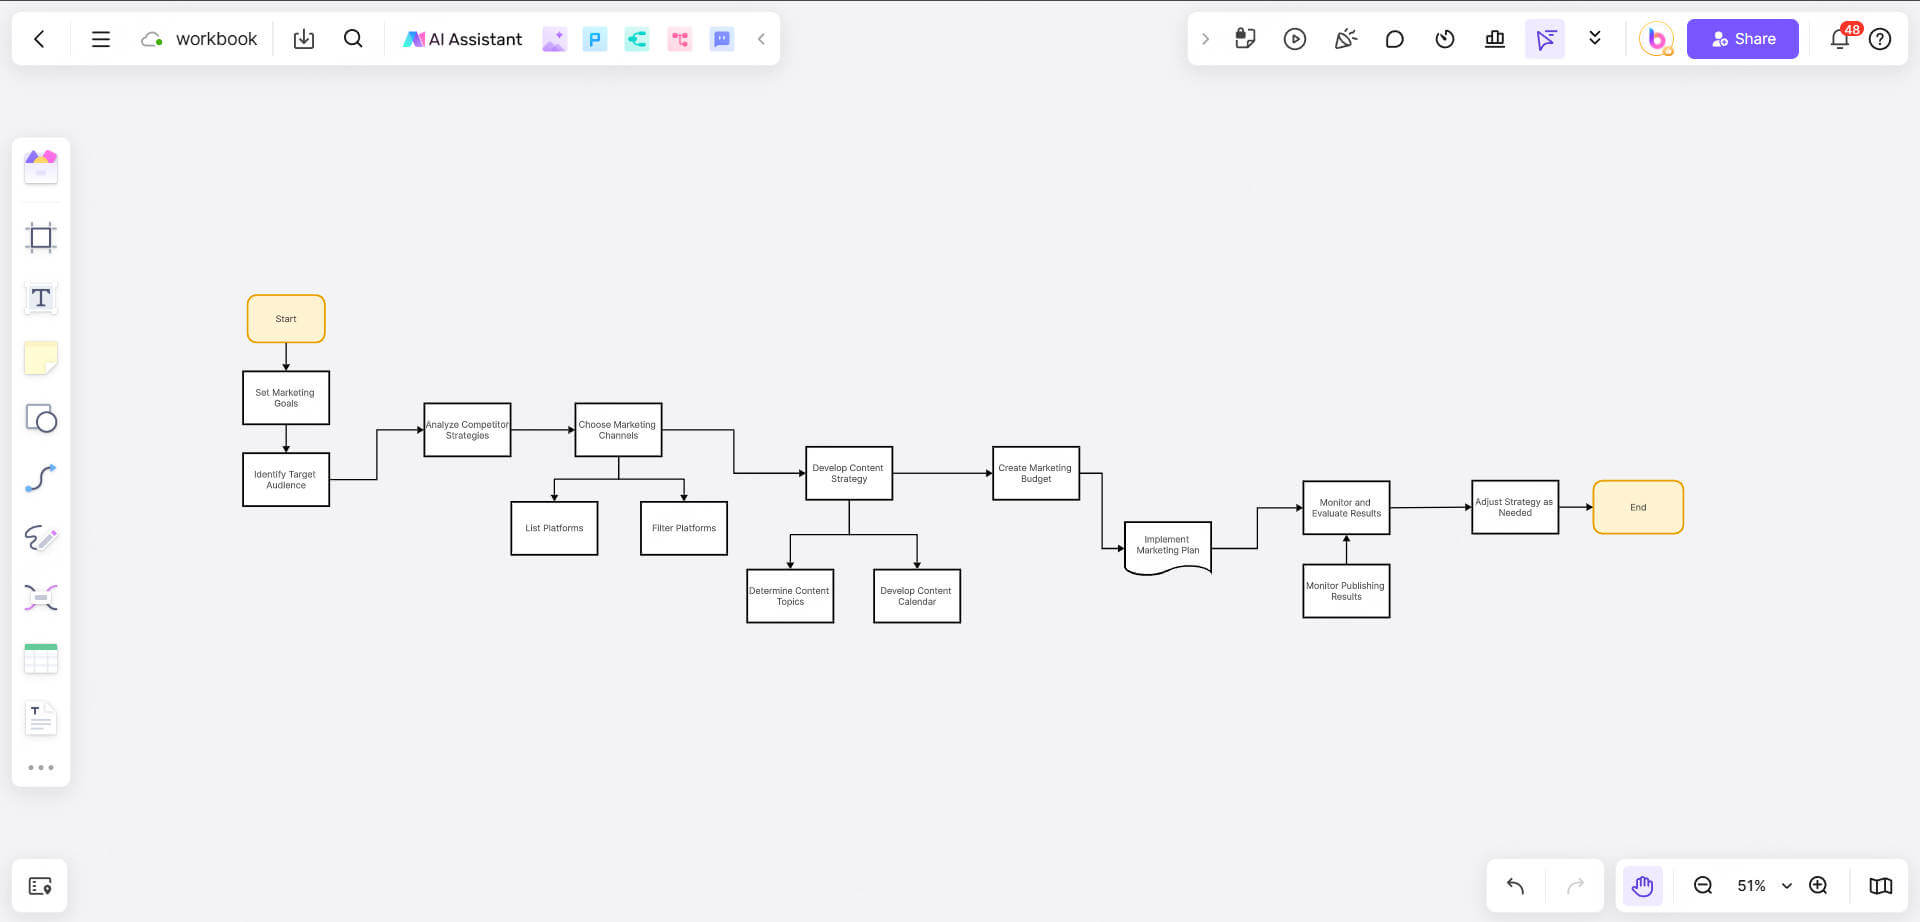
Use the arrow tool to connect the symbols to ensure a clear logical sequence of the process.
For example, drag an arrow from the Goal Setting rectangle to the Audience Analysis rectangle to indicate the order of the process.
Step 5. Add Comments and Parameter Labeling
Use the comment box tool to add detailed descriptions for each step.
For example, add a comment next to the “Platform Selection” diamond box: “Prioritize platforms with high user activity”.
Step 6. Landscaping and Adjustments
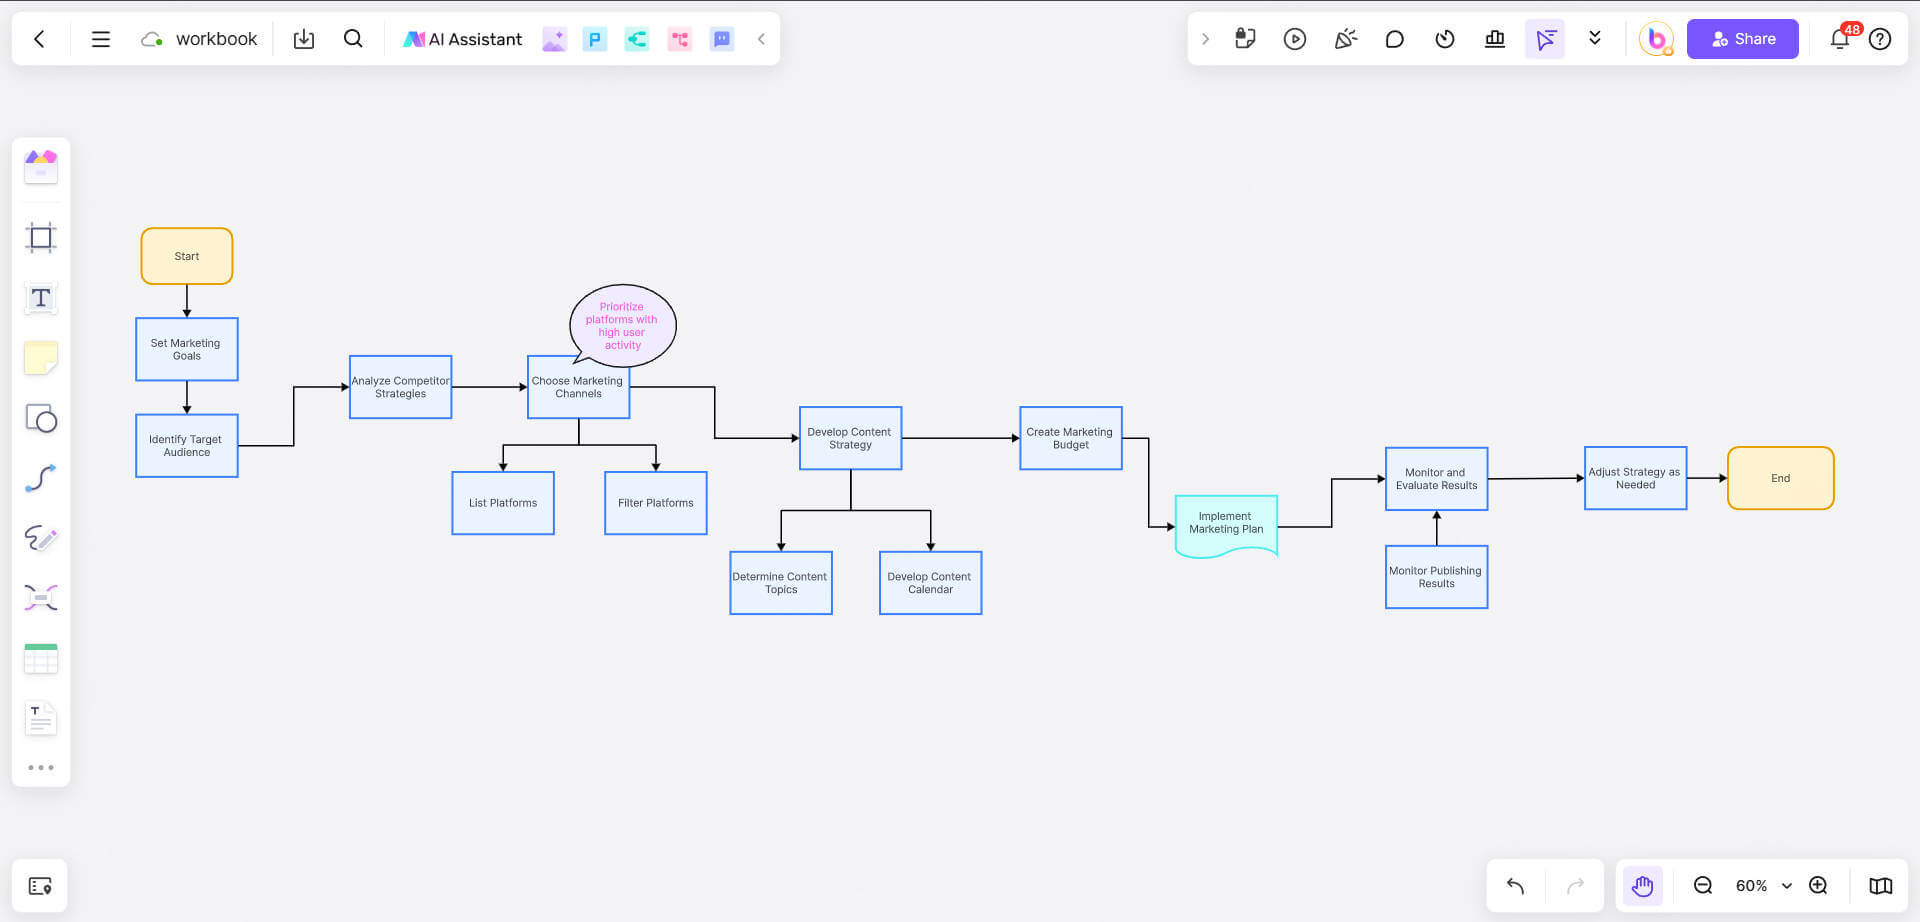
Use Boardmix's Styles tool to adjust the colors, fonts, and borders of the symbols to make the flowchart more aesthetically pleasing.
For example, make the “Goal Setting” rectangle blue to emphasize its importance.
Step 7. Collaborate and Share
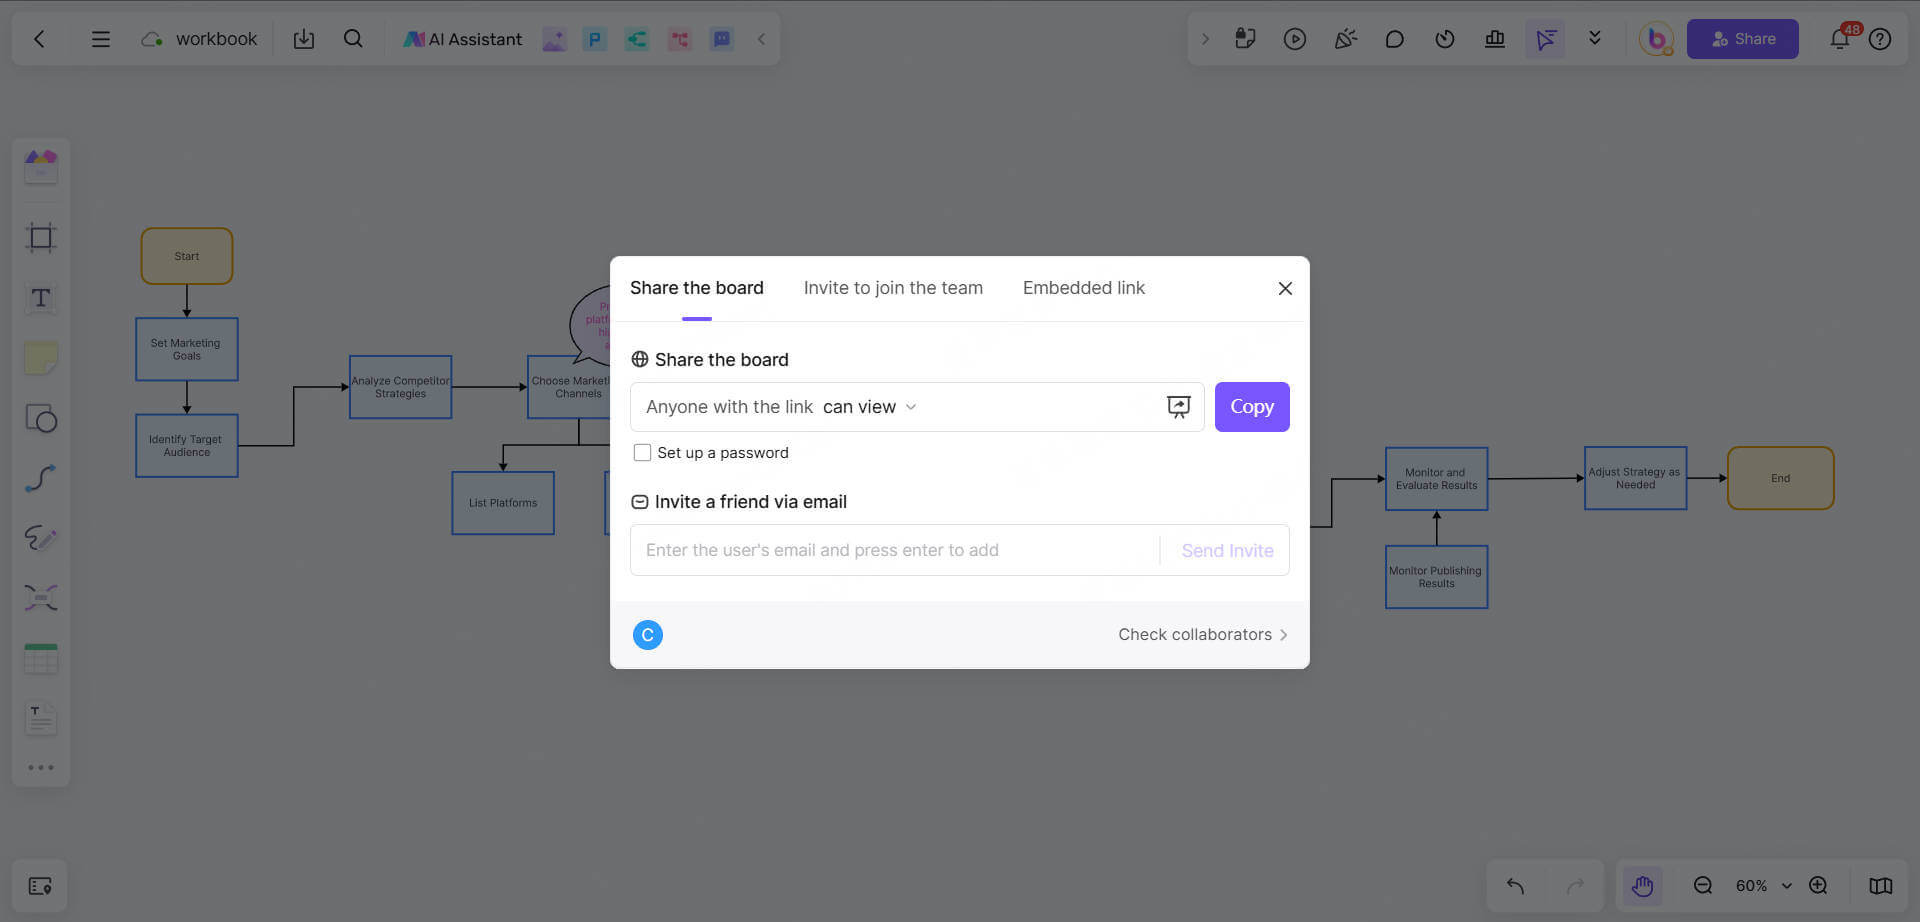
Invite team members to join the whiteboard and collaborate on the flowchart in real time.
Use the comments feature to add feedback or suggestions on specific steps.
When you're done, click the “Share” button to generate a link or export to PDF, PNG, or other formats.
Features of Boardmix for creating flowchart
Learn to use the basic functions of Boardmix flowchart to improve the efficiency of flowchart creation.
1. Drag-and-drop simplicity
Boardmix's drag-and-drop operation makes flowcharting very easy. Simply drag and drop symbols from the symbol library onto the canvas to quickly build a flowchart.
2. Real-time Seamless Collaboration
Boardmix supports editing and commenting by multiple people at the same time. Team members can view and modify the flowchart in real time to improve collaboration efficiency.
3. Free flowchart template library
Boardmix has a variety of built-in flowchart templates, including marketing strategy flowchart, project management flowchart, etc., to help you quickly start the project.
4. Multi-platform and cross-end use
Whether you are using a computer, tablet or cell phone, you can access and edit flowcharts anytime, anywhere.
5. Powerful Integration
Boardmix supports seamless integration with Google Meetings, ZOOM and other tools to help you manage and share flowcharts.
6.AI Generated Drawing Capability
Boardmix whiteboard is configured with rich AI features, including AI-generated flowcharts, AI-generated mind maps, AI-generated business canvases, and many other drawing types, and you can also optimize and convert the format of the text.
Conclusion
With these steps, you can easily use Boardmix to create a clear and professional social media marketing strategy flowchart. Whether you are planning individually or collaborating as a team, Boardmix can provide you with powerful support. Now, visit the Boardmix website, register an account and start your process mapping journey! Let Boardmix be your right hand in developing your social media marketing strategy and help your brand stand out in the digital age.


