

The T chart is a versatile and straightforward tool used for organizing information, comparing and contrasting ideas, and making decisions. Its simplicity and effectiveness have made it popular across various fields, from education to business. In this comprehensive guide, we will explore the fundamentals of T charts, walk you through the steps to create them in Word and online, and introduce you to various templates that can enhance your productivity.
What is a T Chart?
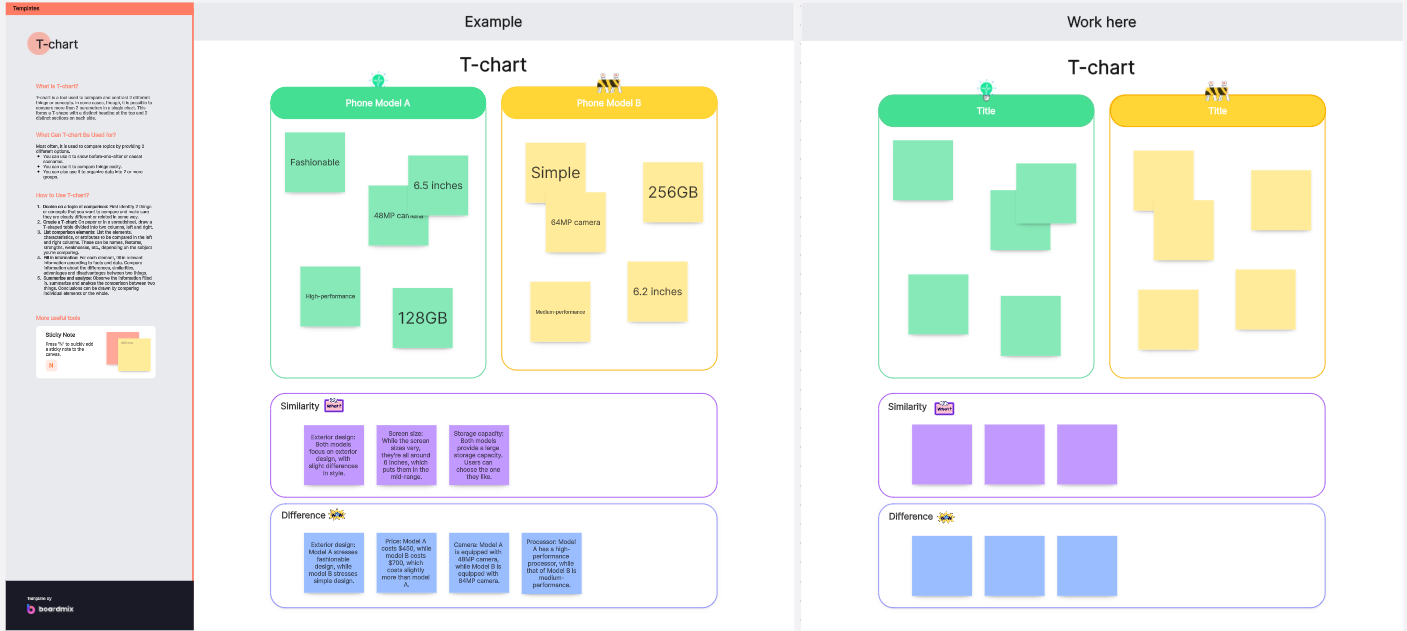
A T chart is a two-column table designed to facilitate comparison and contrast between two elements. The name "T chart" comes from the chart's layout, which resembles the letter "T" with a vertical line dividing the page into two halves and a horizontal line at the top for headings.
Key Components of a T Chart🎈🎈:
Title: The title at the top of the chart explains the overall subject of the comparison.
Headers: Each column has a header to identify the categories being compared.
Columns: The two columns contain the items or ideas being contrasted.
T charts are commonly used in various scenarios, such as comparing pros and cons, listing advantages and disadvantages, organizing facts and opinions, and sorting characteristics.
How to do a T Chart in Word?
Creating a T chart in Microsoft Word is a traditional method that many people use due to the widespread availability of the software. Here are the steps to create a T chart in Word:
1. Open a New Document
Open Microsoft Word and create a new blank document.
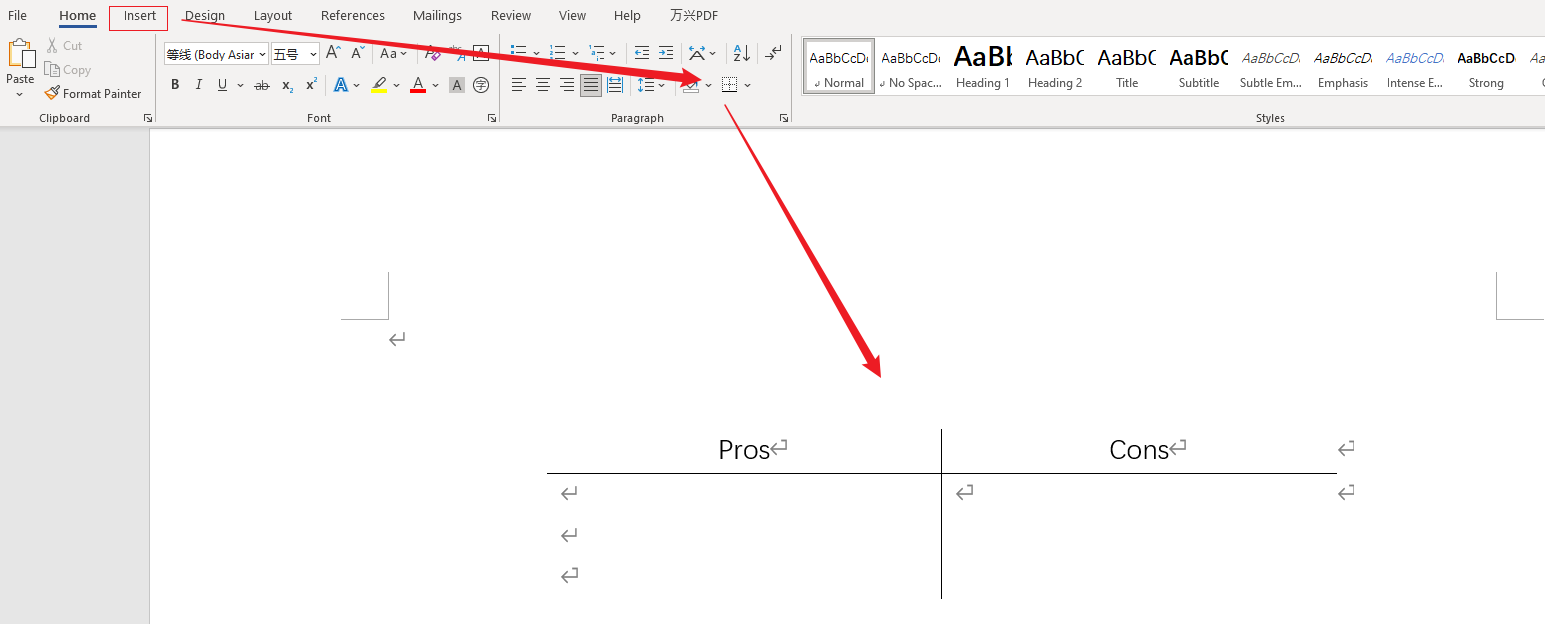
2. Insert a Table
Go to the "Insert" tab and click on "Table.", and select a 2x2 table from the dropdown menu.
3. Adjust the Table Size
Drag the borders of the table to adjust its size as needed.
4. Add Headers
Click in the top-left cell and type the first header (e.g., "Pros"), and click in the top-right cell and type the second header (e.g., "Cons").
5. Enter Data
Click in the cells below each header to enter the items or ideas you want to compare.
6. Format the Table
Use the formatting tools in Word to create T chart, such as adjusting the font size, adding borders, or changing the cell colors.
While creating a T chart in Word is straightforward, it can be time-consuming, especially when you need to frequently update or modify the chart.
How to Create a T Chart Online?
Creating a T chart online offers numerous advantages over traditional methods. Online tools provide greater flexibility, ease of collaboration, and a variety of templates to choose from. Here we will discuss the benefits of online T chart creation and introduce five free tools that can help you create T charts effortlessly.
Benefits of Creating T Charts Online:
Ease of Access: Online tools can be accessed from any device with an internet connection.
Collaboration: Many online tools allow multiple users to collaborate in real time. Workers can discuss relevant content together and complete the T chart.
Templates: A wide range of pre-designed templates can save time and effort. Such as, in Boardmix, users can find multiple templates to manage the work plan.
Customization: Online tools offer extensive customization options to create visually appealing charts.
Free T Chart Maker
1. Boardmix
Boardmix is a versatile online whiteboard tool that allows users to create T charts quickly and easily. It offers a range of templates and collaboration features, making it ideal for team projects. Users can customize their T charts with different colors, fonts, shapes, and other design elements.
2. Canva

Canva is a popular graphic design tool that includes a variety of T-chart templates. Canva offers a wide range of T-chart templates that can be customized to fit any purpose. Its drag-and-drop interface makes it easy to customize charts with different fonts, colors, and images.
3. Lucidchart
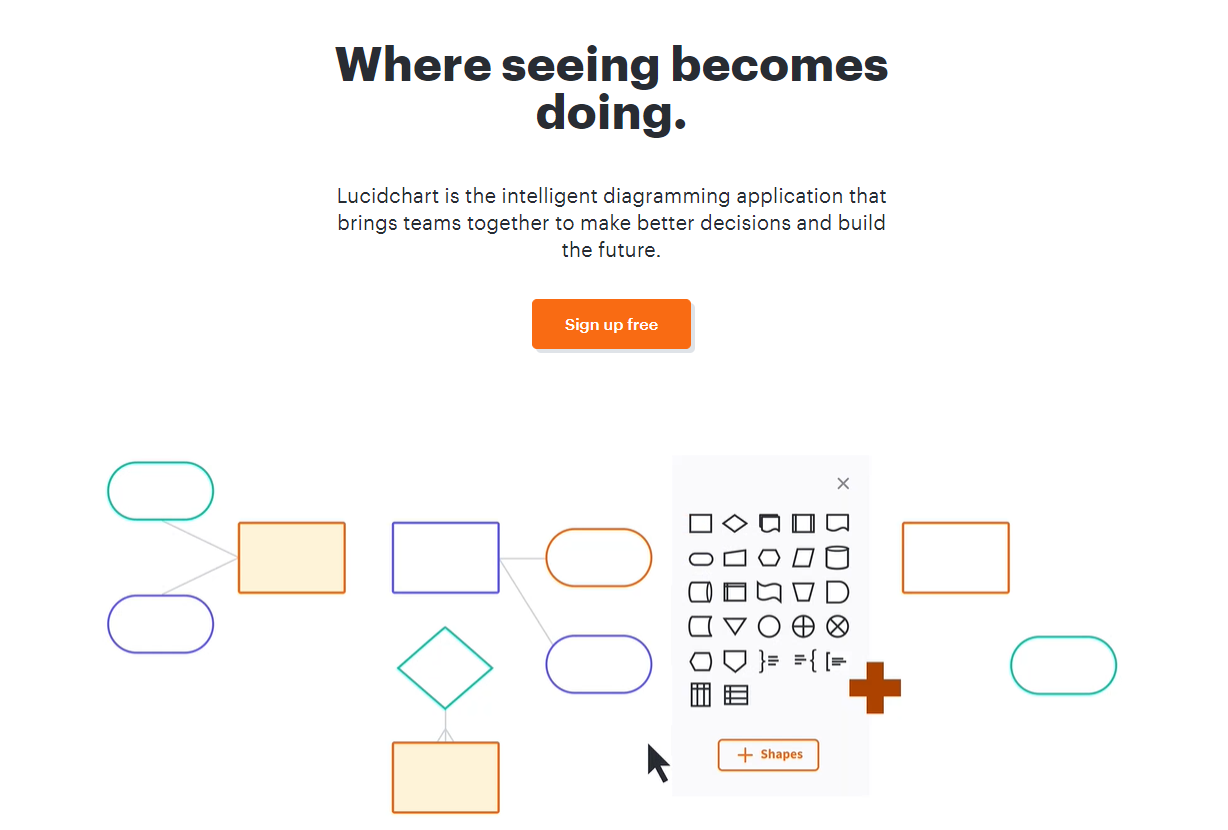
Lucidchart is an online diagramming tool that supports to creation T charts and provides advanced features for creating detailed and professional charts. It is widely used in business and education for its robust diagramming capabilities. It provides numerous templates and advanced features for creating detailed and professional-looking charts.
4. Creately
Creately is another powerful diagramming tool that offers T chart templates. It supports real-time collaboration and integrates with other productivity tools like Google Drive and Slack. It is known for its ease of use and integration capabilities.
5. Google Drawings
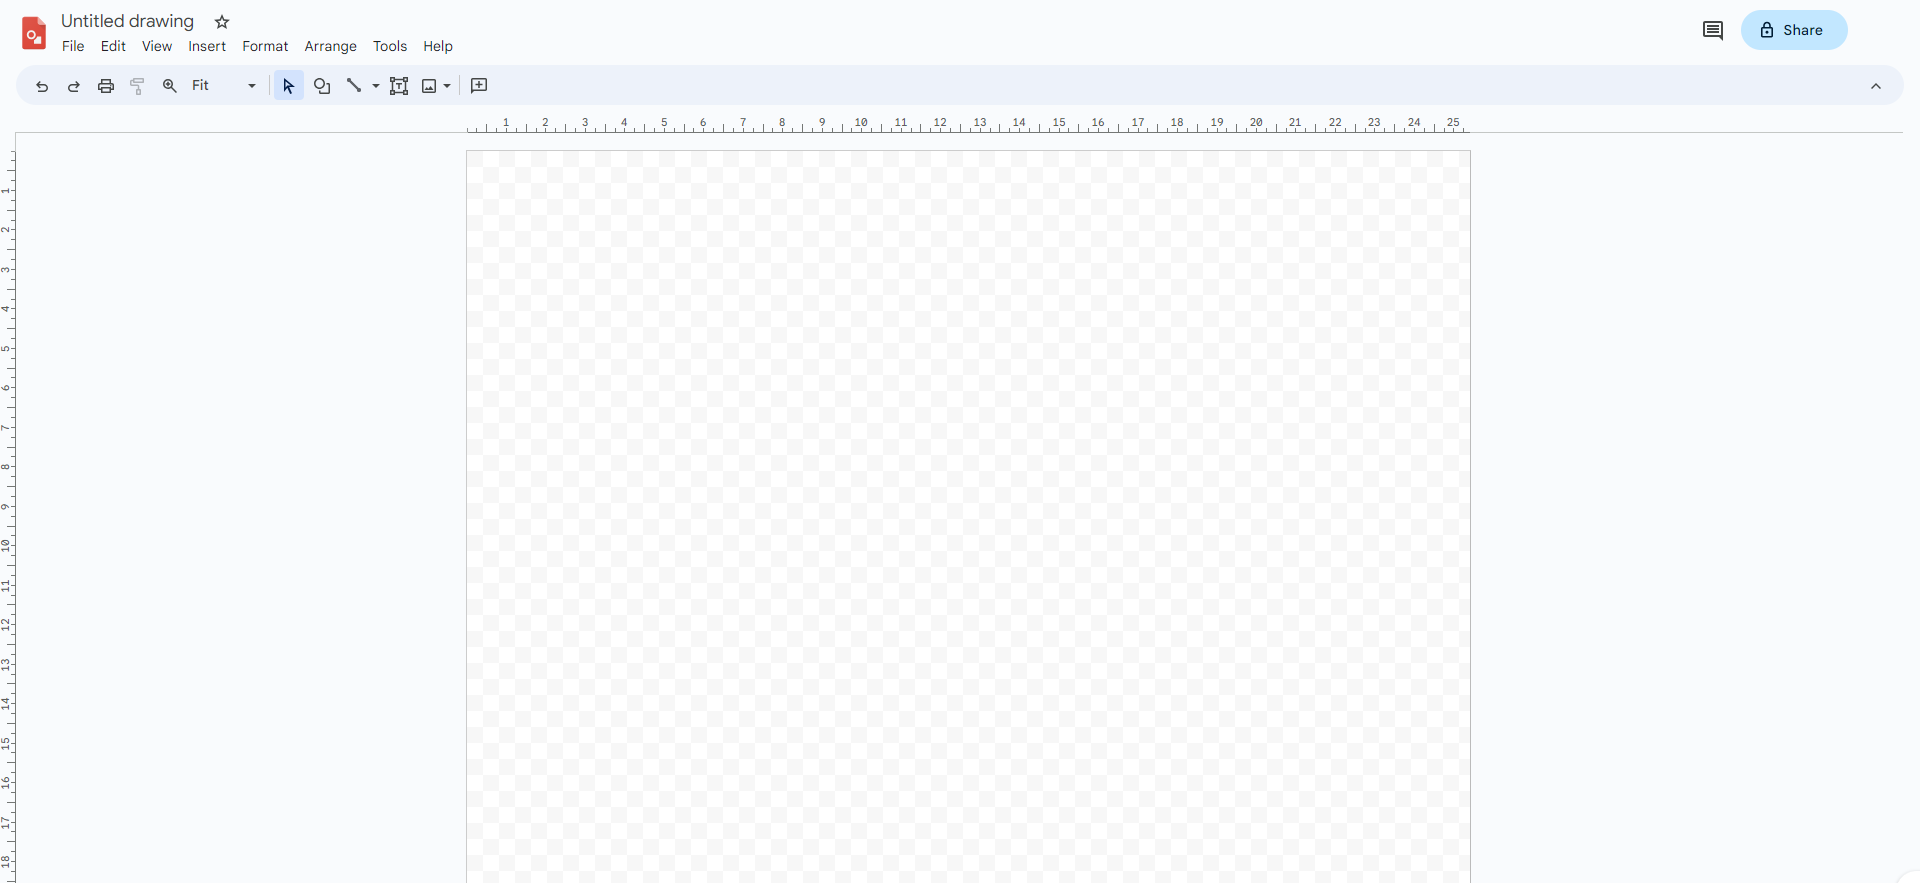
Google Drawings is a free tool within the Google Workspace suite that allows users to create a variety of diagrams and charts, including T charts. It is accessible and straightforward, making it a good choice for quick and simple chart creation.
Step to Create T Chart in Boardmix
Boardmix stands out as an excellent choice for creating T charts online due to its user-friendly interface and extensive features. Here are the detailed steps to create a T chart in Boardmix:
1. Create a New Board
Visit the Boardmix website sign up for a free account log in if you already have one, and click on "Create New Board" to start a blank canvas.
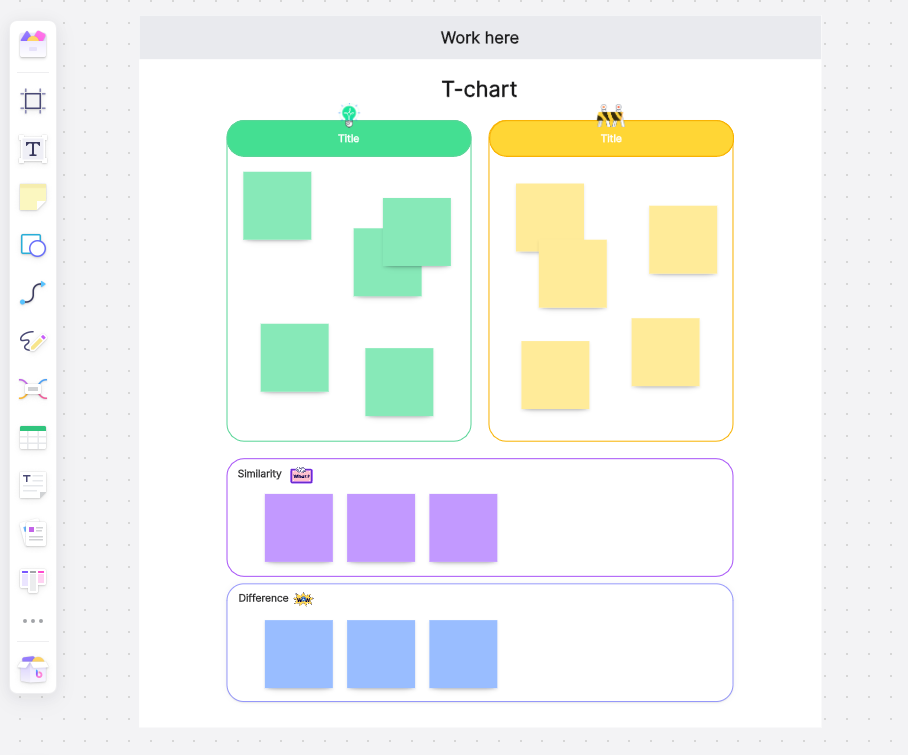
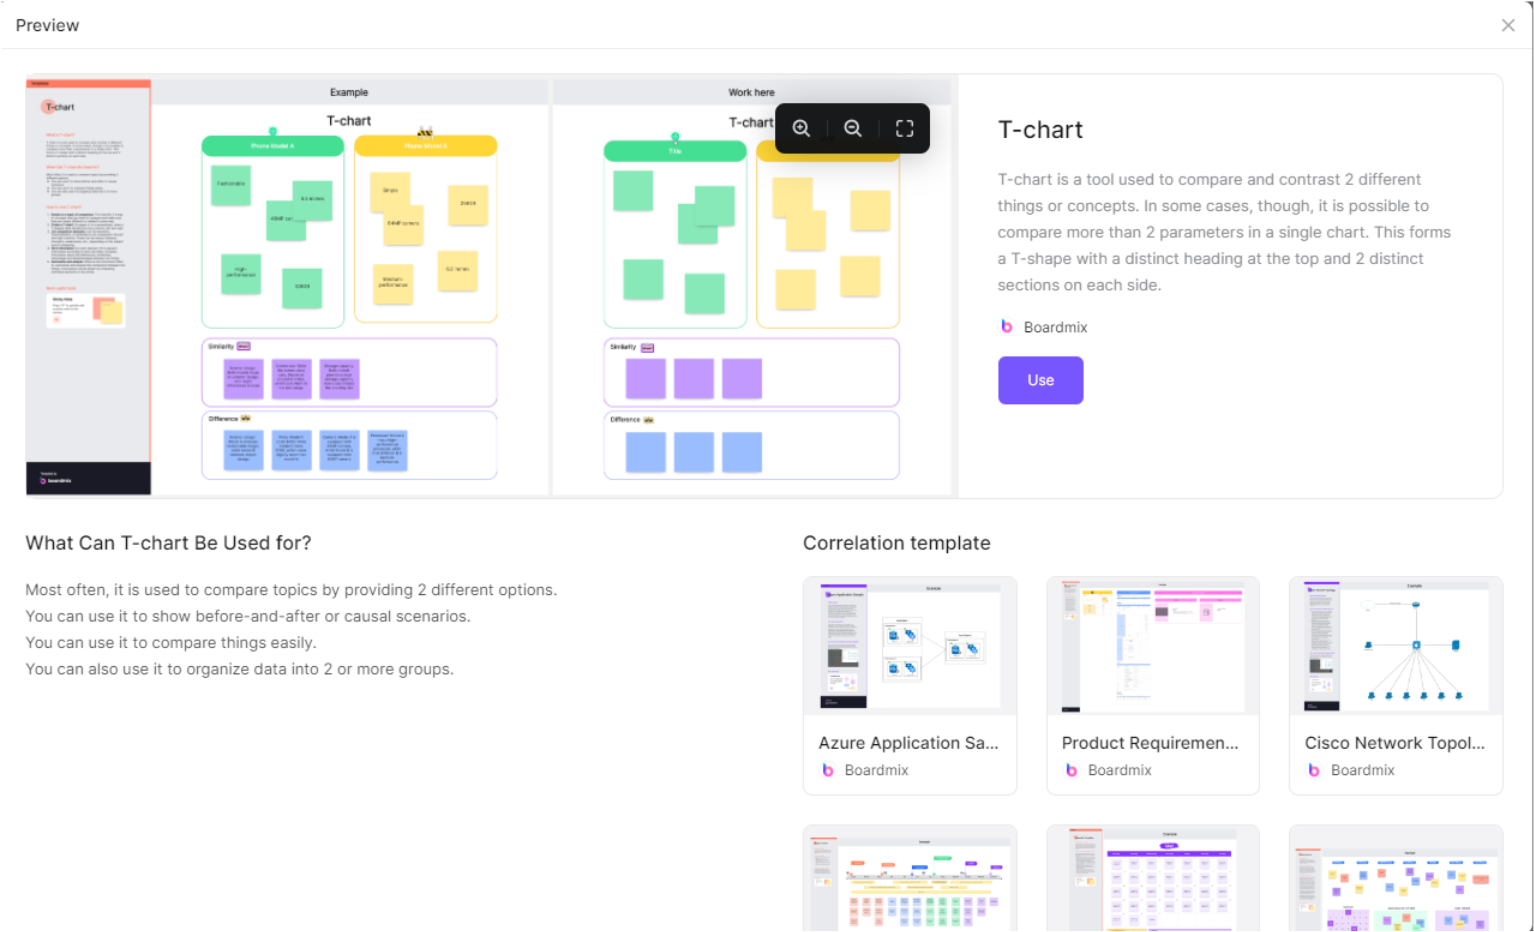
2. Select a T Chart Template
Browse the template library and select a T chart template. You can also start with a blank board and create your T chart from scratch.
3. Add Headers
Double-click on the header sections to enter the titles for your columns. Use the formatting toolbar to adjust the font size, style, and color of your headers to make them stand out.
4. Enter Data
Click on the cells below each header to add the items or ideas you want to compare. You can add as many rows as needed to list all the items for each category and rearrange the items by dragging and dropping them within the columns if necessary.
5. Customize the Chart
Use the toolbar to customize your T chart. You can change colors, and fonts, add shapes, and more to make your chart visually appealing. Use the “Insert” menu to add these elements and position them as required. When you finish the T chart, you should save your T chart and share it with others by generating a shareable link or inviting collaborators directly.
Application of T Chart Templates
T chart templates can be used in various scenarios to organize information and make informed decisions. Here are four examples of T chart templates and their applications:
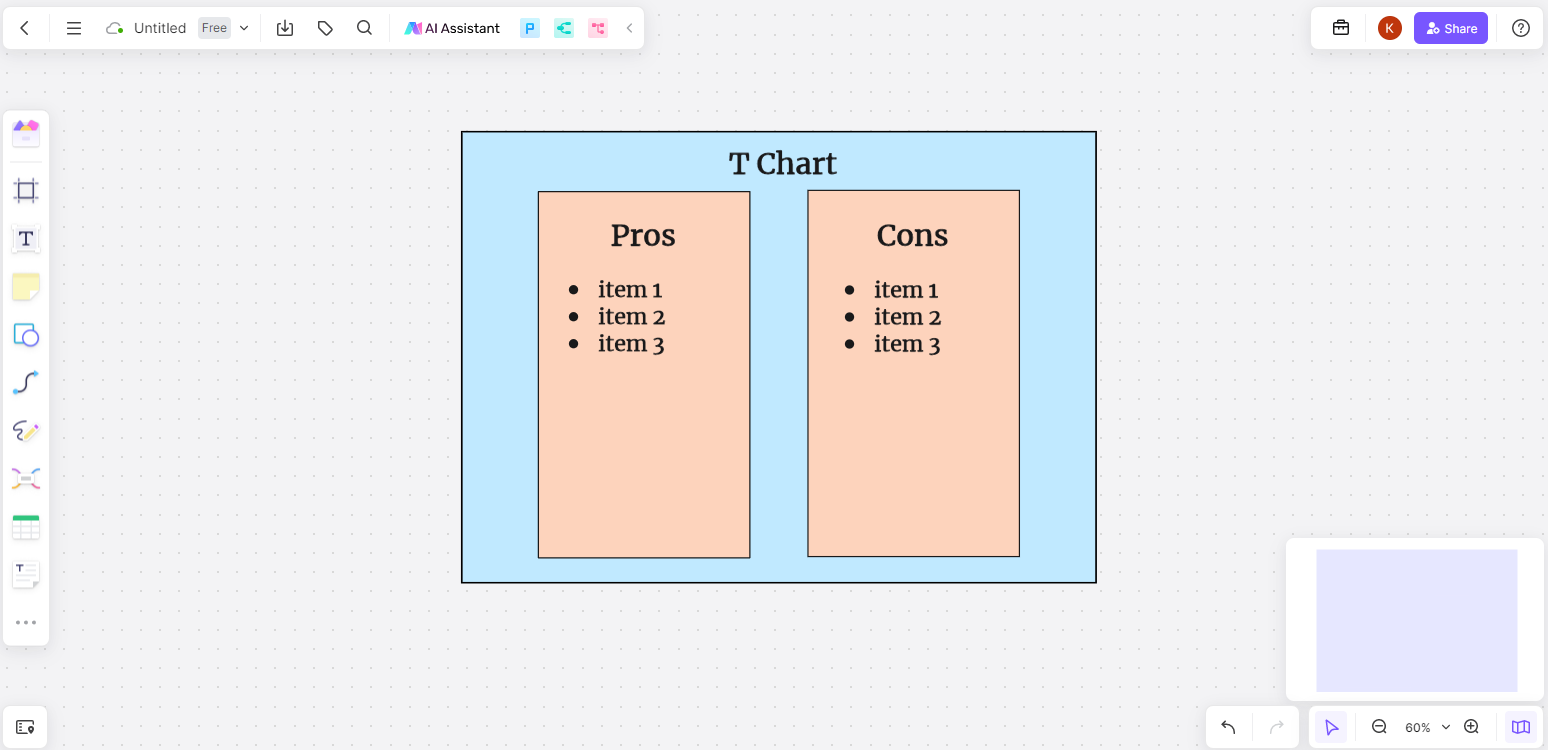
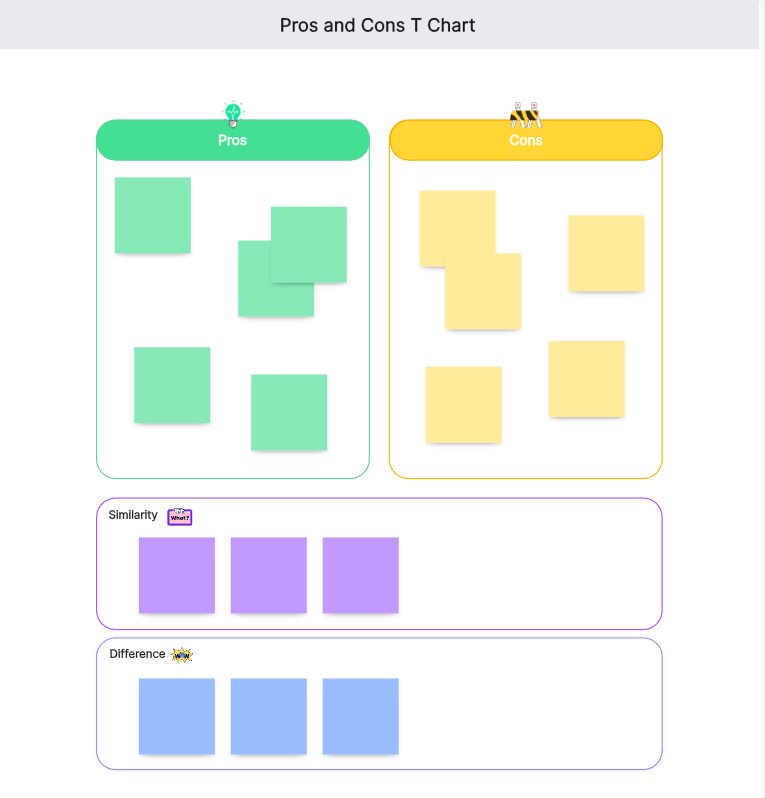
1. Pros and Cons T Chart
The Pros and Cons T chart is designed to help users make well-informed decisions by listing the advantages and disadvantages of a particular option. It provides a clear visual representation of the positive and negative aspects, making it easier to weigh options objectively.
Applications:
Personal Decisions: Useful for evaluating major life choices such as buying a house, changing careers, or moving to a new city. It helps individuals see all factors clearly before making a decision.
Business Choices: Businesses can use this template to compare potential investments, strategic decisions, or partnerships. It aids in assessing risks and benefits.
Project Planning: Project managers can list the potential benefits and drawbacks of different project approaches, helping to choose the most effective strategy.
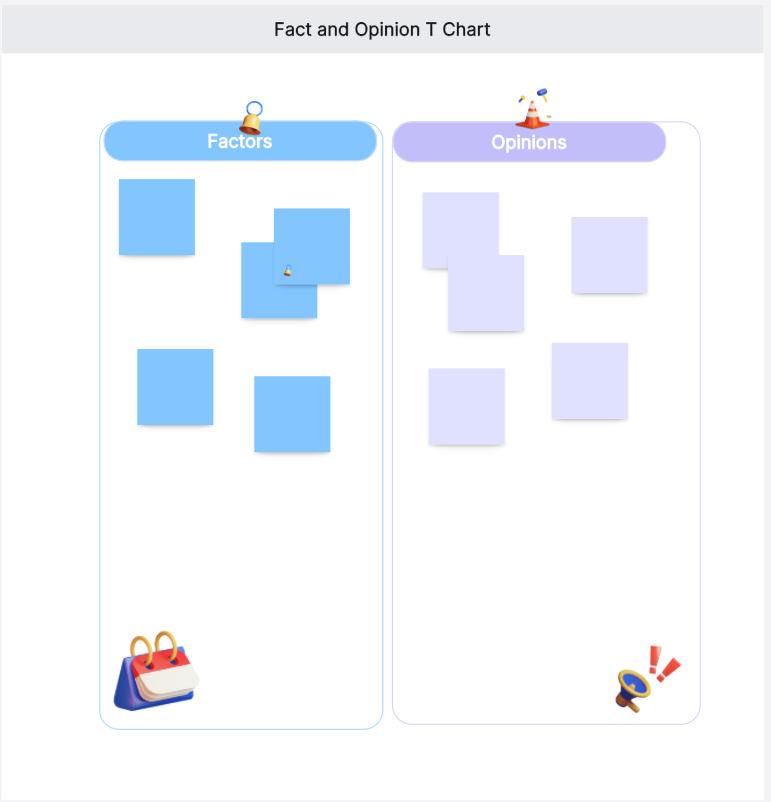
2. Fact and Opinion T Chart
The Fact and Opinion T chart is commonly used in educational settings to help students differentiate between factual statements and opinions. It enhances critical thinking and analytical skills by encouraging students to classify information correctly.
Applications:
Educational Settings: Teachers can use this template to teach students how to distinguish between facts and opinions in texts, discussions, and media. It is especially useful in subjects like history, science, and language arts.
Critical Thinking Exercises: Students can practice analyzing articles, essays, and other texts by separating factual information from personal viewpoints.
Media Literacy: Helps students and adults critically evaluate news articles, advertisements, and social media posts by identifying facts and opinions.
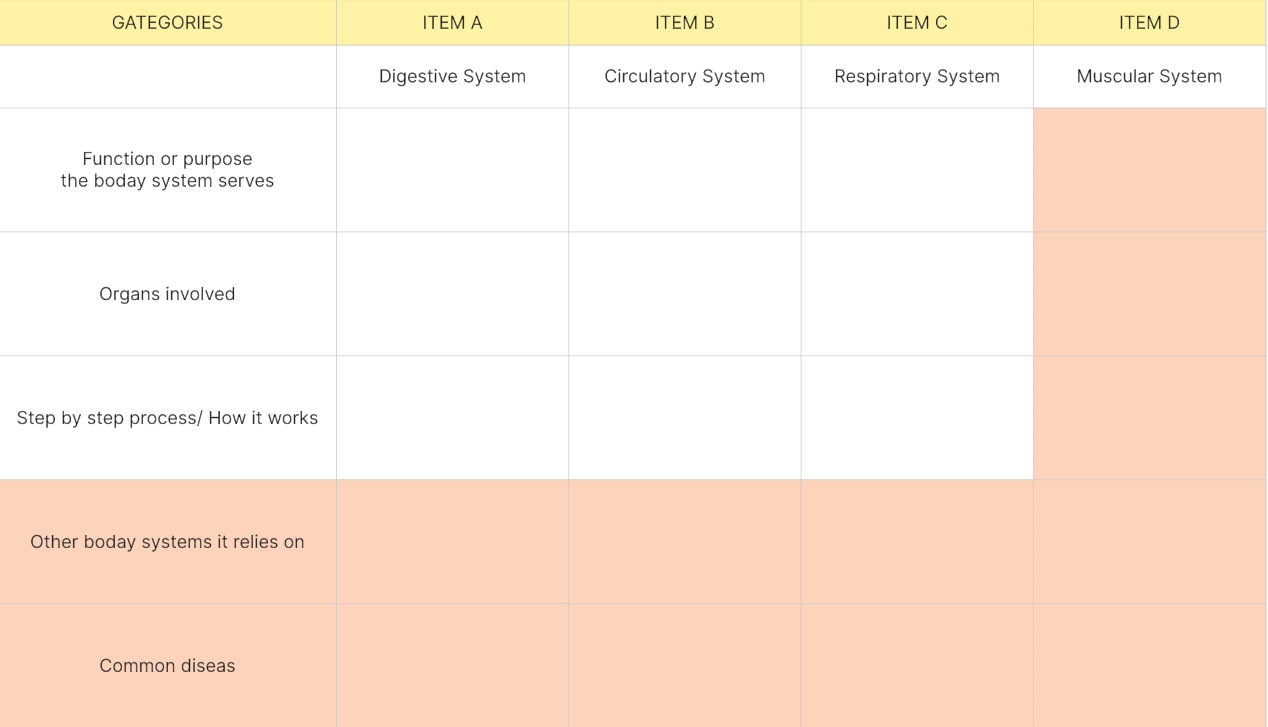
3. Compare and Contrast T Chart
The Compare and Contrast T chart is ideal for comparing two subjects: products, services, or ideas. It helps users identify similarities and differences, making it easier to evaluate and make decisions.
Applications:
Product Comparison: Consumers can compare features, prices, and benefits of different products to make informed purchasing decisions.
Service Evaluation: Businesses can compare different service providers or strategies to choose the best option for their needs.
Idea Analysis: Teams can use this template to evaluate different ideas or approaches for projects, campaigns, or problem-solving initiatives.
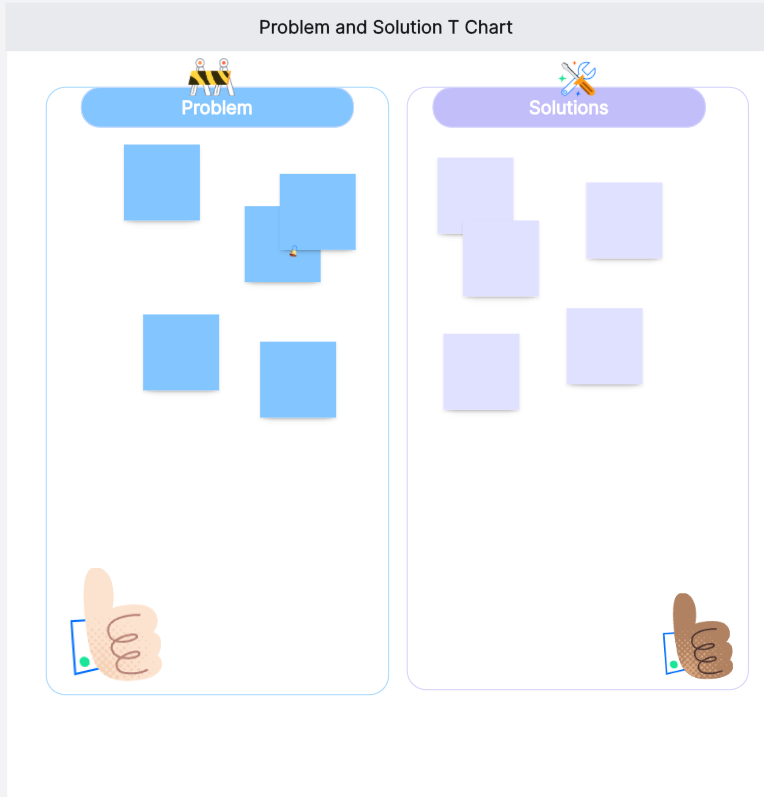
4. Problem and Solution T Chart
The Problem and Solution T chart is used to identify problems and brainstorm possible solutions. It is particularly useful in problem-solving workshops, project management, and strategic planning.
Applications:
Problem-Solving Workshops: Teams can collaboratively identify problems and brainstorm solutions, fostering creative thinking and innovation.
Project Management: Project managers can use this template to address potential issues in project plans and develop actionable solutions.
Strategic Planning: Businesses can identify strategic challenges and outline possible solutions to achieve long-term goals.
T charts are simple yet powerful tools that can help you organize information, compare options, and make informed decisions. Whether you create them in Word or use online tools like Boardmix, the key is to choose the method that best suits your needs. With the right templates and a bit of practice, you can harness the full potential of T charts in your personal and professional life. Start creating your T charts today and experience the benefits of this versatile tool!


