

Flowcharts are essential for mapping out processes and communicating ideas at work. Microsoft Visio is a popular tool for creating them. Wondering how to make a Visio flowchart? This guide breaks it down in simple terms! From prepping before you open the software to dragging and dropping your way to a finished diagram, we’ve got you covered with six clear steps. Plus, if you find Visio a bit complex or want a more collaborative option, we’ll introduce an easier, more user-friendly alternative. Let’s get started!
Before You Start: Prepping to Draw Your Visio Flowchart
A little preparation makes the actual drawing in Visio much smoother, saving you time and frustration as you build your flowchart. Rushing into the software without a plan often leads to disorganized diagrams, misplaced shapes, and rework—taking twice as long to finish. By spending 10-15 minutes on prep work, you’ll streamline the entire creation process and ensure your flowchart is logical, easy to follow, and aligned with your goals.
Get to Know the Visio Interface
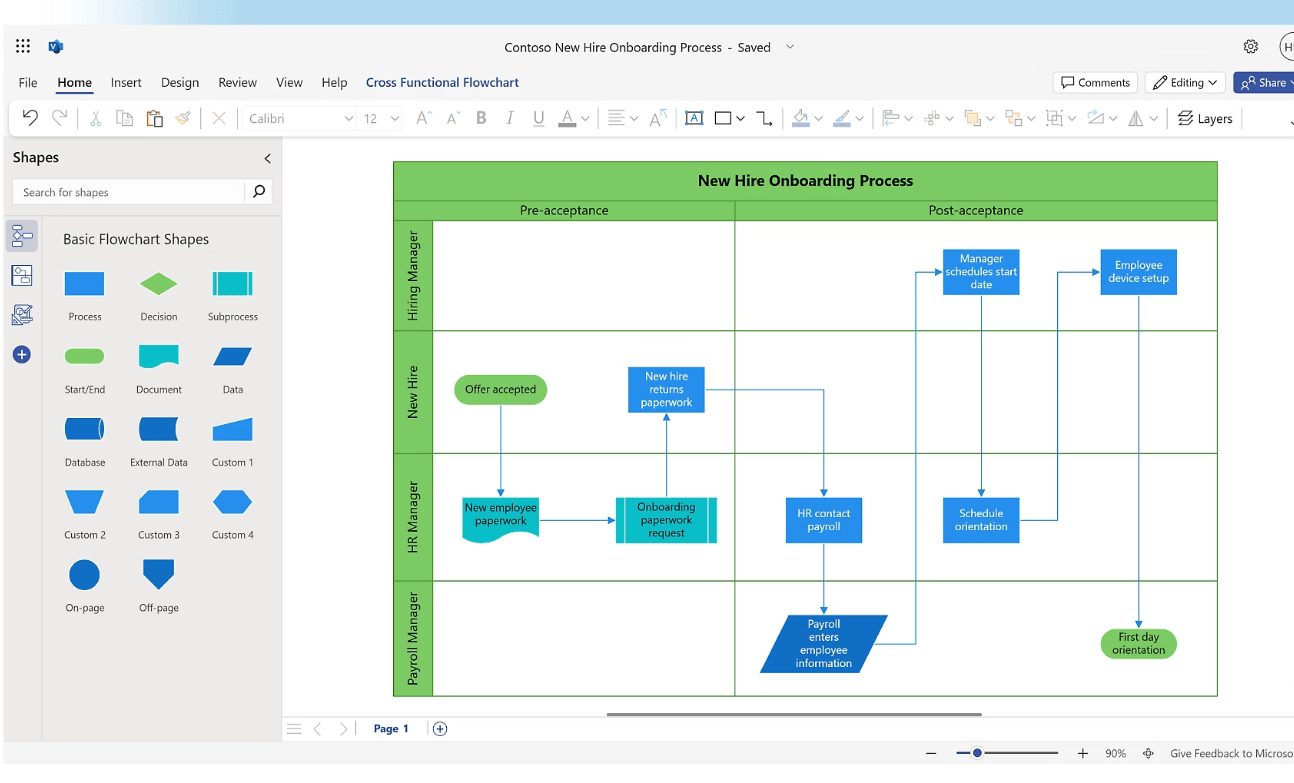
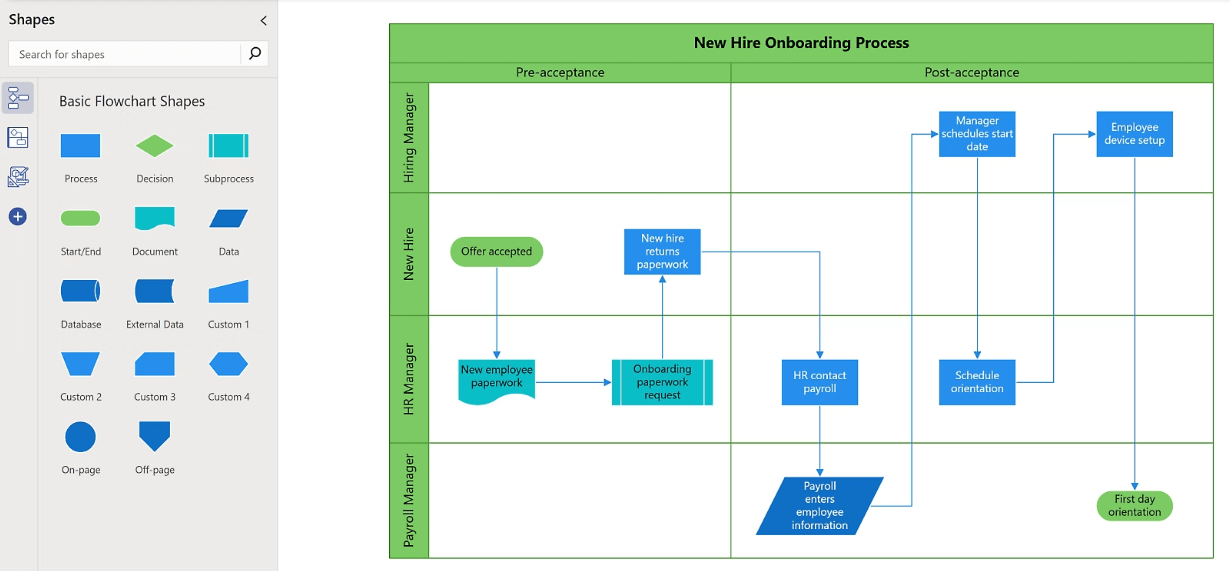
When you open Visio, familiarize yourself with the core areas that form the foundation of your workflow: the Menu/Ribbon at the top (which houses all editing, formatting, and sharing tools), the Shapes pane on the left (where you’ll find pre-built flowchart symbols like terminators, processes, and decisions), the central Drawing Canvas (your workspace for arranging shapes and connectors), and the Status Bar at the bottom (which shows helpful hints, selection details, and zoom levels). This is your primary workspace, and understanding each section will eliminate confusion as you start building your diagram. For example, the Ribbon is context-sensitive—clicking a shape will display formatting options specific to that element, making it easy to customize without hunting for tools.
Choose the Right Template
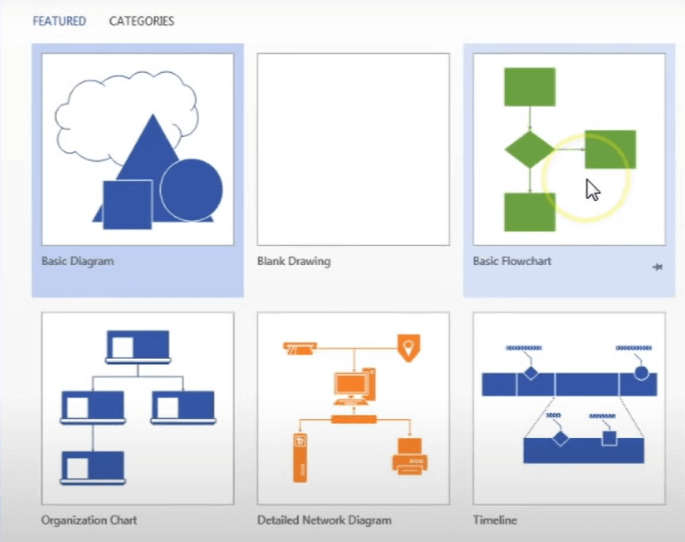
Click “New” on the Visio start screen and navigate to the “Flowchart” category, which includes templates tailored to different use cases like basic flowcharts, cross-functional flowcharts (for department-specific processes), and data flow diagrams. Beginners should start with the “Basic Flowchart” template, as it includes only the essential shapes (terminators, processes, decisions) and a clean canvas, avoiding the overwhelm of advanced templates. More experienced users might opt for specialized templates (e.g., “BPMN Diagram” for business process modeling), but the basic template is ideal for most everyday tasks like documenting a workflow, outlining a project process, or explaining a decision-making path.
Define Your Flowchart’s Purpose
Before drawing a single shape, clarify your goal to ensure your flowchart serves its intended purpose. Ask yourself: What type of flowchart are you creating? Is it a process flowchart for onboarding new employees, a decision flowchart for approving expenses, or a workflow for customer support tickets? Next, identify the clear start point (e.g., “New Customer Inquiry”) and end point (e.g., “Issue Resolved”) of your process, then list the key steps in between. For example, a customer support flowchart might include steps like “Receive Inquiry,” “Categorize Issue,” “Assign to Agent,” “Resolve Issue,” and “Follow Up.” Having a written outline of these steps before opening Visio streamlines the entire process, ensuring you don’t miss critical steps or add unnecessary elements that clutter the diagram.
How to Make a Flowchart in Visio: A Detailed 6-Step Guide
Follow these six steps to create a professional, easy-to-understand flowchart from start to finish. Each step builds on the last, and taking the time to execute them carefully will result in a diagram that clearly communicates your process to colleagues, stakeholders, or team members—even those with no prior knowledge of the workflow.
Step 1: Select Template & Place the Start Point
Open Visio, create a New document from the start screen, and select the “Basic Flowchart” template (or your chosen template) to open a blank canvas.
In the left-hand Shapes pane, expand the “Shapes” dropdown and select “Flowchart” to display the core symbols.
Locate the “Terminator” shape (a rounded rectangle), which marks the start and end of your process, and drag it onto the top-left corner of the Drawing Canvas (a strategic position that leaves room for the flow to move down and to the right).
This shape is non-negotiable—every flowchart needs a clear start point, and the terminator symbol is universally recognized in flowcharting standards, making your diagram easy to interpret for anyone familiar with basic flowchart conventions.
Step 2: Build the Main Process Flow
Drag a “Process” (rectangle) shape directly below your start terminator—this represents the first action in your workflow (e.g., “Collect Customer Information”).
Double-click the shape to add your first step name, keeping the text concise (1-3 words) to avoid overcrowding.
Continue adding more Process shapes for each subsequent step in your workflow, spacing them evenly to maintain readability (e.g., “Verify Information,” “Process Request,” “Send Confirmation”).
Next, use the Connector tool (found in the “Home” tab of the Ribbon) to link the shapes: click and drag from a small square connection point on the bottom of the Start shape to a connection point on the top of your first Process shape.
Visio will snap the connector to the shape, ensuring clean, straight lines. Repeat this to connect all subsequent Process shapes in order, building the backbone of your flowchart. For longer processes, group related steps to avoid a cluttered canvas—e.g., place all “Data Entry” steps in one section and “Approval” steps in another.
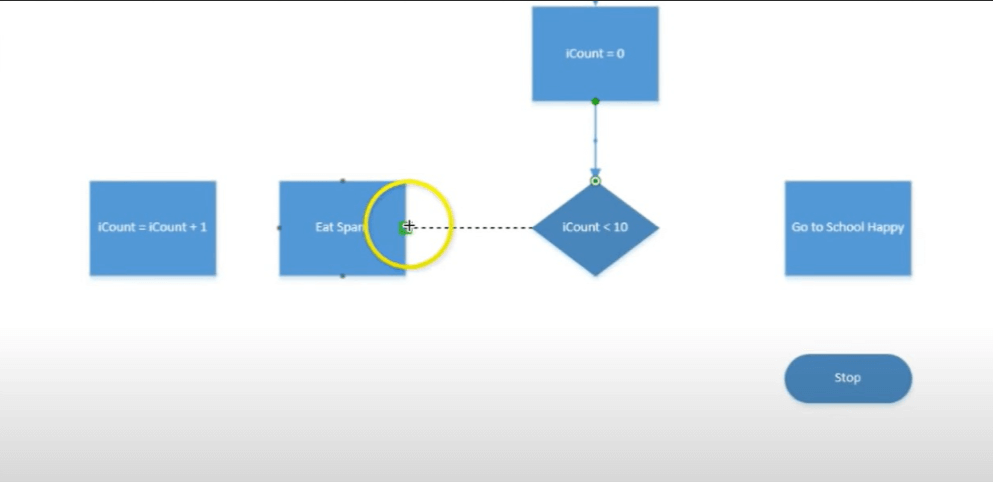
Step 3: Add Decision Points and Branches
Most workflows include decision points that split the process into multiple paths (e.g., “Approved?” or “Issue Resolved?”). For these, drag a “Decision” (diamond) shape into the flow, placing it after the relevant Process step (e.g., after “Submit Expense Report”).
Double-click the diamond to enter your question, using clear, concise language (e.g., “Amount > $500?”).
Use the Connector tool to draw two lines from the Decision shape: one for the “Yes” path (e.g., “Escalate to Manager”) and one for the “No” path (e.g., “Approve Automatically”), connecting each line to the appropriate next step shape.
To clarify the logic for viewers, add text labels next to each connector: click the “Text Box” tool in the Ribbon, draw a small box next to the connector line, and type “Yes” or “No” (or other relevant labels like “Urgent”/“Non-Urgent”). This step is critical—unlabeled decision branches are confusing and defeat the purpose of a flowchart, which is to make complex processes easy to follow.
Step 4: Add Details and Annotations
Enhance your flowchart’s clarity by adding supplementary shapes and annotations for complex steps.
Drag in other pre-built shapes as needed: use the “Document” shape (a rectangle with a folded corner) to represent a form or file (e.g., “Expense Report PDF”), the “Data” shape (a parallelogram) to show data input/output (e.g., “Enter Payment Details”), or the “Predefined Process” shape (a rectangle with double borders) to reference a separate flowchart (e.g., “Onboarding Checklist”).
For steps that require extra explanation (e.g., a process with specific rules like “Only for Full-Time Employees”), use Text Box tools to add clarifying notes directly on the canvas near the relevant shape.
Keep annotations brief (1-2 sentences) to avoid cluttering the diagram—their purpose is to clarify, not overwhelm. This extra layer of detail makes your flowchart more informative and useful for team members who need to follow or execute the process.
Step 5: Optimize Layout and Formatting
A well-formatted flowchart is easy to read at a glance, so take time to adjust the layout and styling of your diagram. Click and drag shapes or connectors to reposition them—ensure there’s consistent spacing between elements (Visio’s “Distribute” tool can automate this) and that the flow moves logically from top to bottom or left to right (avoid crossing lines, which cause confusion).
Select multiple shapes by holding the Shift key and clicking each one, then use the “Arrange” tab in the top Ribbon to align them perfectly: choose “Align Top” to line up the tops of Process shapes, or “Align Center” to center Decision shapes with their connectors.
You can also resize shapes by dragging their edges (hold Shift to maintain proportions) to ensure text fits without overlapping. For added clarity, use the “Format” tab to change the color of shapes (e.g., red for decision points, blue for processes) or adjust connector thickness—consistent formatting makes the diagram scannable and professional.
Step 6: Save and Share Your Flowchart
Once your flowchart is complete, save your work to ensure you can edit it later: click File > Save As, choose a location (e.g., your computer, OneDrive), and save it as a .vsdx (Visio) source file—this is the native format that preserves all editable elements (shapes, connectors, text) for future changes.
To share the flowchart with people who don’t have Visio installed (e.g., colleagues using Macs or mobile devices), save a copy in a universal format like PDF (best for printing or sharing via email), PNG (ideal for inserting into presentations or documents), or JPEG (for web use).
When saving as a PDF, select “High Quality” to ensure shapes and text are crisp, and check the “Fit to Page” option to avoid cutting off elements on the edges. For collaborative feedback, you can also save the Visio file to OneDrive and share a link with edit permissions, though this requires recipients to have access to Visio Online or the desktop app.
A More Agile Flowchart Tool Alternative
The interface, while robust, is dense with advanced tools—beginners often spend hours learning basic functions like adding connectors or formatting shapes, and even experienced users can struggle with its rigid layout rules. Most critically, real-time multi-user collaboration is limited: while Visio Online allows co-editing, it lacks live cursor tracking, comment threads, and instant updates, requiring teams to email files back and forth or use third-party add-ons (e.g., SharePoint) to collaborate effectively.
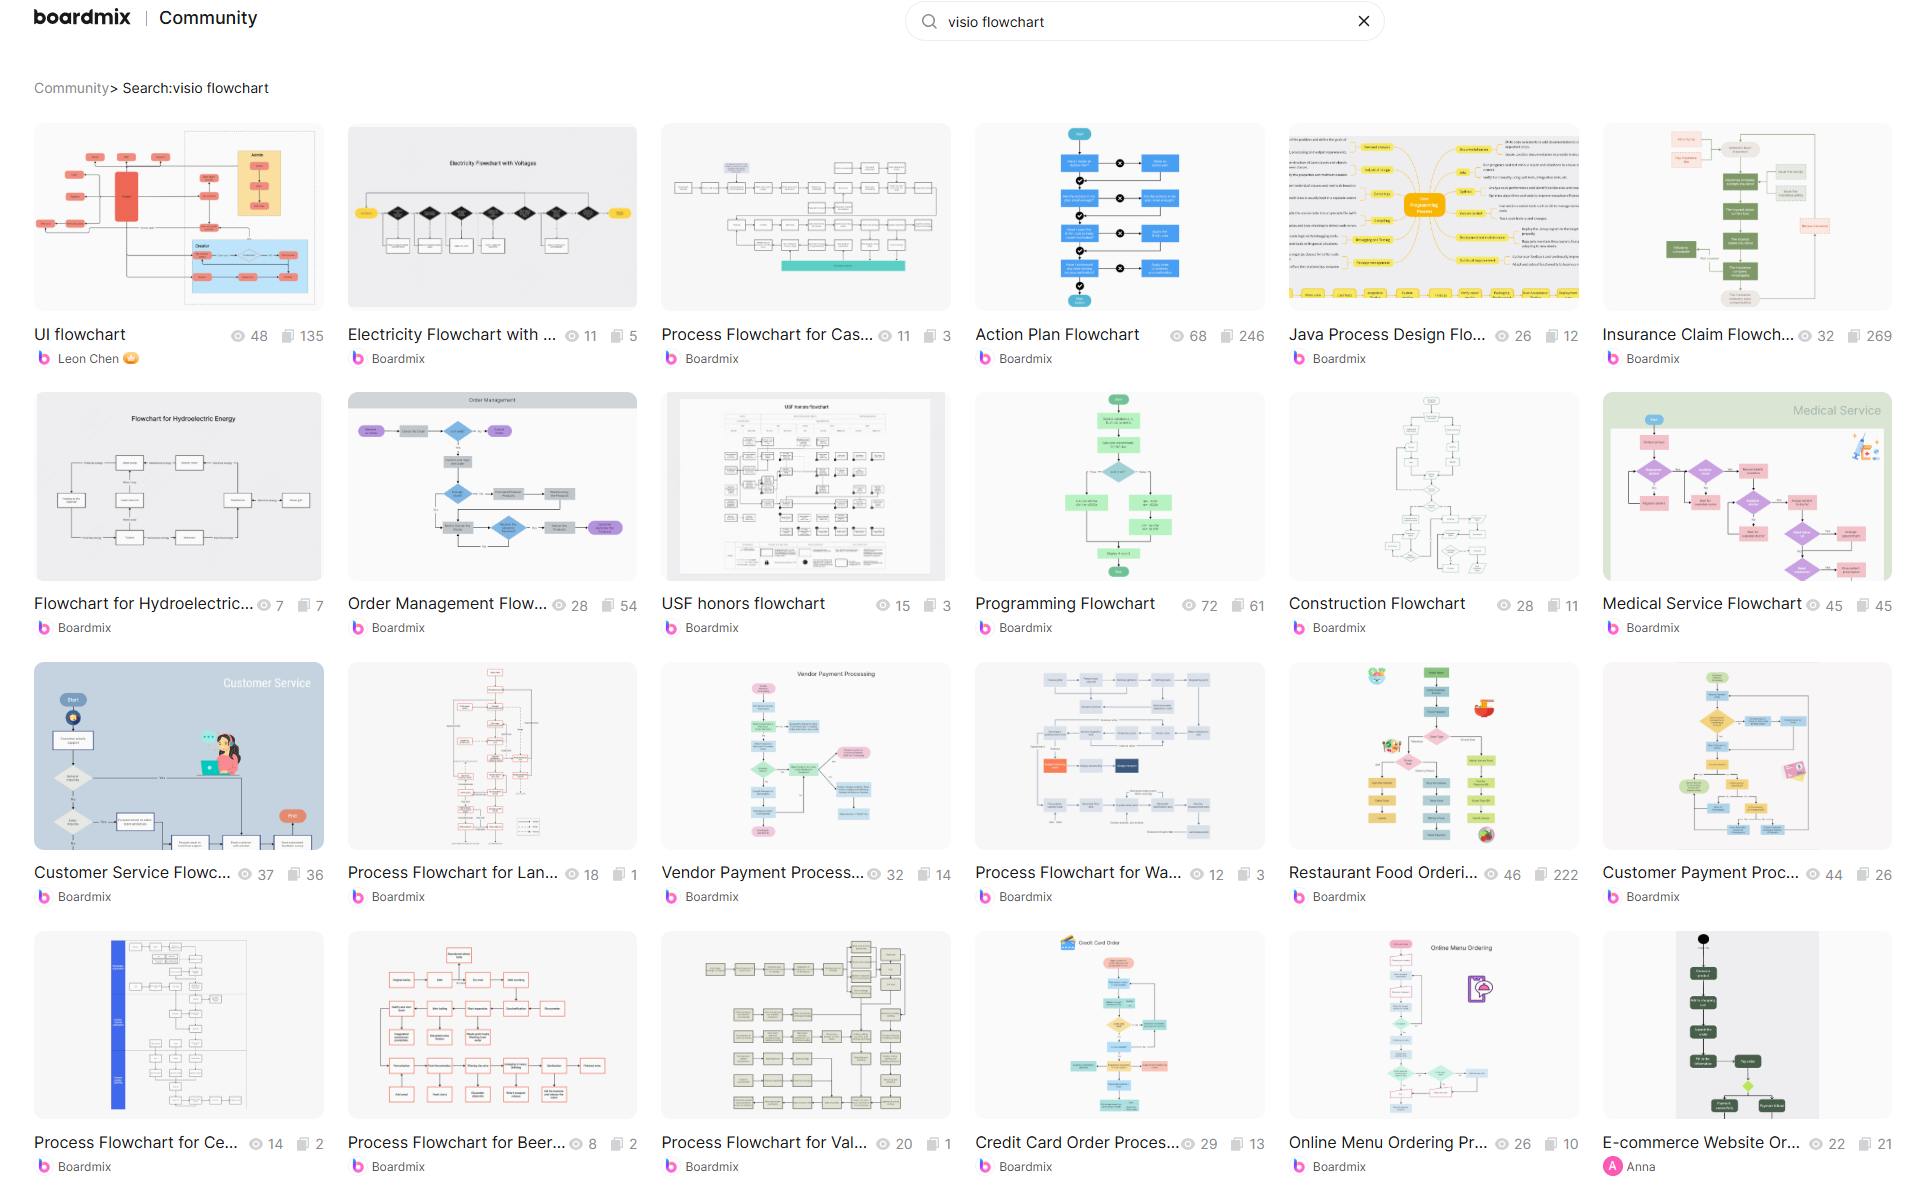
For a more intuitive, collaborative, and web-based alternative that eliminates these pain points, try Boardmix! Designed for modern teams, Boardmix combines the power of Visio with the simplicity of a whiteboard tool, making it the ideal choice for anyone who wants to create professional flowcharts without the steep learning curve.
Here’s why it stands out from Visio and other flowchart tools:
Zero Learning Curve, AI-Powered
Boardmix’s interface is clean, minimal, and intuitive—unlike Visio’s cluttered Ribbon and complex menus. The drag-and-drop functionality is effortless: select a shape from the left-hand library, drop it on the canvas, and connect it with a single click (Boardmix auto-generates clean connectors that snap to shapes, no manual dragging required). It’s significantly easier to learn than Visio—most users can start diagramming in 5 minutes or less, even with no prior flowchart experience. The built-in AI Assistant takes this a step further: simply type a description of your process (e.g., “Customer support workflow from inquiry to resolution”) and the AI will generate a complete flowchart draft instantly, which you can customize to fit your needs. This AI feature saves hours of manual work, especially for long or complex processes.
Professional Diagramming Features
Despite its simplicity, Boardmix doesn’t compromise on professional features: it includes a comprehensive library of standard shapes (UML, BPMN, flowcharts, org charts), smart connectors that automatically adjust as you move shapes, auto-layout tools to organize cluttered diagrams with one click, and advanced styling options (colors, fonts, line thickness) to match your brand or team guidelines. Creating professional-grade flowcharts in Boardmix is just as capable as in Visio—you can build everything from basic process diagrams to complex cross-functional workflows, and the tool supports high-resolution exports to ensure your diagrams look polished in presentations, reports, or shared documents.
True Real-Time Collaboration
Boardmix’s biggest advantage over Visio is its real-time collaboration capabilities, designed for remote and hybrid teams. Invite your entire team to edit the same board simultaneously—see each other’s cursors move in real time, watch changes update instantly, and add comment threads directly on shapes or connectors to discuss details (e.g., “@Sarah: Should this step be a decision or process?”). There’s no need to email files or worry about version control—Boardmix saves every change automatically, and you can revert to previous versions with one click. This seamless communication eliminates the back-and-forth of Visio collaboration, making it easy to align on process details, gather feedback, and finalize diagrams faster.
Vast Template Library
Like Visio, Boardmix offers a library of pre-built templates—but with hundreds of options tailored to specific industries and use cases (e.g., HR onboarding, sales workflows, project management, customer support). Unlike Visio’s generic templates, Boardmix’s templates are designed by industry experts and include pre-filled steps, making it easy to jumpstart your work with one click. For example, the “Employee Onboarding Flowchart” template includes all key steps (Offer Accepted, Background Check, Training, First Day) and decision points (Full-Time vs. Contract), so you don’t have to start from scratch. This library dramatically boosts productivity—users report saving 70% of the time they’d spend building flowcharts from scratch in Visio.
Fully Cross-Platform & Visio Compatible
Unlike Visio (which is limited to Windows desktops and Visio Online), Boardmix is fully cross-platform: access it from any web browser on Windows, Mac, iOS, or Android—no installation or downloads required. This means you can work on a flowchart from your desktop at work, refine it on your tablet during a commute, and share it with a team member on their phone. Boardmix also seamlessly imports Visio files (.vsdx), so you can convert your existing Visio diagrams to Boardmix’s collaborative format and continue working with your team without losing progress. This compatibility makes it easy to switch from Visio to Boardmix without abandoning your existing work.
Conclusion
You’ve now mastered the basic steps of how to create a flowchart in Visio! With practice, you’ll be able to create professional, detailed diagrams that clearly communicate processes, decisions, and workflows—whether for internal team use, client presentations, or enterprise documentation. Remember, the tool serves the goal: the best flowchart is one that is easy to understand, aligns with your purpose, and effectively communicates your process to its intended audience, regardless of the software used to create it.
If you’re looking for a more efficient, collaborative, and user-friendly way to make flowcharts—especially for remote teams, quick projects, or beginners—Boardmix is your ideal partner. It combines the professional features of Visio with the simplicity of a whiteboard tool, the speed of AI generation, and the flexibility of real-time collaboration, making diagramming both simple and smart. Whether you’re replacing Visio entirely or using Boardmix for collaborative projects while keeping Visio for complex enterprise diagrams, it’s a tool that adapts to your team’s needs.
Ready to draw better flowcharts together, without the hassle of complex software or clunky collaboration? Sign up for free and start your Boardmix journey today!


