

A web graphic organizer is an invaluable tool that helps visualize and structure information, making complex ideas easier to understand and manage. Whether you're brainstorming, planning projects, or teaching, this guide will show you how to leverage web graphic organizers and graphic organizer templates to enhance productivity and learning.
What is a Web Graphic Organizer and Why Should You Use One
A web graphic organizer is a visual tool that helps users structure information in a way that highlights the relationships between different concepts. It typically features a central idea with branches extending out to related topics, much like a spider web. This method of organizing information can be particularly useful for brainstorming sessions, planning projects, and teaching complex subjects.
Categorized Types of Graphic Organizers
Relationship Maps
Concept Maps: Used to visualize relationships between concepts, typically starting with a central idea and branching out into related subtopics.
Mind Maps: Similar to concept maps but more flexible in structure, often used for brainstorming and creative thinking.
Spider Maps: Feature a central idea in the middle with subtopics branching out in a radial fashion.
Bubble Maps: Used to describe qualities related to a central idea, with bubbles radiating outwards to show attributes.
Hierarchical and Structural Maps
Hierarchical Maps: Organize information in a top-down structure, showing levels of importance.
Tree Diagrams: Show hierarchical relationships with a root node branching out into child nodes, often used for organizational charts or family trees.
Process and Sequence Maps
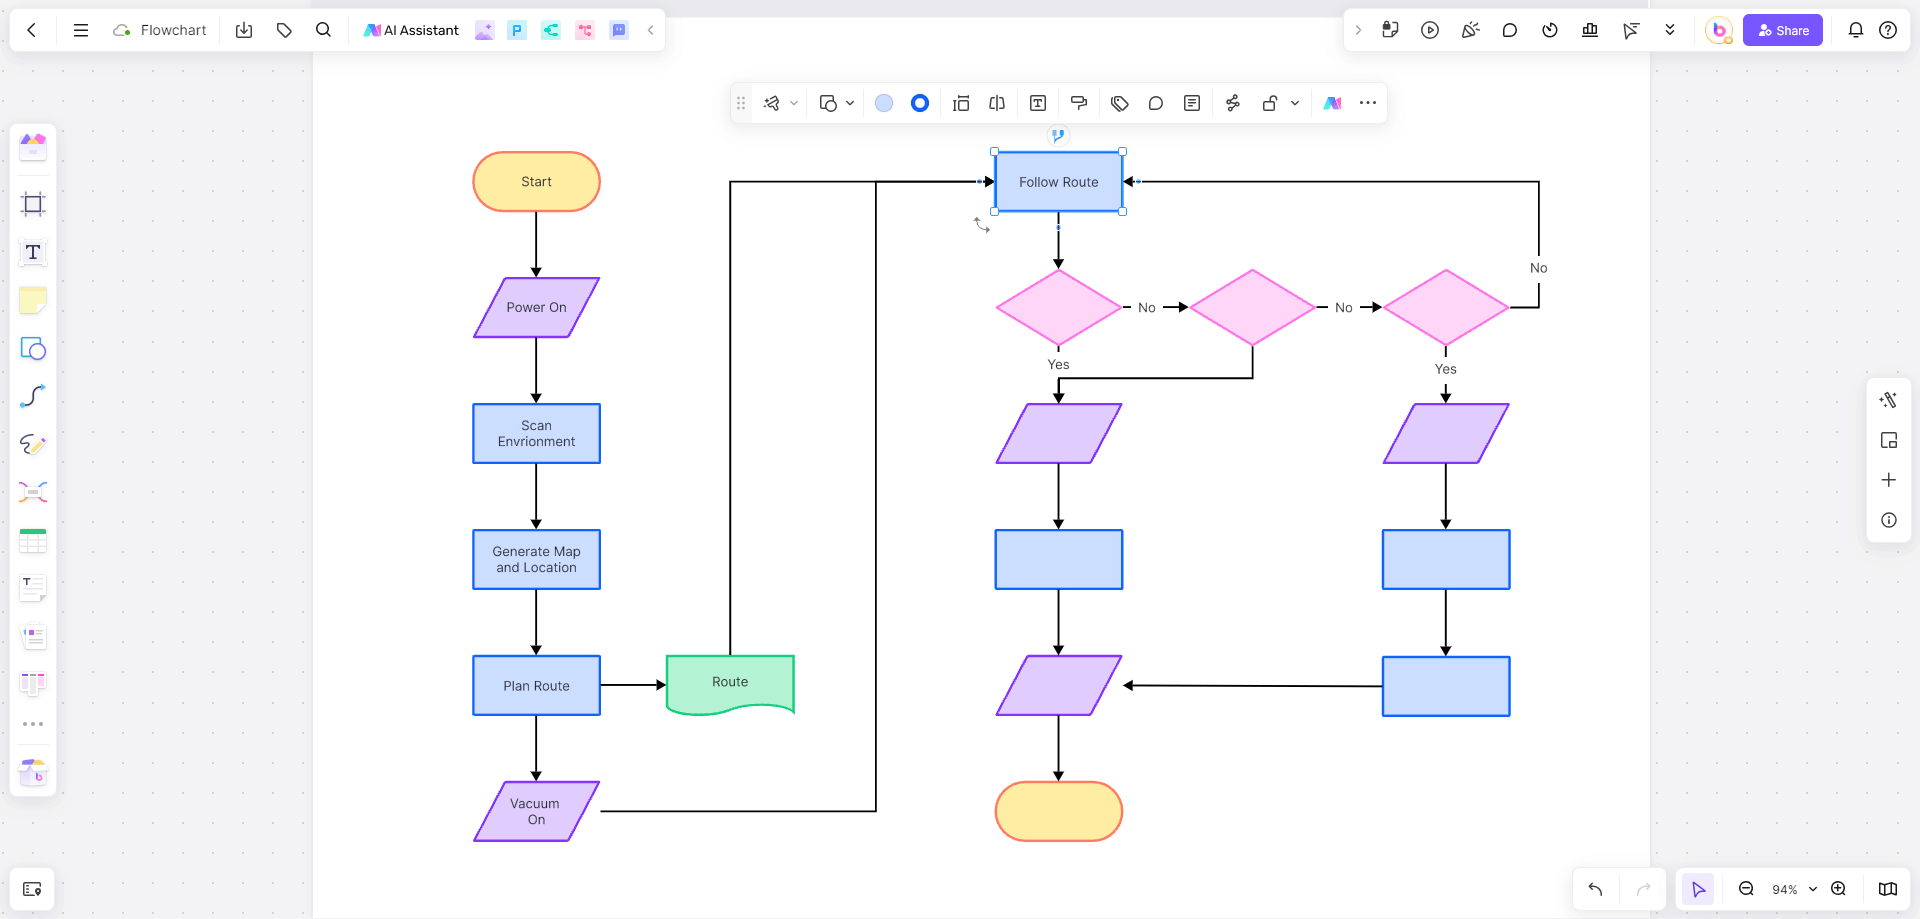
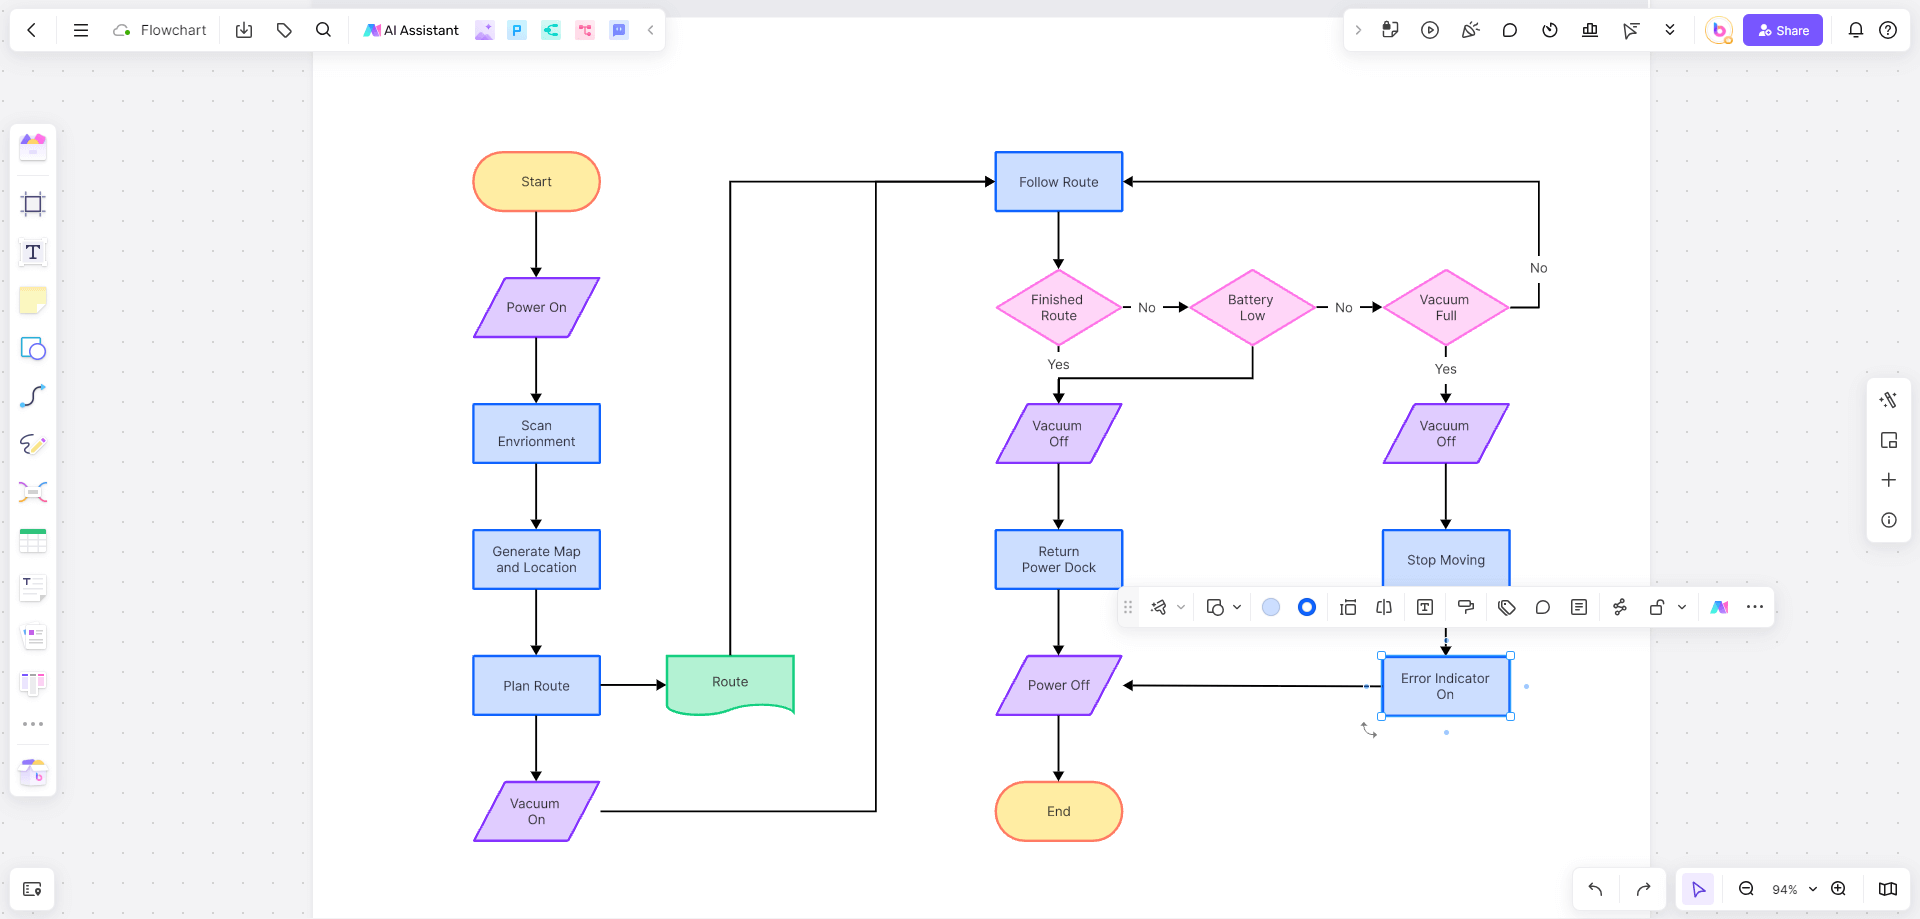
Flowcharts: Illustrate a sequence of steps or processes, often used in decision-making or to show workflows.
Fishbone Diagrams (Ishikawa): Used to identify the causes of a specific event or problem, with the main problem at the head and causes branching out like fishbones.
Comparison and Contrast Maps
Venn Diagrams: Show relationships between different sets, highlighting similarities and differences.
T-Charts: Compare two different concepts or ideas side-by-side, often used for pros and cons, facts vs. opinions, etc.
Double Bubble Maps: Compare and contrast two ideas or items, with bubbles connecting similarities and differences.
Learning and Planning Maps
KWL Charts: Used for learning purposes, with sections for what you Know, what you Want to know, and what you Learned.
Create a Web Graphic Organizer with Boardmix
Features to Look for in a Good Graphic Organizer Tool
When choosing a graphic organizer tool, consider the following features:
User-Friendly Interface: The tool should be easy to navigate and use.
Customization Options: Look for a tool that allows you to customize the graphic organizer templates to fit your specific needs.
Collaboration Features: It should support real-time collaboration, enabling multiple users to work on the same organizer simultaneously.
Integration Capabilities: The tool should integrate with other software you use, such as project management tools or educational platforms.
Export Options: Ensure that you can export your graphic organizers in various formats like PDF, PNG, or as a web link.
For these reasons, we highly recommend using Boardmix, as it excels in all these areas and more, providing a robust platform for creating and sharing graphic organizers.
Detailed Guide to Create a Web Graphic Organizer with Boardmix
Creating a web graphic organizer with Boardmix can streamline your planning and brainstorming sessions. Follow these detailed steps to make the most of this powerful tool:
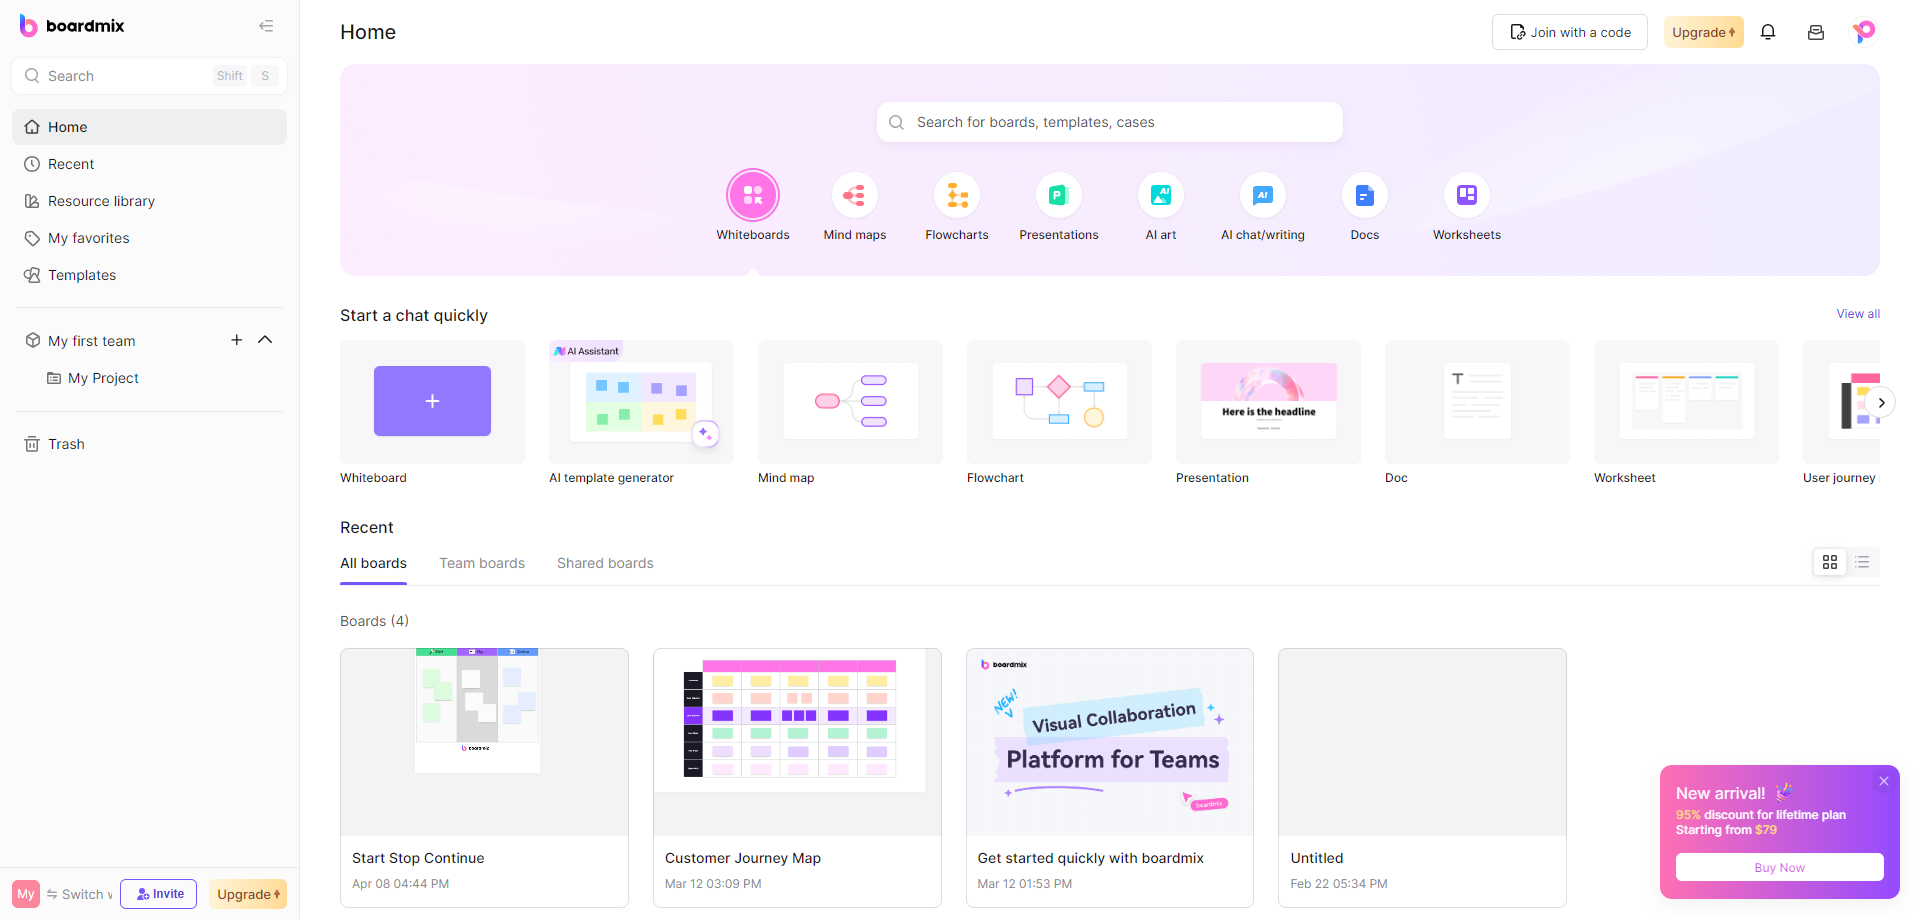
Open Boardmix:

Visit the Website: Navigate to the Boardmix website.
Log In: Enter your credentials to log in to your account.
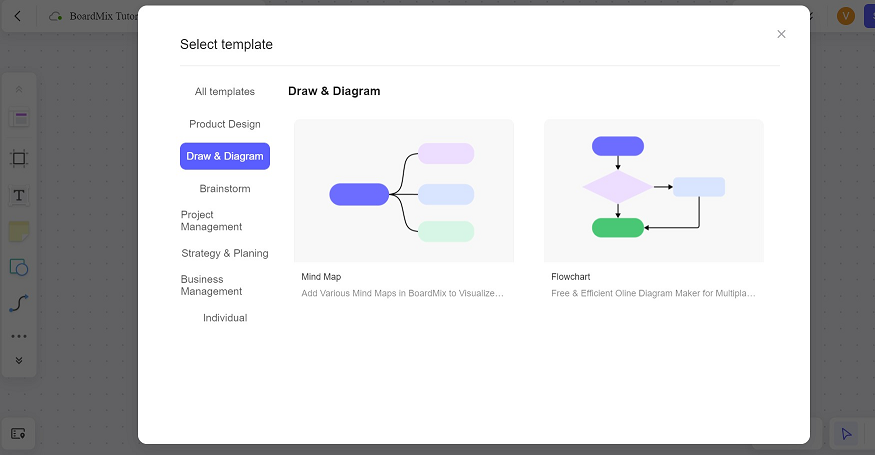
Select a Template:
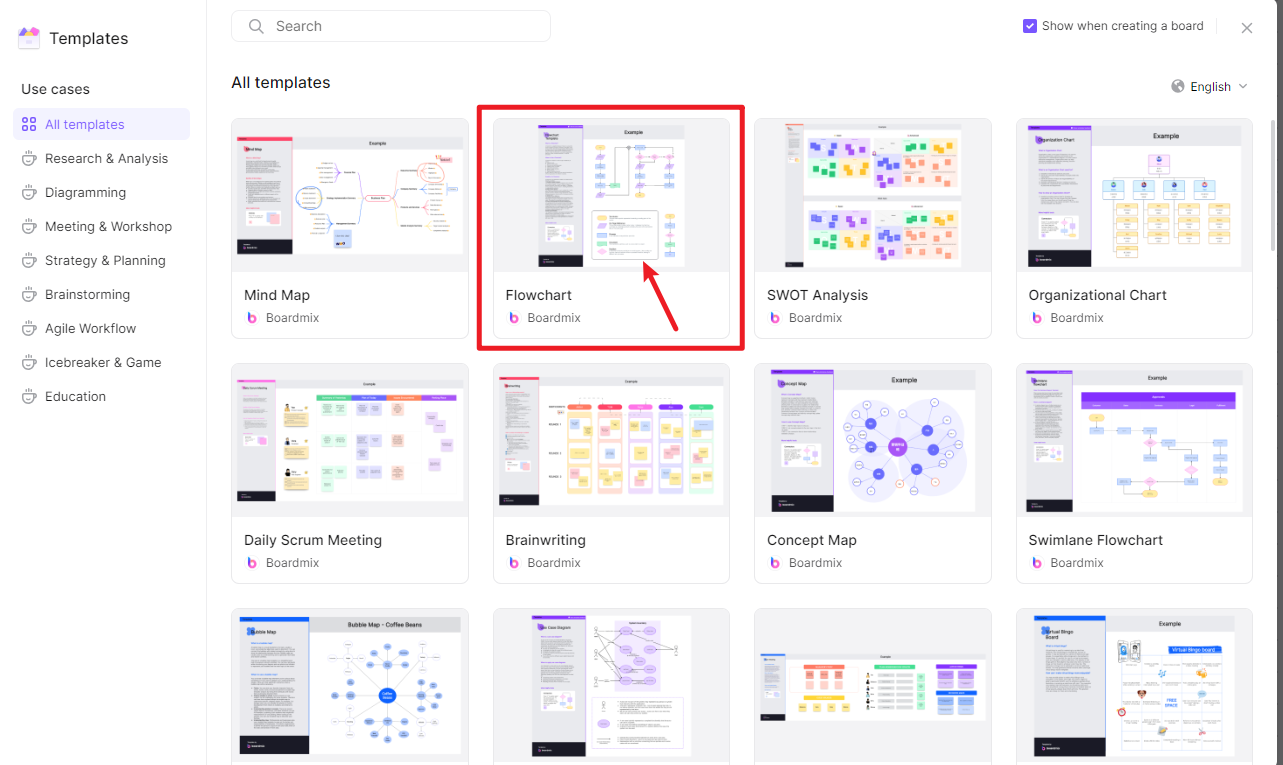
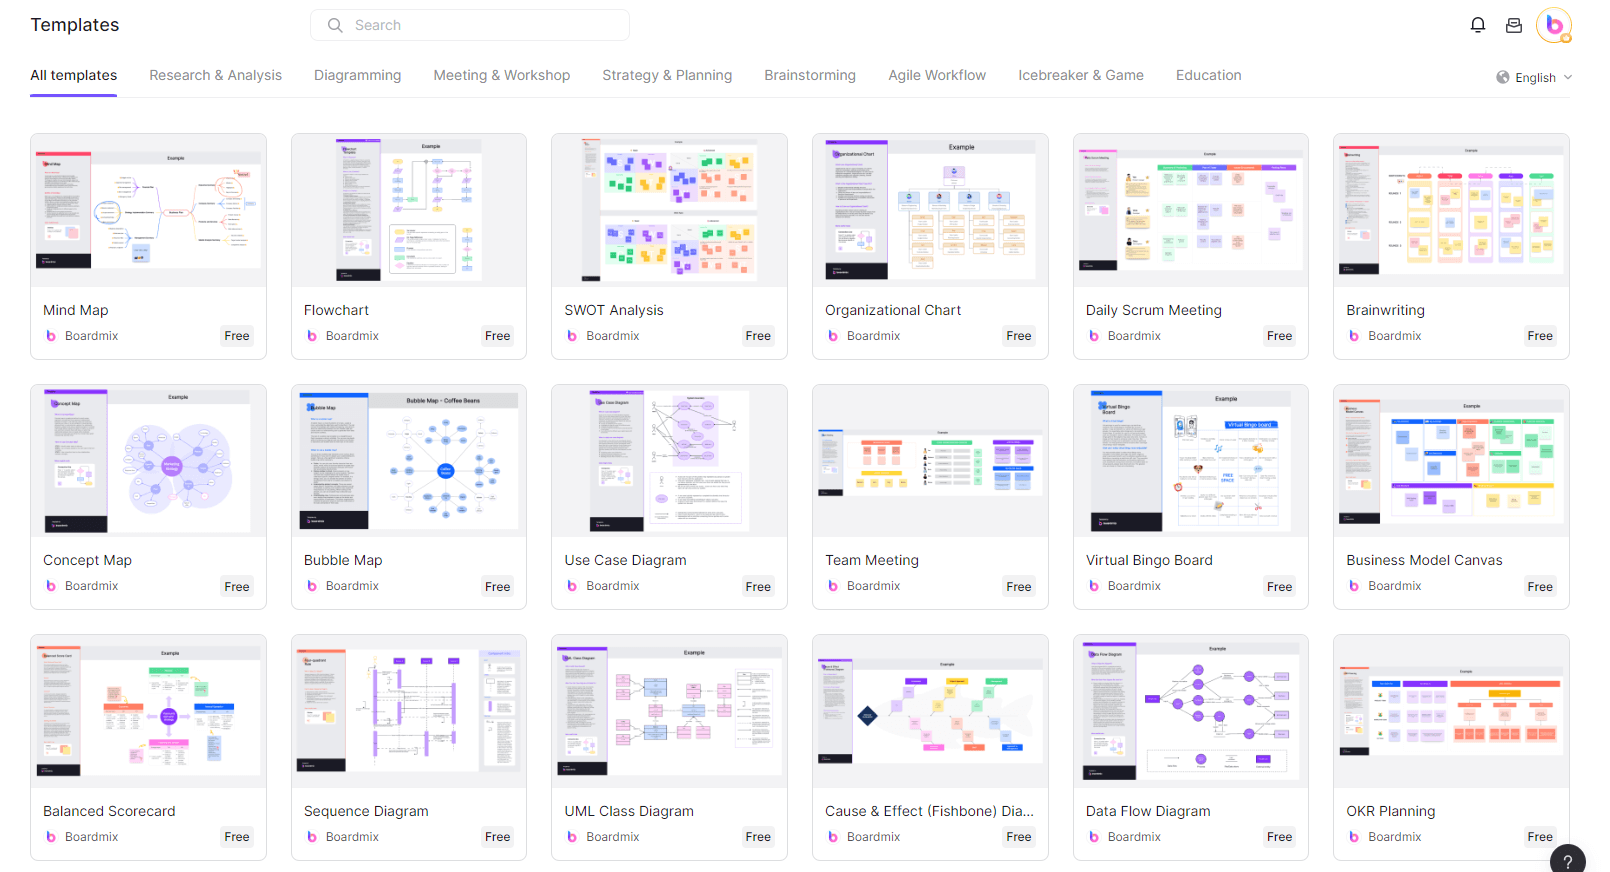
Browse Templates: Boardmix offers a variety of chart type templates such as Customer Journey Map, Venn Diagram, SMART Goals, Decision-making Tree, etc. Browse through the template library to find the one that best suits your project needs.
Select Template: Click on the template to open it in the editor.
Add Central Idea:
Main Node: Click on the main node (usually located in the center of the template).
Enter Central Idea: Type in the main idea or topic of your graphic organizer.
Branch Out:
Add Branches: Click on the main node and select ‘Add Branch’ to create subtopics.
Label Branches: Enter text for each branch to represent related subtopics or concepts.
Customize Nodes:
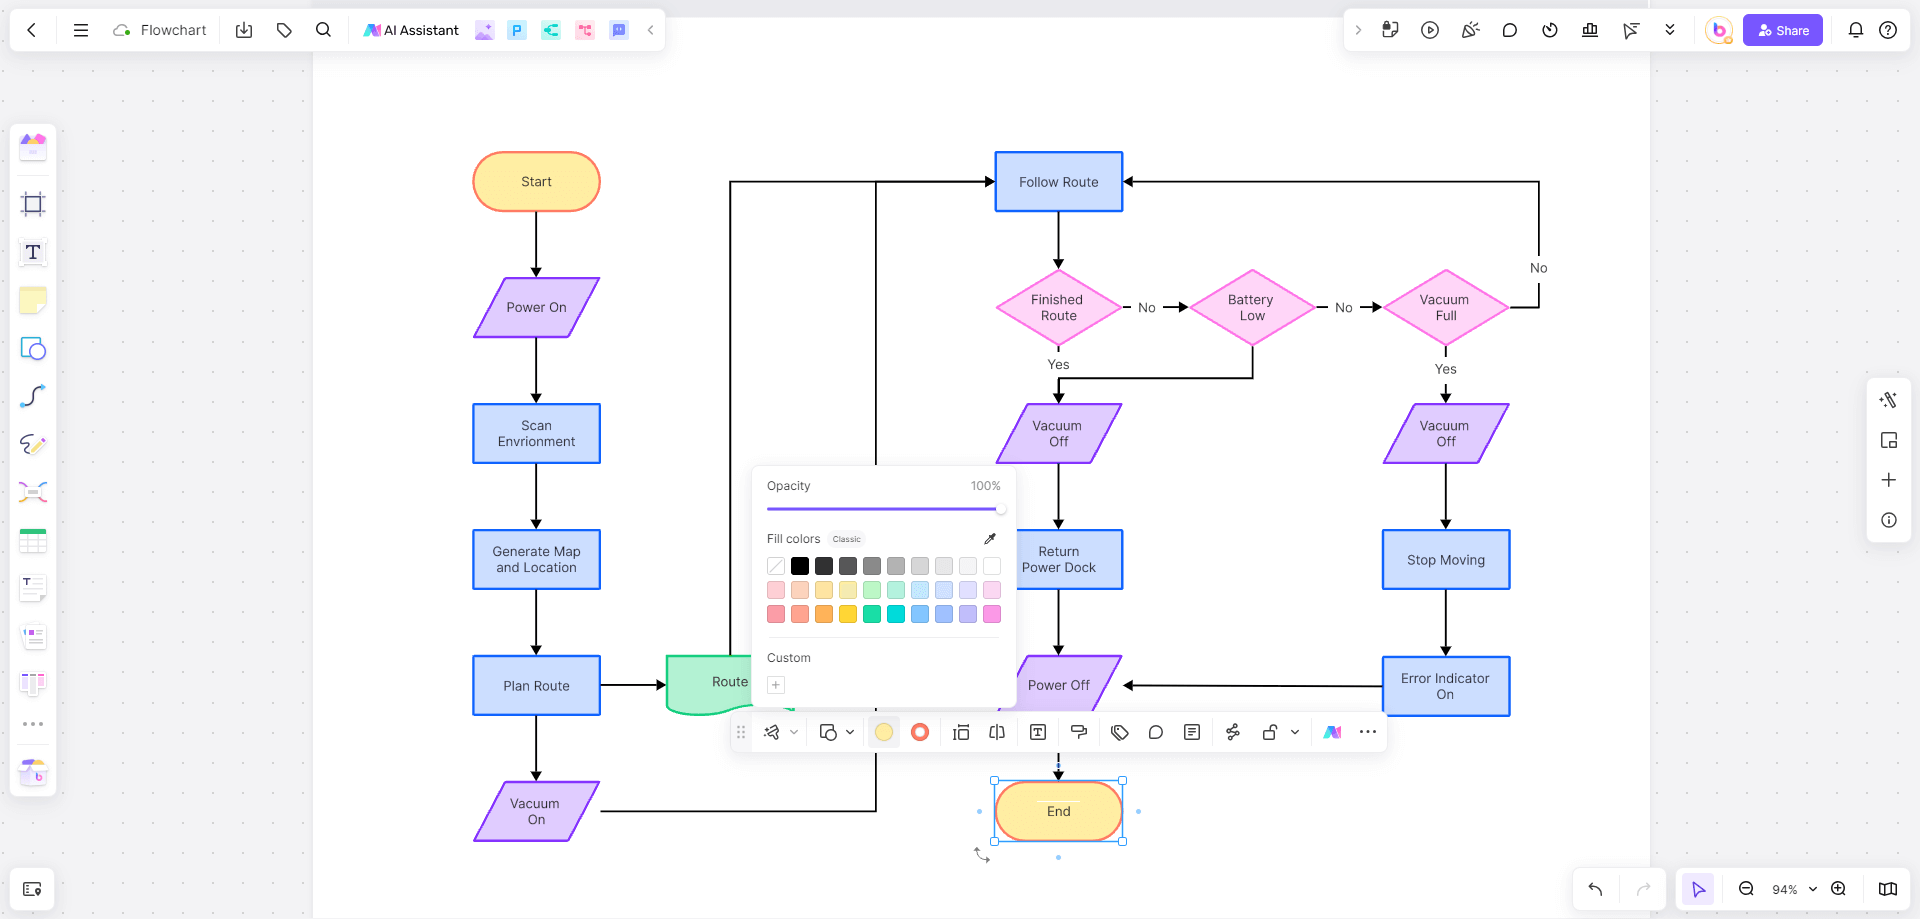
Text and Multimedia: Click on each node to add text, images, and links. This can include notes, definitions, or multimedia relevant to the subtopic.
Appearance: Customize the appearance of each node by changing colors, shapes, and fonts to improve visual clarity and aesthetics.
Collaborate:
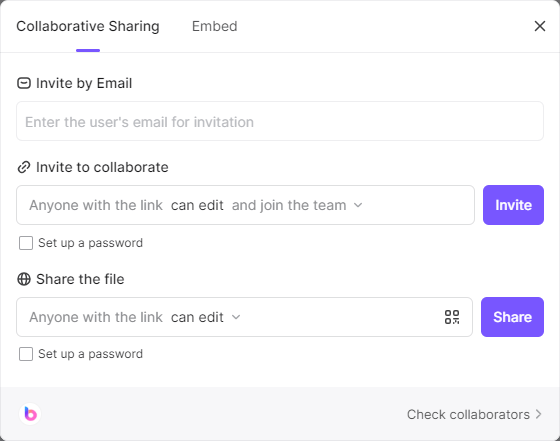
Share Project: Click on the ‘Share’ button to invite team members or students to collaborate in real-time.
Collaboration Tools: Utilize Boardmix’s collaboration features such as comments, chat, and real-time updates to enhance teamwork.
Save and Export:
Save Project: Boardmix will automatically save your creations in the cloud.
Export Options: Once you’ve finished, export your graphic organizer in your desired format. Boardmix supports various export options, including PDF, PNG, and web links.
Sharing: Share the exported file via email, cloud storage, or directly from Boardmix to ensure accessibility for all team members or students.
Web Graphic Template Examples
Customer Journey Map: Helps you visualize the experiences of a customer as they interact with your product or service.
Venn Diagram: Used to show the relationships and intersections between multiple sets.
SMART Goals: Assists in setting Specific, Measurable, Achievable, Relevant, and Time-bound goals.
Decision-making Tree: Analyzes possible consequences of various decisions.
Gratitude Tree: A visual tool to record and share things you are grateful for.
Service Blueprint: Describes the service process in detail, including its components.
Stakeholder Analysis: Identifies and assesses the influence and interests of stakeholders in a project or business.
Six Thinking Hats: Helps teams think and discuss from different perspectives.
Virtual Scavenger Hunt: An interactive game for team members to search and collect information in a virtual environment.
How to Customize Graphic Organizer Templates to Fit Your Projects?
Customizing graphic organizer templates can help tailor them to your specific needs, making them more effective for your projects. Here’s how to do it:
Select a Template: Start by choosing a template that closely matches your project’s requirements.
Add/Remove Nodes: Modify the template by adding new nodes for additional concepts or removing unnecessary ones.
Change Colors and Fonts: Use colors and fonts that align with your project’s theme or your personal preferences.
Insert Multimedia: Enhance your graphic organizer by adding images, videos, or links to external resources.
Adjust Layout: Rearrange the nodes to create a layout that best represents the relationships between your ideas.
Examples of Building Web Graphic Organizer
Education Sector
Case Study 1: High School Biology Class
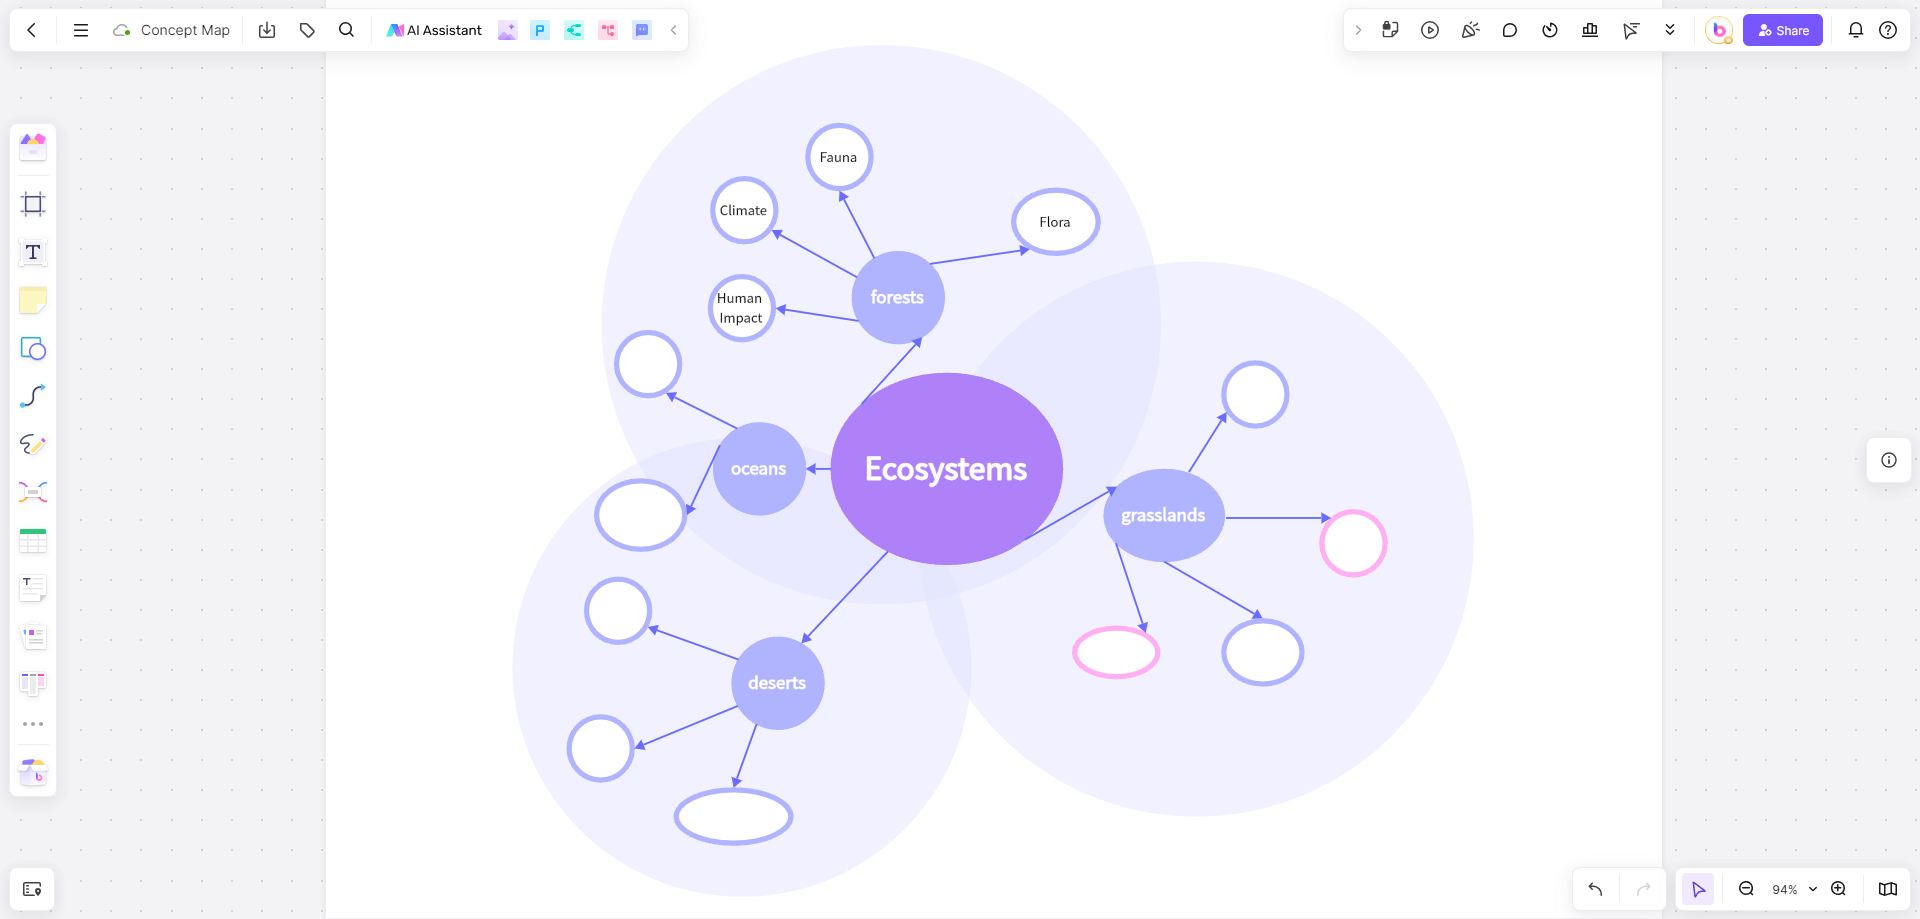
A high school biology teacher, Mrs. Johnson, used web graphic organizers to teach the concept of ecosystems. She started by introducing a Concept Map template on Boardmix, featuring a central node labeled "Ecosystems". From this central idea, branches extended to various types of ecosystems such as forests, oceans, deserts, and grasslands.
Each student was tasked with creating their own web graphic organizer, detailing the specific characteristics of their assigned ecosystem. For instance, a student working on the forest ecosystem identified subtopics like "Flora", "Fauna", "Climate", and "Human Impact". Under "Flora", they listed trees, shrubs, and ground cover plants, adding images and notes about each.
The visual approach allowed students to clearly see the relationships between different components of the ecosystem. They could easily understand how changes in one part of the ecosystem could affect others. This method proved to be highly effective in helping students grasp complex ecological relationships and interactions.
Case Study 2: University Research Project
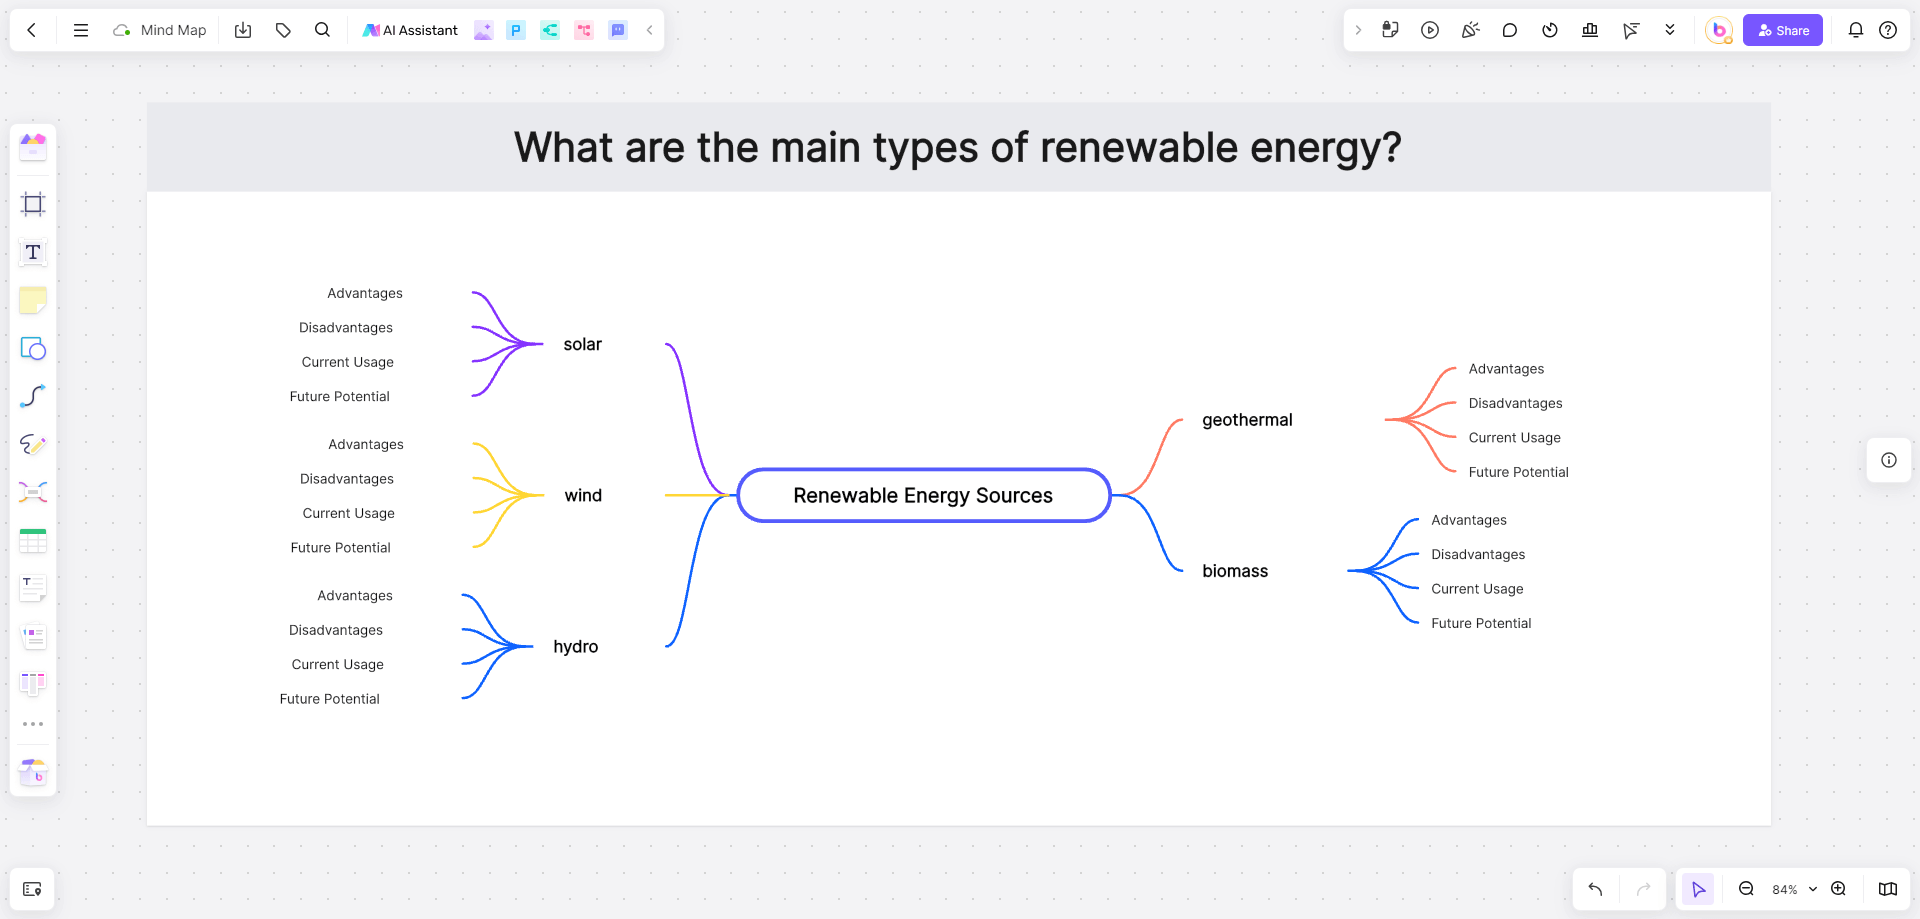
A group of university students working on a research project about renewable energy sources used a web graphic organizer to plan their project. They began by mapping out their research questions using a Research Mind Map template in Boardmix. Their questions included inquiries like "What are the main types of renewable energy?" and "How do these energy sources impact the environment?"
Using Boardmix, they created a central node labeled "Renewable Energy Sources". From there, they branched out to different types of renewable energy such as solar, wind, hydro, geothermal, and biomass. Each branch included subtopics like "Advantages", "Disadvantages", "Current Usage", and "Future Potential".
The graphic organizer also included links to sources, images of renewable energy installations, and notes on each type of energy. This organized approach allowed the group to see the scope of their research at a glance and ensured that all members were on the same page. It streamlined their workflow, improved collaboration, and helped them efficiently distribute tasks among team members.
Business Sector
Case Study 1: Marketing Campaign Planning
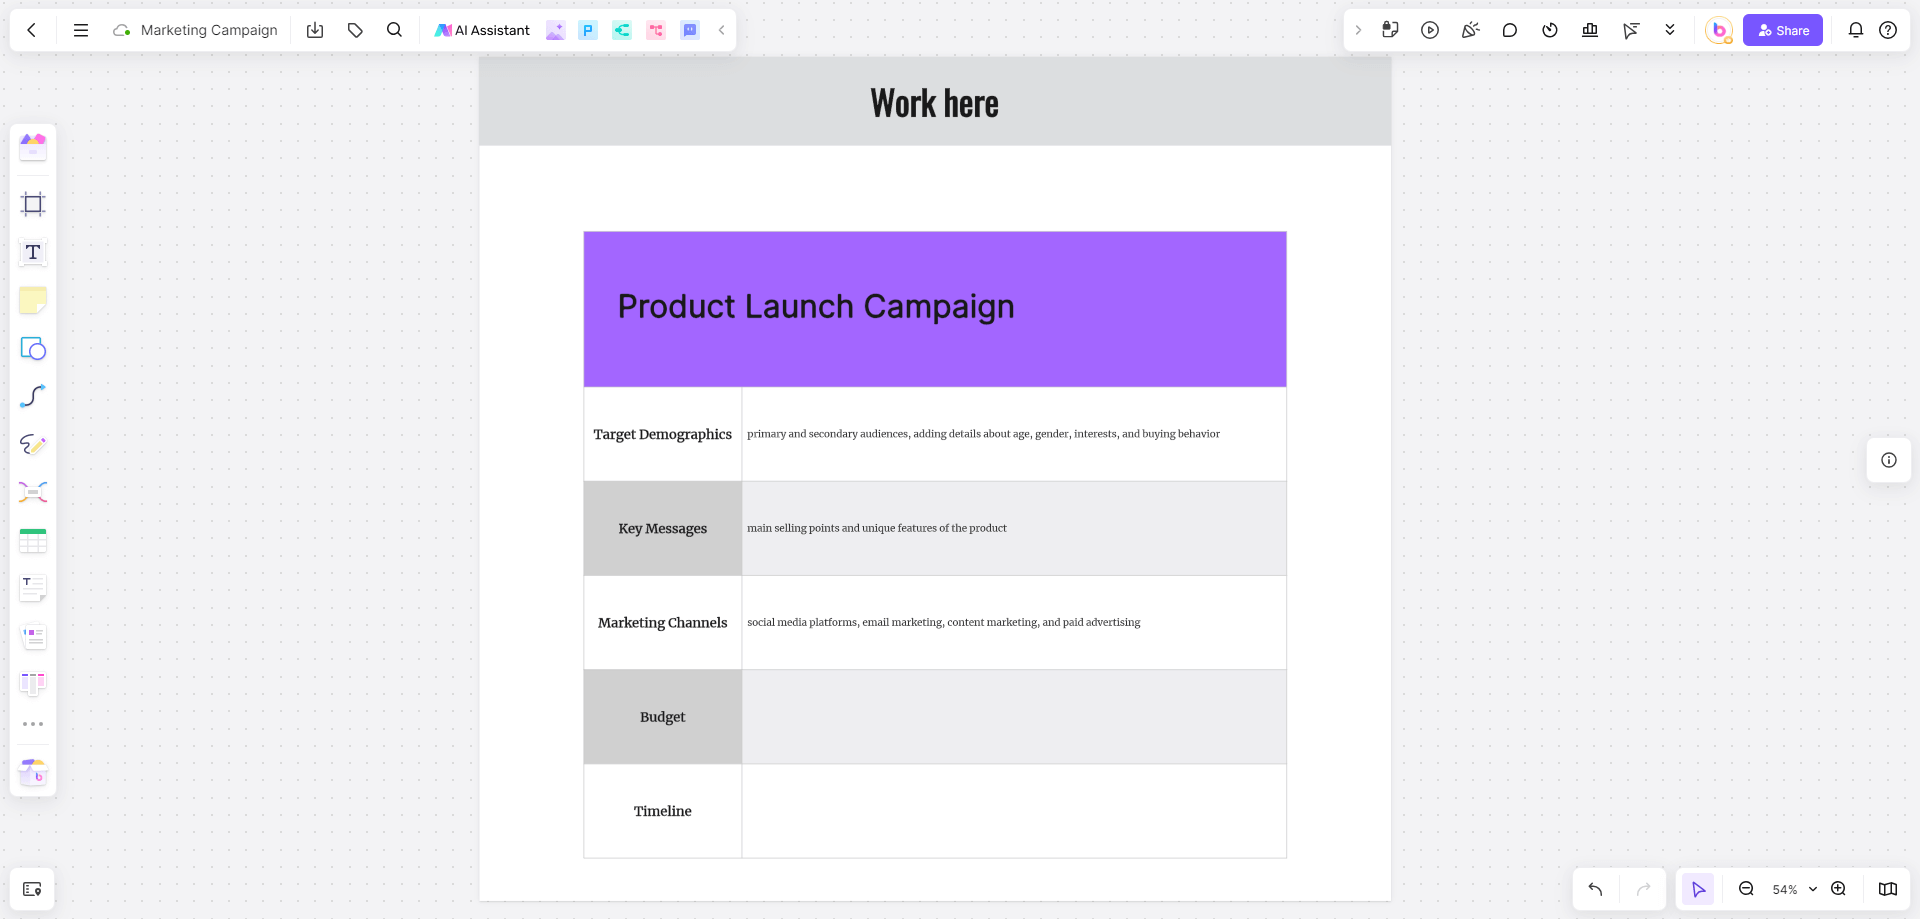
A marketing team at a mid-sized company used a web graphic organizer to plan a new campaign for a product launch. The team leader, Sarah, created a Marketing Campaign template labeled "Product Launch Campaign" in Boardmix. From this central idea, branches extended to key components such as "Target Demographics", "Key Messages", "Marketing Channels", "Budget", and "Timeline".
Under "Target Demographics", the team identified their primary and secondary audiences, adding details about age, gender, interests, and buying behavior. The "Key Messages" branch included the main selling points and unique features of the product. For "Marketing Channels", they listed social media platforms, email marketing, content marketing, and paid advertising.
The visual plan helped the team ensure all aspects of the campaign were covered. It allowed them to easily adjust strategies and reallocate resources as needed. The graphic organizer also made it simpler to present the plan to stakeholders, providing a clear and comprehensive overview of the campaign.
Case Study 2: Product Development
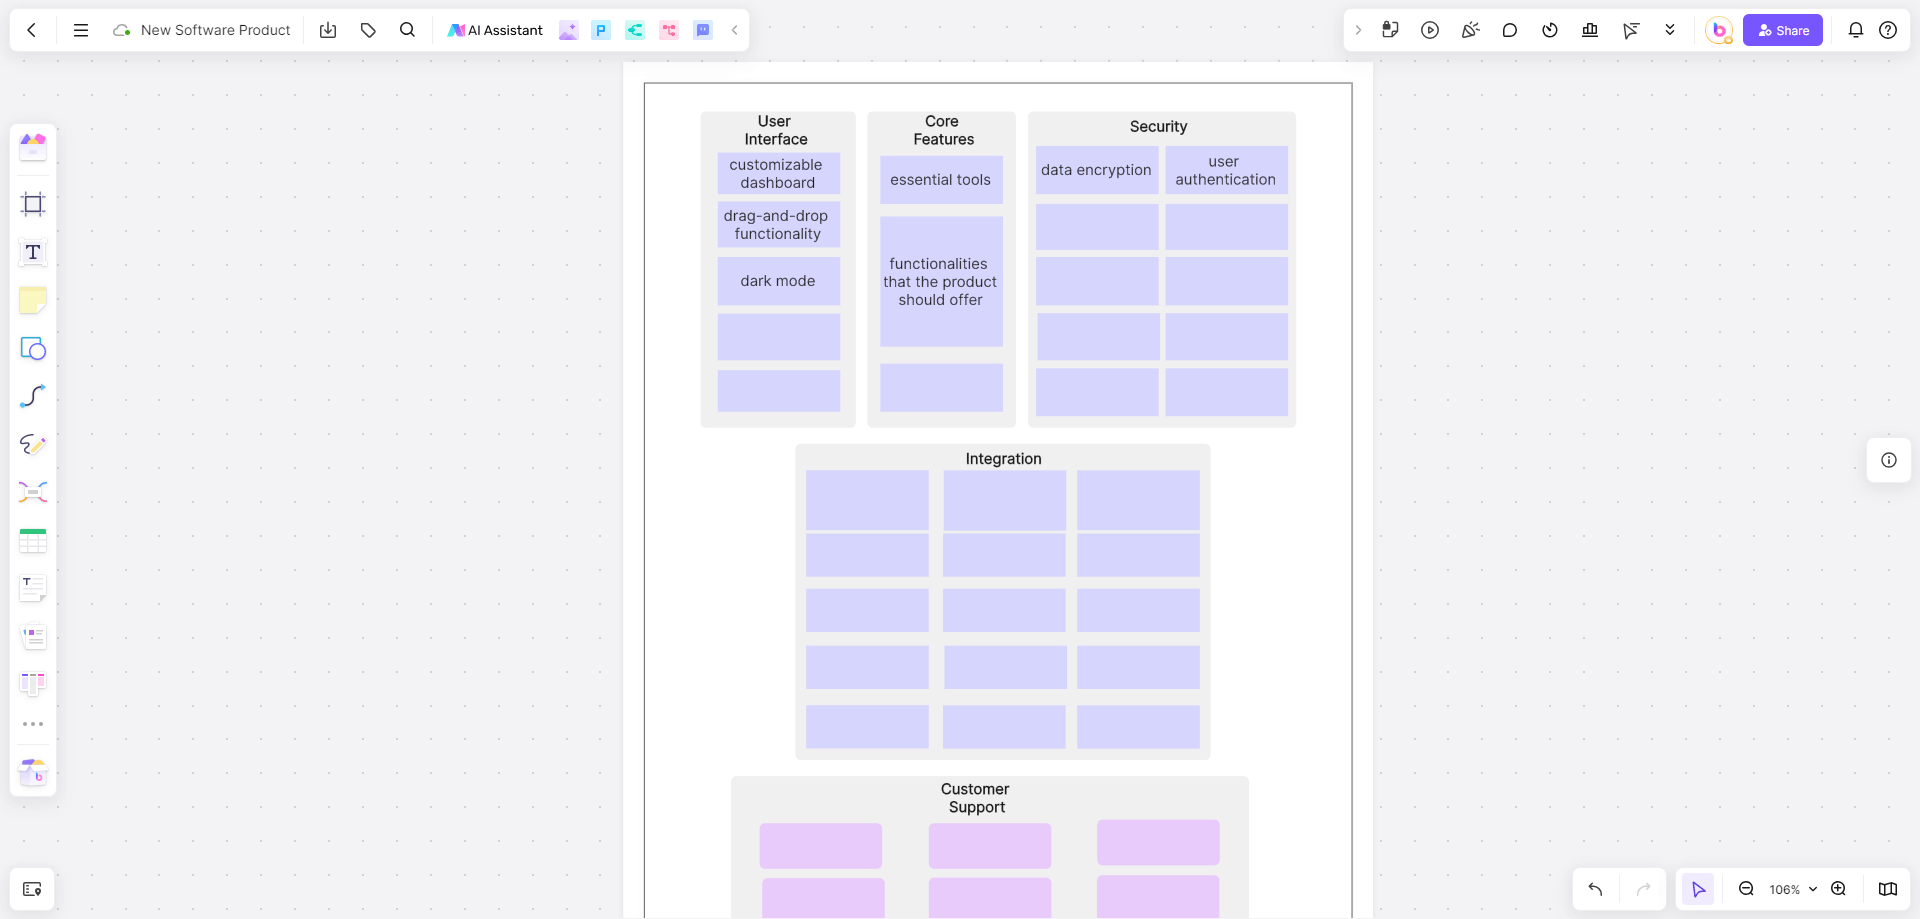
A product development team at a tech company used a web graphic organizer to brainstorm features for a new software product. The team lead, Mark, started by creating a Product Development template labeled "New Software Product" in Boardmix. Branches extended to categories like "User Interface", "Core Features", "Security", "Integration", and "Customer Support".
Within each category, team members added ideas and suggestions. For instance, under "User Interface", they listed features like a customizable dashboard, drag-and-drop functionality, and dark mode. The "Core Features" branch included essential tools and functionalities that the product should offer. "Security" covered aspects like data encryption and user authentication.
The team used different colors to prioritize features based on feasibility and potential impact. This helped them focus on the most promising ideas and streamline the development process. The web graphic organizer provided a clear roadmap for the project and facilitated better communication among team members.
How Graphic Organizers Can Enhance Learning and Project Management
Visual Learning
Concept Maps: These help visual learners by illustrating relationships between ideas, showing how different concepts are interconnected.
Mind Maps: Perfect for brainstorming, they allow users to visually explore ideas and connections, making information more accessible.
Organization
Flowcharts: Ideal for outlining processes, they help organize complex sequences of events or steps in a clear and linear fashion.
Venn Diagrams: Useful for comparing and contrasting information, they help organize similarities and differences between two or more concepts.
Collaboration
Brainstorming Maps: Facilitate group brainstorming sessions by providing a shared visual workspace where all participants can contribute and see each other's ideas.
Project Maps: Allow team members to collaborate on project planning, visualizing tasks, deadlines, and responsibilities in a comprehensive manner.
Critical Thinking
Cause and Effect Diagrams: Encourage critical thinking by helping users analyze the causes of an event and its possible effects.
SWOT Analysis: Helps users critically evaluate strengths, weaknesses, opportunities, and threats related to a specific project or decision.
Project Management
Gantt Charts: Aid in project management by visually mapping out timelines, tasks, and milestones, ensuring that projects stay on track.
Kanban Boards: Help manage workflow by providing a visual representation of tasks in different stages of completion, promoting efficiency and accountability.
Enhanced Functionality of Different Graphic Organizer Templates
In conclusion, web graphic organizers are versatile tools that can significantly enhance both learning and project management. Whether you’re an educator looking to engage your students or a business professional aiming to streamline your workflow, graphic organizer templates can provide the structure and clarity you need to succeed. Boardmix offers an excellent platform to create and customize these organizers, ensuring they fit your specific needs and preferences.


