Understanding the flow on a graph is essential for visualizing complex systems, whether in project management, engineering, or data analysis. Imagine organizing a project workflow or optimizing a network system—having a well-structured flow graph can make these tasks more manageable.
This guide dives into the essentials of flow on a graph, explores its unique applications, and provides practical tips for creating your own flow graphs using modern drawing tools.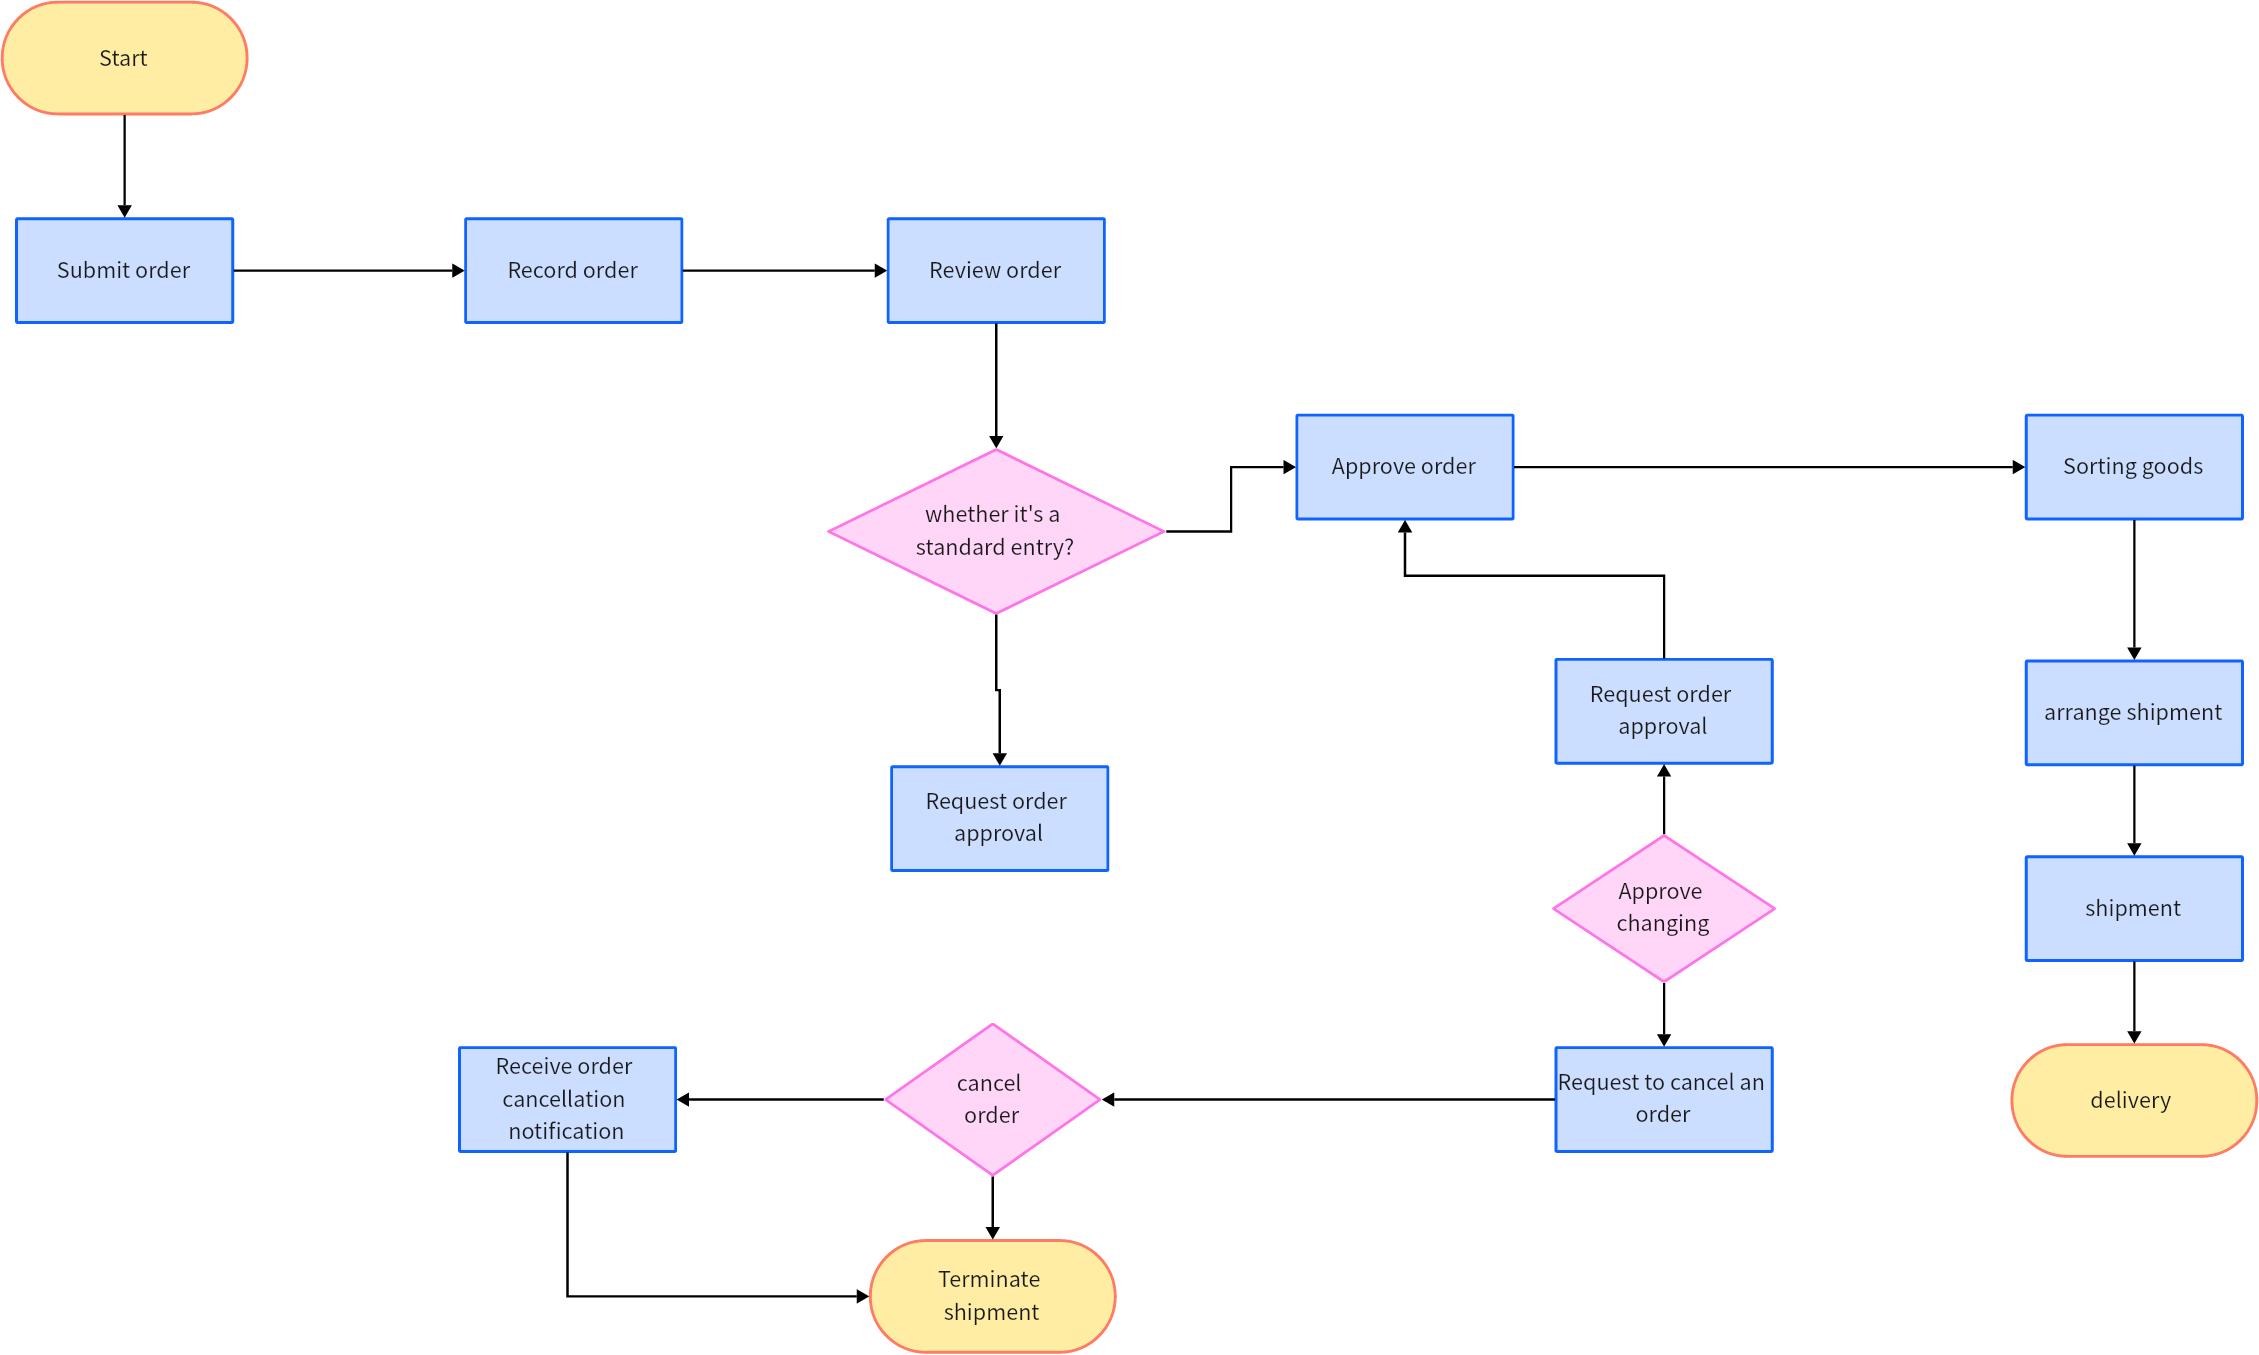
What is a Flow on Graph?
A flow graph, also known as a flow network, simplifies processes by mapping elements like tasks, relationships, or data transfers. The flow on graph is a visual representation used to illustrate processes, relationships, or data flow between components within a system. It is often employed in various fields such as software development, network design, project management, and business operations to map connections and identify inefficiencies.
Components of Flow Graphs
Flow graphs are composed of specific elements that work together to represent processes, relationships, and data movement clearly. Understanding these components is crucial for building effective flow graphs:
- Nodes (Vertices)
Nodes represent entities or components in the system. For example, in a project management flow graph, nodes might signify tasks, milestones, or team members. In a network graph, they could represent devices, servers, or locations. - Edges (Arrows)
Edges illustrate the connections or relationships between nodes. They show the direction of flow, whether it's data transfer, task dependencies, or resource allocation. In some cases, edges also have weights to represent quantities, such as cost, time, or capacity. - Source Node
The starting point of a flow graph, indicating where the process begins. For instance, in a logistics graph, the source could represent a warehouse or supplier. - Sink Node
The endpoint of a flow graph, signifying the destination of the flow. For example, in a delivery system, the sink could be the customer or final location. - Flow Values
These represent the quantity or capacity flowing through the edges, such as the amount of data, resources, or products moving from one node to another. - Loops and Cycles
In some graphs, loops (connections from a node to itself) or cycles (a sequence of nodes that leads back to the starting point) can occur, particularly in dynamic systems like feedback loops in software or manufacturing.
These components collectively provide a framework for visualizing and analyzing complex systems. By leveraging Boardmix, users can incorporate these elements seamlessly into their flow graphs, ensuring clarity and precision.
Benefits of Flow on Graph:
- Clarity: Simplifies complex systems into easy-to-follow visuals.
- Efficiency: Highlights bottlenecks or redundancies in processes.
- Collaboration: Helps teams and stakeholders align on workflows.
- Decision-Making: Provides data-driven insights for better strategies.
Why and When to Use a Flow on Graph:
Use a flow on graph when you need to visualize:
- Software architecture or algorithms.
- Data flow in networks or databases.
- Processes like supply chain management or customer journeys.
- Problem-solving scenarios requiring step-by-step clarity.
What is the Difference Between a Flowchart and a Flow Graph?
While flowcharts and flow graphs are both tools for visualization, they serve different purposes:
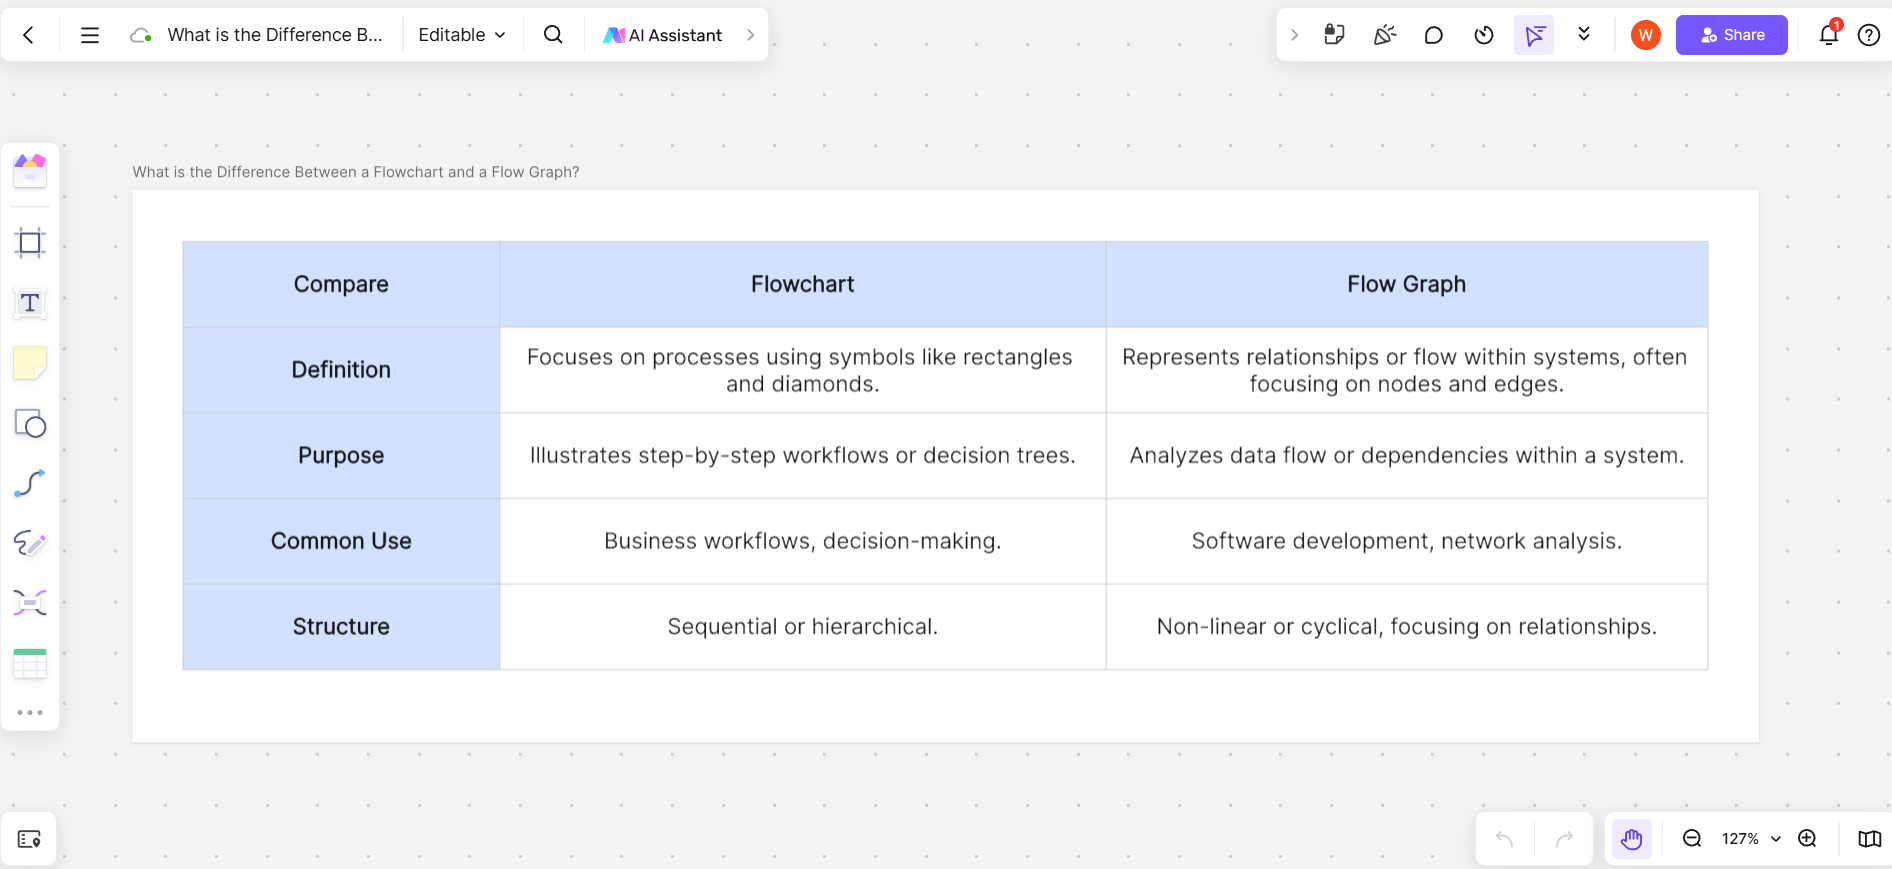
In short, a flowchart focuses on processes, while a flow graph digs deeper into system dependencies and relationships.
What is the Best Tool to Make Graphic Flow Charts?
Choosing the right tool for creating flow charts depends on your needs for collaboration, ease of use, and advanced features. Here are five popular options:
Boardmix Whiteboard

Boardmix Whiteboard combines an intuitive interface with advanced features, making it a top choice for creating flow graphs and charts. Its real-time collaboration capabilities allow teams to work together seamlessly, while a wide range of customizable templates and an extensive graphics library make designing professional flow diagrams effortless. Additionally, Boardmix offers cloud storage for easy access and sharing, ensuring teams can collaborate anytime and anywhere.
Lucidchart
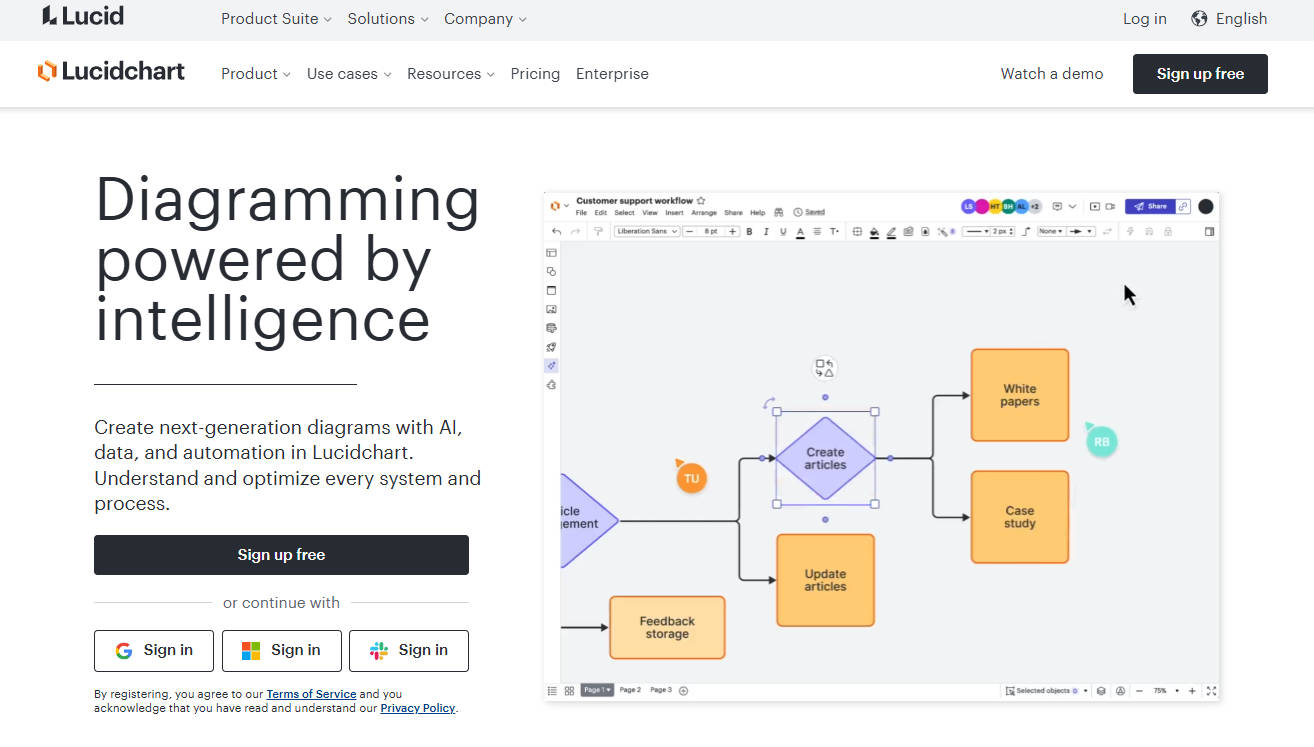
Lucidchart is known for its user-friendly design and broad platform compatibility, making it ideal for process mapping and team collaboration. It enables users to create clean and simple flowcharts without much complexity, making it a popular choice for organizations looking for an easy-to-use tool to streamline workflows and visualize ideas efficiently.
Microsoft Visio
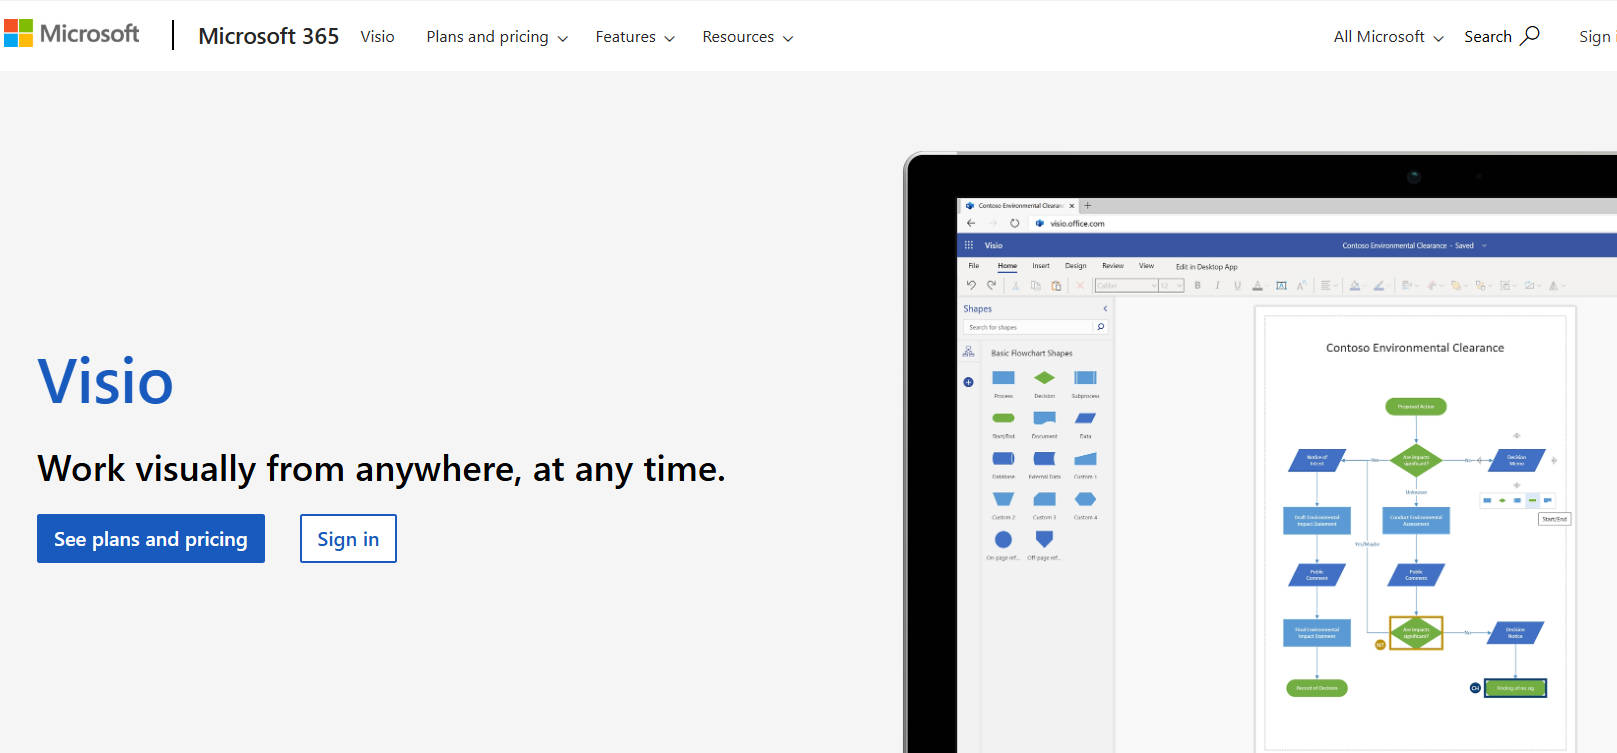
Microsoft Visio is a comprehensive diagramming tool tailored for enterprise-level projects. It offers advanced features for creating highly detailed and technical flow diagrams. While it provides a powerful solution for businesses, its steep learning curve and complexity may require time to master, especially for beginners or teams unfamiliar with intricate diagramming tools.
Draw.io
Draw.io is an open-source solution perfect for individuals or budget-conscious teams. Its straightforward interface and offline functionality make it particularly useful for small-scale projects or those who require a no-cost solution without compromising essential diagramming capabilities.
Canva

Canva is a design-focused tool that excels in creating visually appealing, presentation-ready flowcharts. With a variety of pre-designed templates, drag-and-drop elements, and customization options, Canva is ideal for users who prioritize aesthetics and need to create polished charts for presentations, reports, or marketing materials.
Each tool offers unique strengths and they are good for creating and managing flow diagrams efficiently.
How Boardmix Empowers the Creation of Graphic Flow Charts
Boardmix is a versatile online whiteboard and diagramming platform, offering features that make it a standout tool for creating graphic flow charts. Whether you're managing a business process, planning a project, or designing a system architecture, Boardmix simplifies the task with its comprehensive tools and seamless collaboration features.
Core Features of Boardmix for Graphic Flow Charts
- Extensive Shape Library
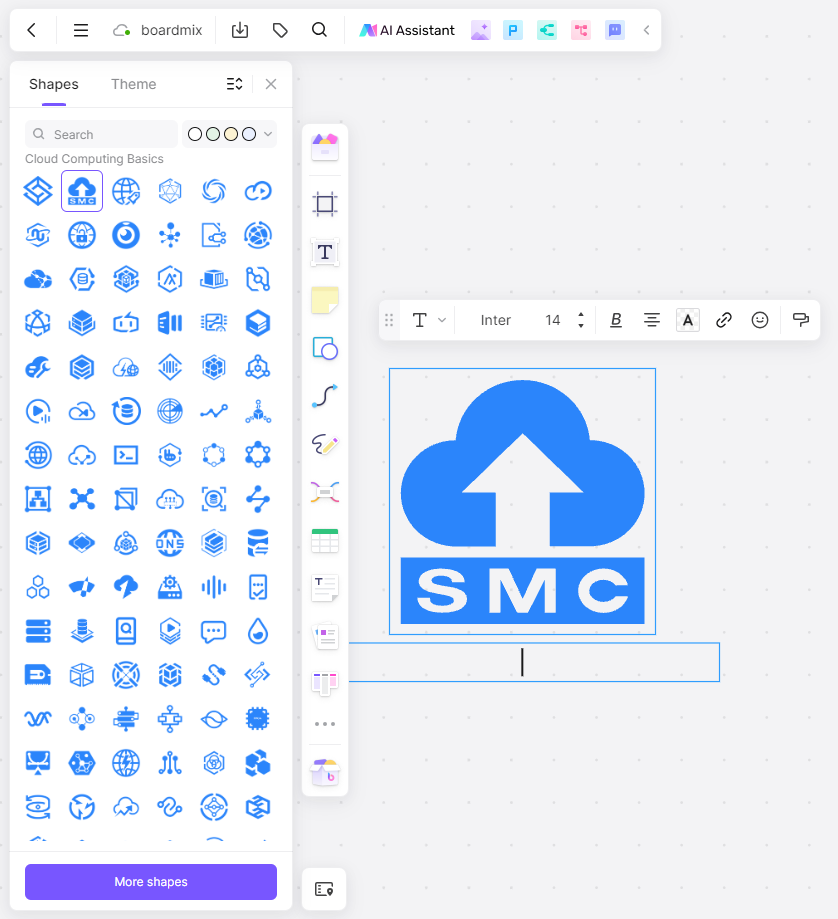
Boardmix provides access to thousands of shapes, covering everything from basic geometric forms to specialized symbols for:
- UML diagrams
- BPMN workflows
- Data flow diagrams
- Entity-relationship models
- Cloud infrastructure designs (e.g., AWS, Alibaba Cloud, Microsoft Azure).
Users can also customize color themes to match branding or enhance readability.
- Drag-and-Drop Simplicity
The intuitive drag-and-drop interface ensures that even beginners can design flow charts quickly and efficiently.
- Easily add, rearrange, or delete nodes.
- Connect components with customizable lines for clarity.
- Real-Time Collaboration

- Boardmix enables teams to collaborate seamlessly, no matter their location.
- Multiple users can edit the same chart simultaneously.
- Add comments or use reaction emojis to provide feedback without disrupting the design process.
- Infinite Canvas
The unlimited whiteboard space allows for the creation of complex flow charts without worrying about running out of room. This is ideal for detailed workflows, such as network topology diagrams or supply chain processes.
- AI Integration for Efficiency
As an AI-powered whiteboard, Boardmix streamlines flow chart creation by:
- Generating suggestions for workflows.
- Auto-completing repetitive tasks.
- Export and Share Options
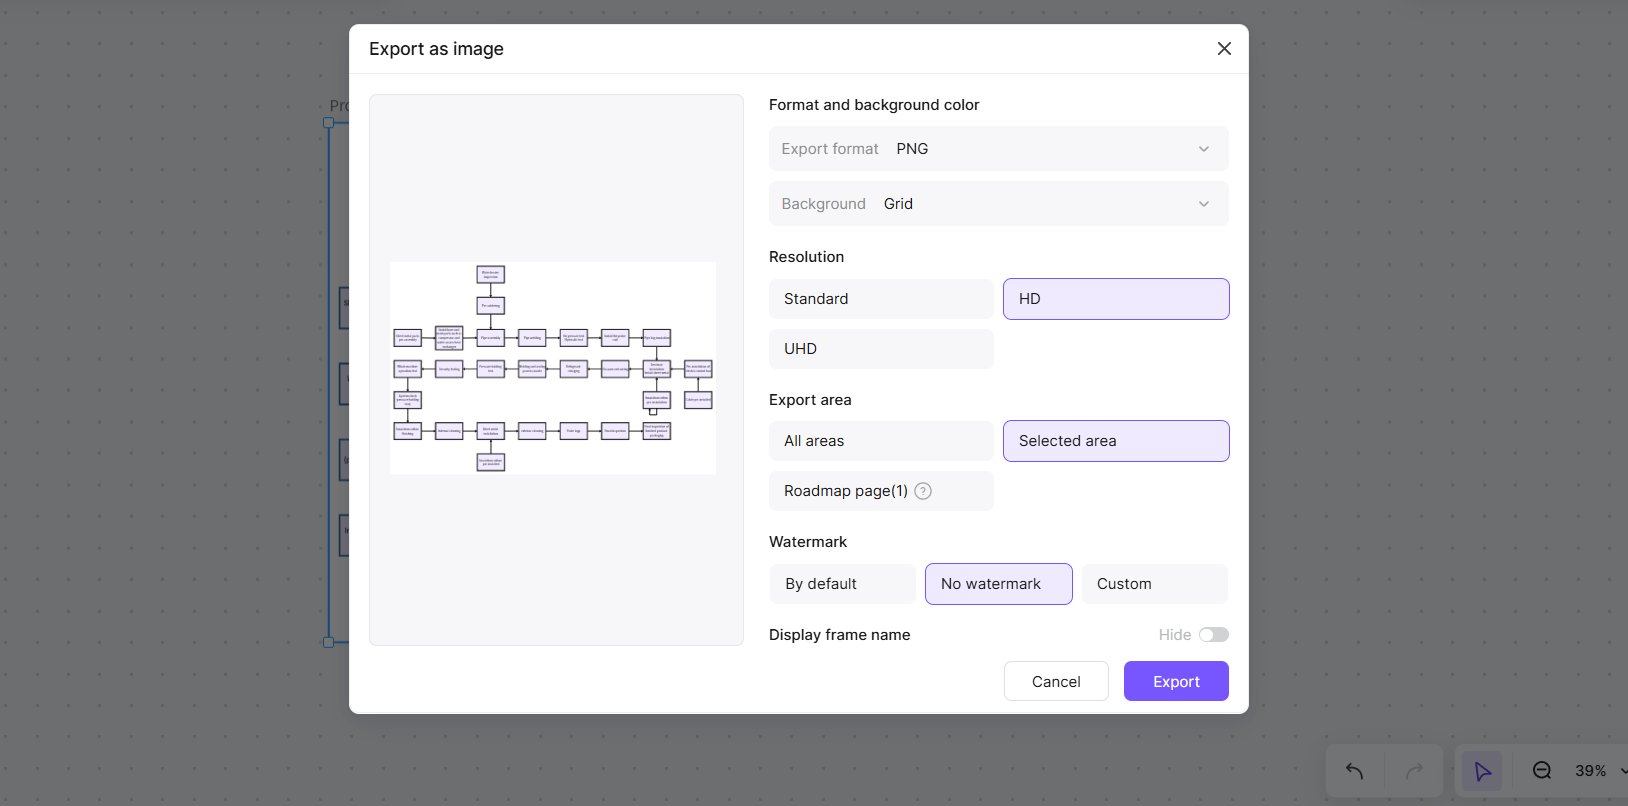
Once the flow chart is complete, users can export it in multiple formats, including:
- PDF for reports.
- PNG/JPG for presentations.
- SVG for high-quality vector graphics.
Additionally, charts can be embedded into external platforms or shared via a cloud-based link for easy access.
Step-by-Step Guide: Creating a Flow Graph on Boardmix
Step1 Start with a Template or Blank Canvas

Log into Boardmix, browse its library of flow chart templates, or choose a blank whiteboard for total creative freedom. Templates cater to various industries, from project management to education.
Step2 Add Shapes and Connectors
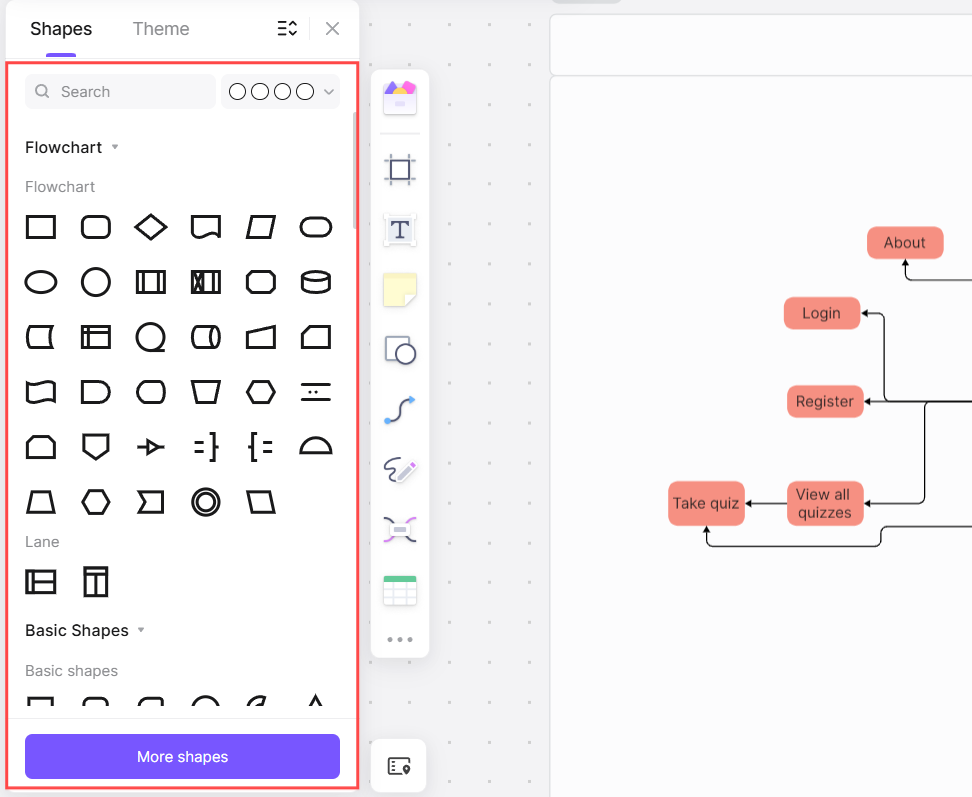
Begin by dragging shapes from the extensive shape library to represent nodes or processes. Connect these shapes with arrows to illustrate relationships. Use color-coded lines to distinguish between different pathways or priorities.
Step3 Customize the Layout
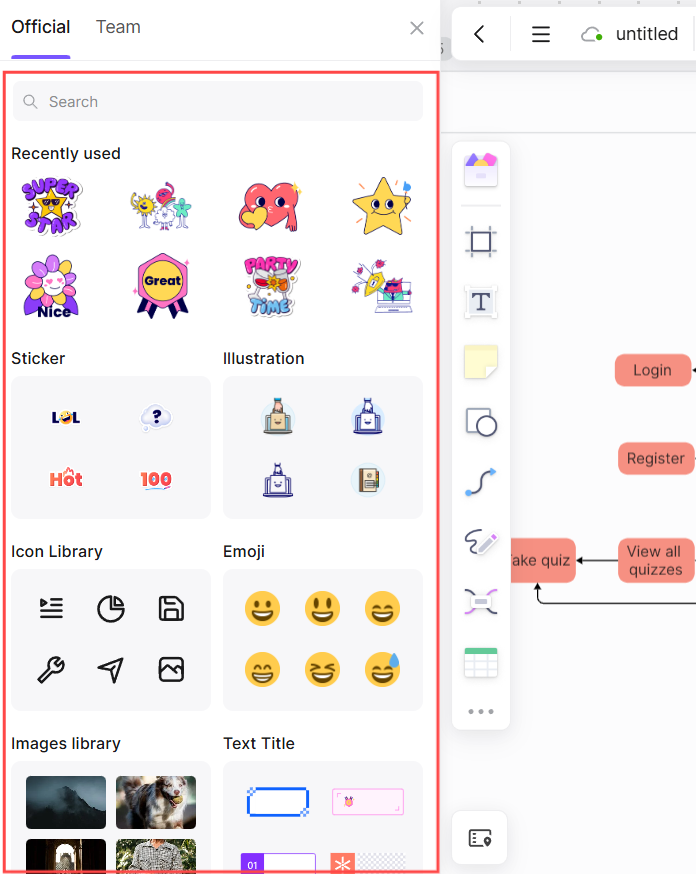
Enhance the chart’s clarity with:
- Color themes for grouping similar elements.
- Icons and labels for better understanding.
- Layers to manage complex workflows.
Step4 Collaborate and Finalize

Share the flow chart with team members using the real-time collaboration feature. Gather feedback via comments or video meetings integrated directly into Boardmix.
Step5 Export and Present
Once finalized, export the chart in your preferred format or use Boardmix’s presentation mode to display it directly to stakeholders.
Why Boardmix Stands Out for Graphic Flow Charts
Boardmix combines ease of use with powerful features, making it an ideal choice for individuals and teams.
- Integrated Resource Library: Stickers, icons, and illustrations enhance chart aesthetics.
- Cross-Platform Access: Design and review flow charts on desktops, tablets, or smartphones.
- Secure Cloud Storage: All projects are saved in the cloud with version history, allowing users to revert changes or restore previous designs.
For businesses, educators, and creatives, Boardmix is the perfect tool to turn abstract ideas into visually engaging and functional flow charts.
Exploring a Flow Graph Example: Process Flow Diagram
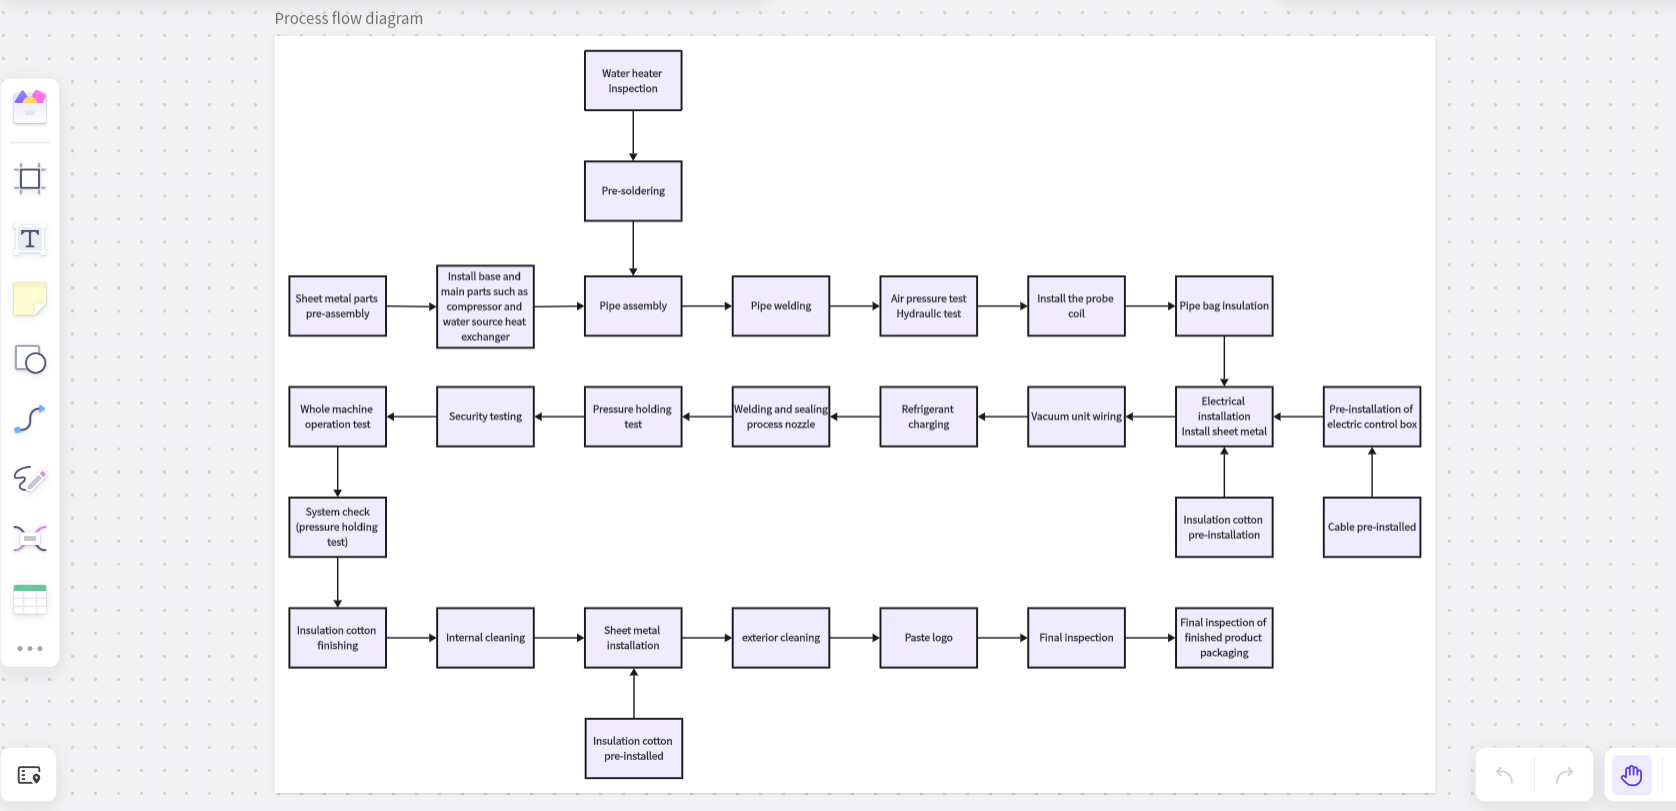
A process flow diagram is a common type of flow graph used to illustrate the step-by-step progression of a system or workflow. The diagram above represents a water heater manufacturing process and highlights each critical stage from inspection to final packaging.
Here’s a breakdown of key steps depicted in this flow graph:
- Initial Stages:
Water Heater Inspection and Pre-Soldering set the foundation for the process.
Sheet Metal Pre-Assembly and Installation of Main Parts ensure the physical components are ready.
- Assembly and Testing:
Processes like Pipe Assembly, Pipe Welding, and Air Pressure/Hydraulic Tests ensure functional integrity.
Quality is further enhanced through Pressure Holding Tests, Security Testing, and System Checks.
- Electrical and Insulation Work:
The flow graph shows steps like Electrical Installation, Insulation Cotton Pre-Installation, and Cable Pre-Installed, emphasizing the systematic approach to wiring and insulation.
- Final Stages:
Finishing touches such as Internal Cleaning, Sheet Metal Installation, Exterior Cleaning, and Logo Placement lead to the Final Inspection and Product Packaging.
This process flow diagram is a perfect example of how flow graphs simplify the visualization of complex workflows. Boardmix allows users to effortlessly create, customize, and collaborate on such diagrams.
Best Practices to Make a Flow on Graph
Creating an effective flow graph requires attention to detail and clarity. Keep these tips in mind:
- Define Objectives First: Be clear about the purpose of the graph.
- Keep It Simple: Avoid overcrowding the graph with unnecessary details.
- Use Consistent Symbols: Stick to a uniform design for nodes and arrows.
- Highlight Key Points: Use colors or shapes to emphasize critical paths or components.
- Iterate with Feedback: Share drafts with stakeholders to ensure alignment and accuracy.
Conclusion
Flow on graphs are powerful tools for visualizing relationships, processes, and systems across various fields. From business strategies to technical workflows, they bring clarity and collaboration to the forefront.
Among the available tools for diagramming, Boardmix Whiteboard shines for its ease of use, rich features, and collaborative capabilities. By incorporating customizable templates, real-time updates, and seamless sharing options, Boardmix helps teams create effective flow graphs effortlessly.
Start exploring Boardmix today to elevate your projects and transform ideas into actionable visuals.


