What is the BCG matrix?
The Boston Consulting Group Matrix (BCG Matrix) is also called Growth/Share Matrix. As the name suggests, it is a framework for portfolio management used to prioritize different products. It was popularized by the Boston Consulting Group in 1970 and is widely used for strategic planning and decision-making regarding investment in competitiveness and market attractiveness.
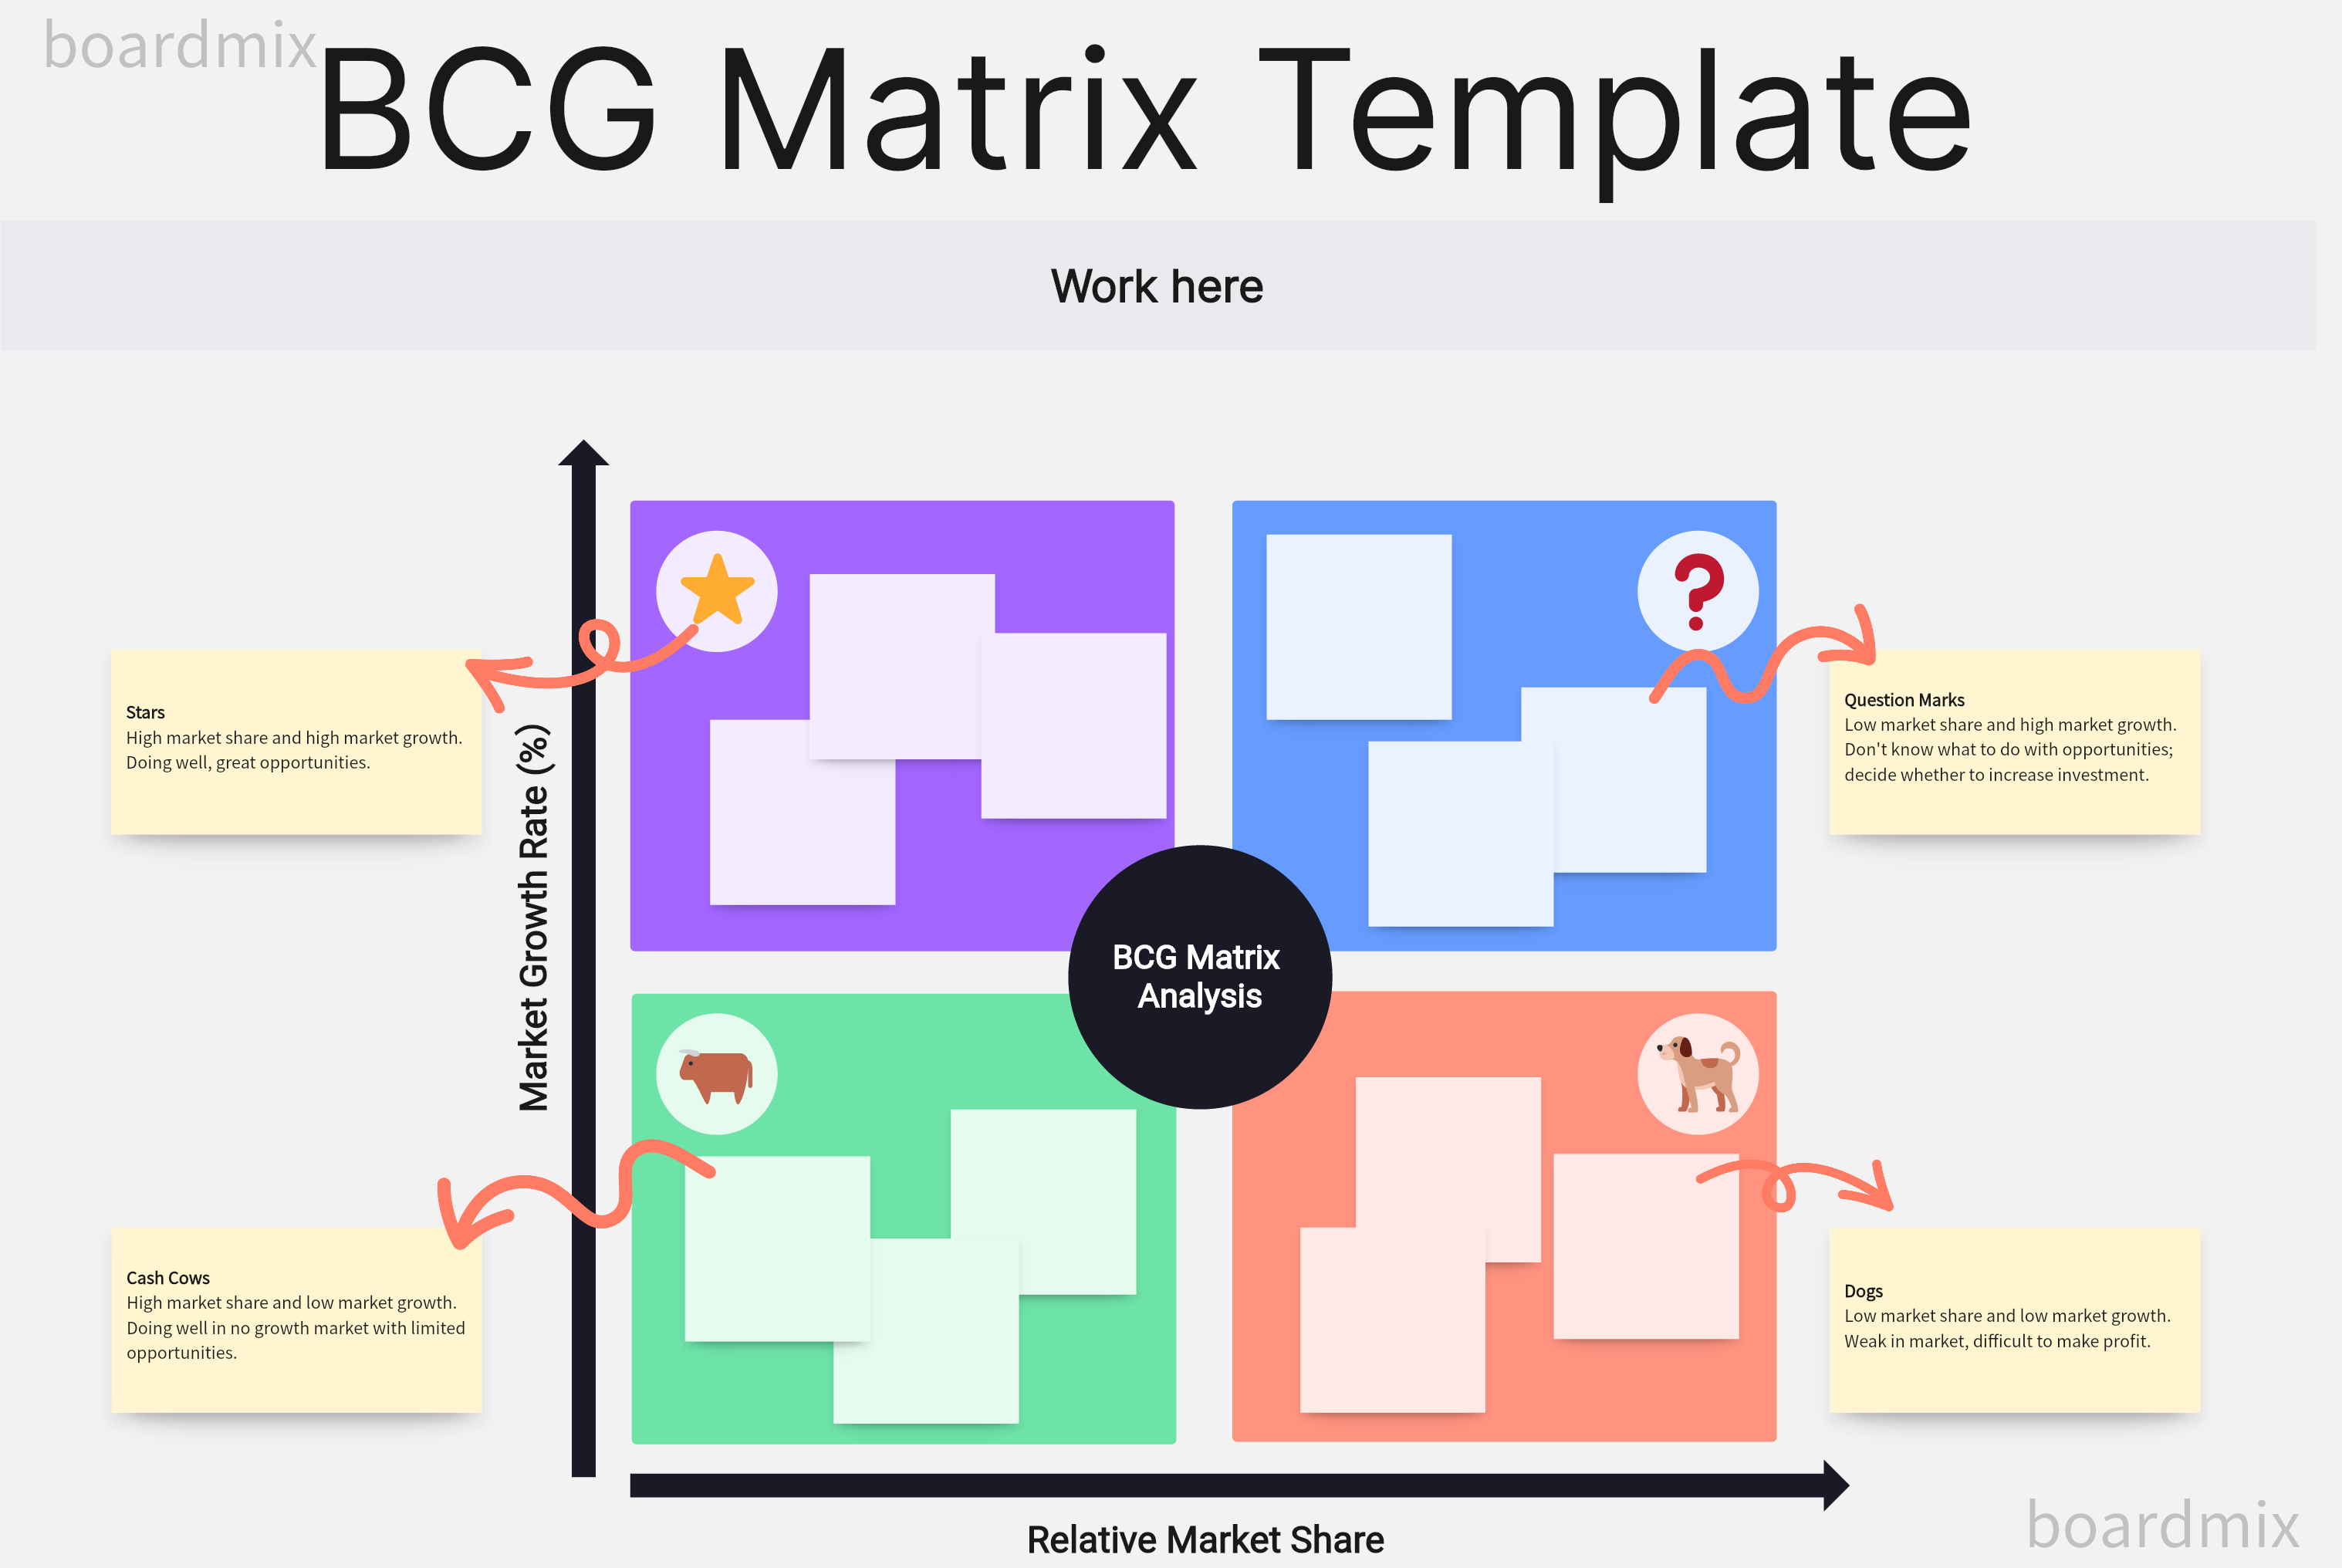

The BCG matrix categorizes products or business units into four quadrants based on their market growth and relative market share. These quadrants are: Stars, Cash Cows, Question Marks (or Problem Children), and Dogs.
1) Stars -- High Growth, High Market Share
Star businesses are leaders in the category. They have the potential to generate substantial returns and are considered strategic assets for the organization.
2) Cash Cows -- Low Growth, High Market Share
While Cash Cows operate in a matured market and may not have significant growth prospects, they generate stable and positive cash flow, contributing to the financial stability of the organization. Usually, these products finance other activities in progress (including stars and question marks).
3) Question Marks (or Problem Children) -- High Growth, Low Market Share
If relative market share increases while the market continues to grow quickly, a question mark can become a star. It may later become a cash cow as market growth slows, or a dog if both relative share and market growth are low.
4) Dogs -- Low Growth, Low Market Share
Dogs do not have strong prospects for growth or profitability and may drain resources from the organization. Businesses may consider divesting or discontinuing dogs if they are not strategically valuable.
How to Make a BCG Matrix Diagram?
The following shows the six basic processes of creating a BCG matrix diagram:
Step 1: Identify your products or business units
BCG matrix can be used to analyze Business Units, separate brands, products, or a firm as a unit itself. The choice of the unit impacts the whole analysis. So be careful to determine the products or business units that you want to analyze and classify.
Step 2: Define the market
An incorrectly defined market can lead to a poor classification of products. For example, Mercedes-Benz can have a different relative share in the overall passenger vehicle market and the luxury car segment. Market growth must also be measured before assigning either quadrant.
Step 3: Calculate the relative market share
This can be calculated by dividing the company’s market share by the market share of the largest competitor in that particular market. Use consistent thresholds to distinguish high from low relative market share.
Relative Market Share = Product’s sales this year/Leading rival’s sales this year
Step 4: Find out the market growth rate
This can be done by analyzing industry data, market research, or internal sales data. Use total sales for the defined market; a leading firm’s revenue growth may differ from market growth. The market growth rate is usually given by:
(Total market sales this year − Total market sales last year) / Total market sales last year × 100%
Step 5: Draw the circles on a matrix
Having calculated the above measures, now you need to just plot the brands on the matrix. The x-axis shows the relative market share, and the y-axis shows the industry growth rate. You can plot a circle for each unit/brand/product, the size of which should ideally correspond to the proportion of revenue generated by it.
Step 6: Analyze and regularly update
Analyze the positioning of each product or business unit on the matrix. Develop appropriate strategies for each quadrant. Also, remember to regularly update and review the matrix to reflect changes in market conditions, performance, and strategies.
15 Illustrative BCG Matrix Examples
BCG Matrix for Coca-Cola
1) Stars: Kinley and Dasani
Kinley and Dasani illustrate the star quadrant here. A real classification needs relative share and growth data for a specific bottled-water market and year.
2) Question marks: Diet Coke, Minute Maid, Honest Tea, Sparkling water
The diagram uses Diet Coke, Minute Maid, Honest Tea and sparkling water as historical question-mark examples. These are different beverage markets, and a question mark requires low relative share in a high-growth market. Coca-Cola’s acquisition of Honest Tea in 2011 provides historical context; it does not establish a current growth opportunity.
3) Cash Cows: Coke
Coke for years has been a market leader in the carbonated soft drink segment and a major cash generator for the company. However, demand for carbonated soft drinks is declining, fueling a growing demand for healthier options or low-calorie drinks like Diet Coke.
4) Dogs: Coke
The diagram repeats Coke in the cash-cow and dog quadrants. These are alternative scenarios, not simultaneous positions in the same market and period: a dog placement requires low relative share as well as low market growth.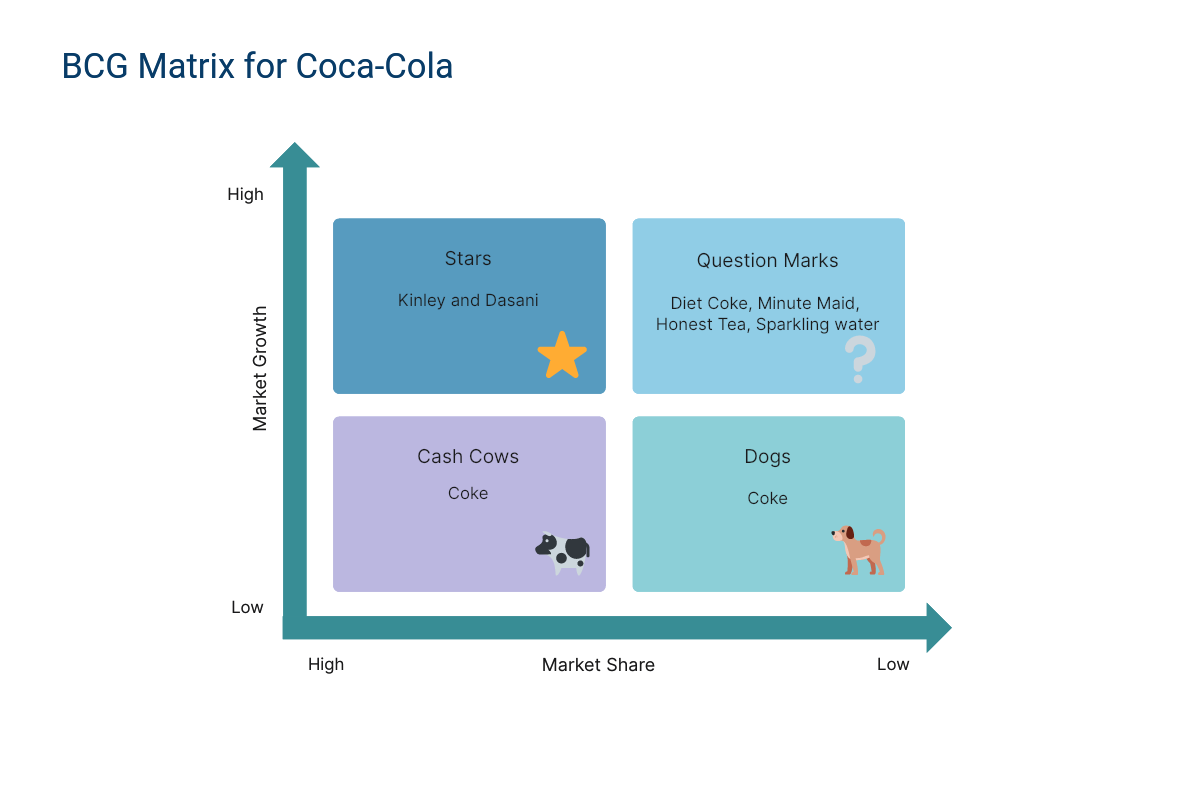
BCG Matrix for Apple
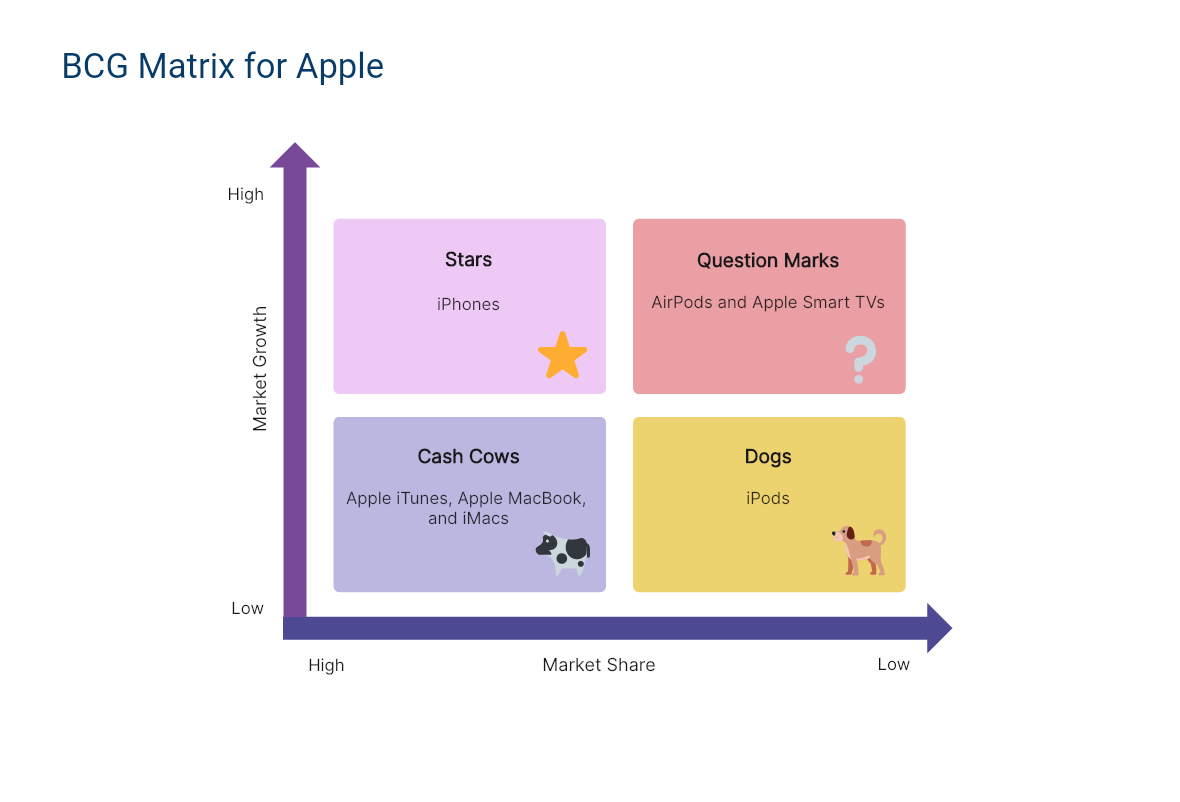
1) Stars: iPhones
Apple’s iPhones continue to generate excess profits, and the company dominates the growing smartphone market. Apple iPhones have a high stature because of their unique design and advanced technology. Also, the iPhone enjoys a loyal customer base that makes it beat all the competition in the booming mobile phone market.
2) Question marks: AirPods and Apple TV 4K (illustrative)
Apple’s AirPods are growing extremely quickly but have yet to dominate the market. The diagram’s “Apple Smart TVs” label is inaccurate: Apple TV 4K is a streaming device used with a separate TV. Its placement would need measured relative share and market growth.
3) Cash Cows: Apple iTunes, Apple MacBook, and iMacs
Once an innovative product, some products like Apple’s laptops are no longer in a fast-growing industry but generate healthy profits for the company. Over the years, these products have retained their market share and have increased cash flows for the company. Apple has a strong, loyal customer base that prefers Apple products exclusively.
4) Dogs: iPods
Apple’s iPods are considered dogs because they have lost their attraction due to high competition and low customer demand. Apple ended the iPod line in 2022, with iPod touch available while supplies lasted, so this is a historical example.
BCG Matrix for Amazon
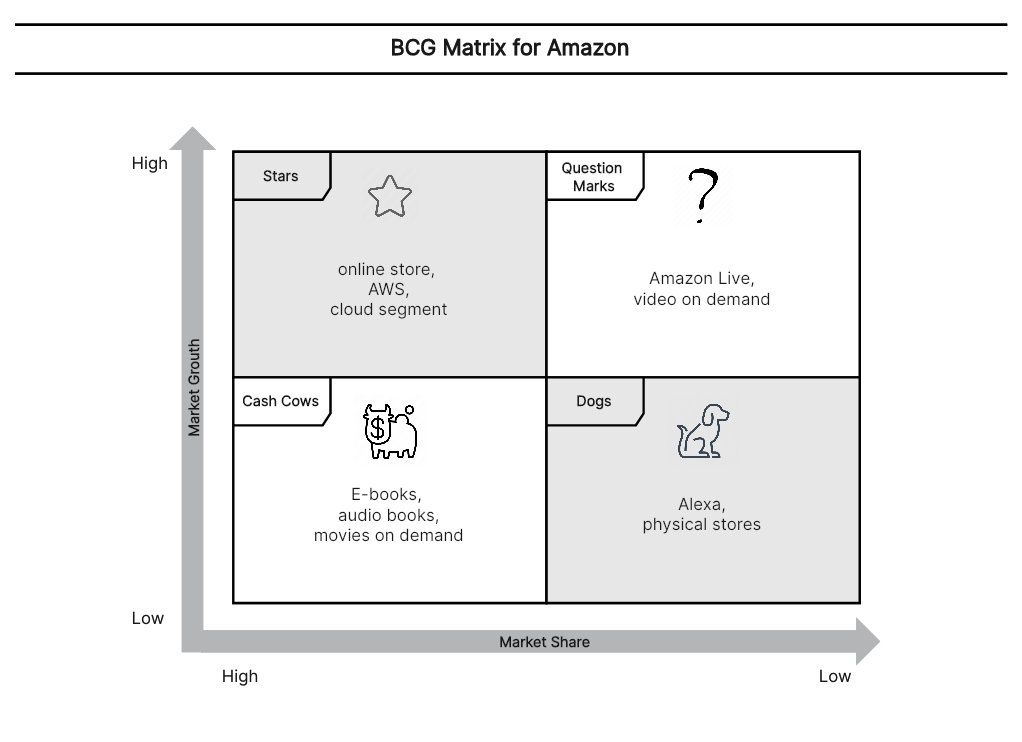
1) Stars: online store and AWS
Amazon’s claim to fame is definitely its online store called Amazon.com. It continues to generate great ROI with a high growth rate. Amazon’s AWS cloud business is also used as a star example, and the market is also becoming attractive.
2) Question marks: Amazon Live and video on demand
In the Amazon BCG matrix, video on demand and Amazon Live can become a question mark if they have low relative share in a high-growth market.
3) Cash Cows: E-books, audiobooks, and movies on demand
The E-books division is a lucrative cash cow for the company. Amazon has its native e-book reader called Kindle, and it has generated substantial ROI. Audiobooks and movies on demand also generate potential revenue and are in high demand from consumers.
4) Dogs: Alexa and physical stores
Physical stores and Alexa are shown as illustrative dog placements. These require evidence of low relative share in low-growth markets; the diagram does not supply comparable market data.
Reference: https://www.edrawmax.com/article/amazon-bcg-matrix-analysis.html
BCG Matrix for Samsung
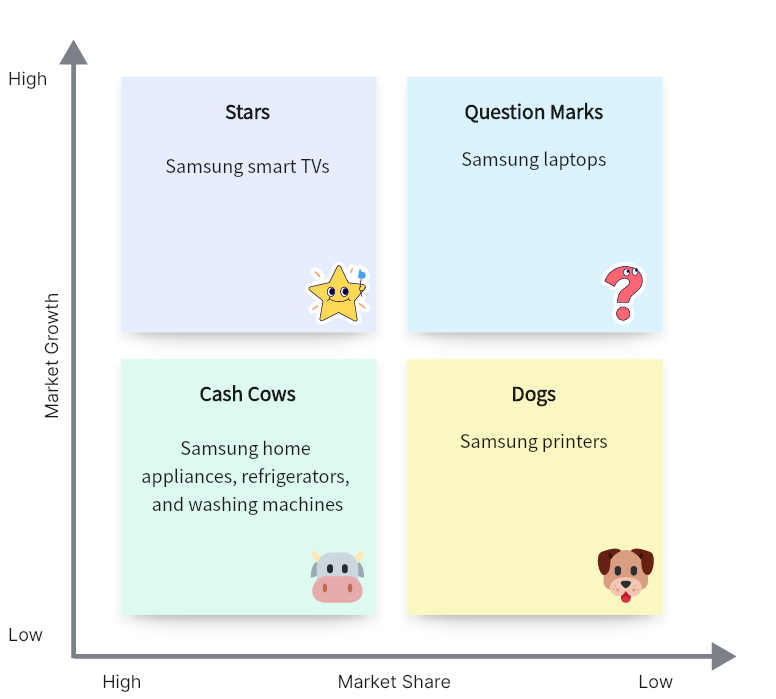
1) Stars: Samsung smart TVs
Samsung smart TVs are quite competitive in this industry, continuing to gain traction as consumers demand more smart products. Mobile phones from Samsung also fall into this quadrant because the industry is still evolving. It is an industry developing fast with newer advancements in mobile computing devices.
2) Question marks: Samsung laptops
Samsung laptops fall in the question mark quadrant, as an illustrative placement that requires low relative share and high market growth.
3) Cash Cows: Samsung home appliances, refrigerators, and washing machines
Samsung home appliances, refrigerators, and washing machines are the cash cows in its BCG matrix analysis, for they contribute to a significant share of the company’s revenue.
4) Dogs: Samsung printers
Samsung printers are a historical example: HP completed the acquisition of Samsung’s printer business on November 1, 2017. The sale alone does not establish a dog classification.
Reference: https://www.financefied.com/education/bcg-matrix-example/
BCG Matrix for Microsoft
1) Stars: Azure Cloud Platform, Microsoft Teams
Azure is Microsoft’s cloud computing platform that offers a wide range of services, which has experienced significant growth and has a strong market position.
Microsoft Teams is a collaboration and communication platform that has gained significant traction, especially with the rise of remote work and virtual meetings. Its high growth potential has made it a central product in Microsoft’s portfolio.
2) Cash Cows: Windows operating system, Microsoft Office Suite
Windows is Microsoft’s flagship operating system that powers a vast majority of personal computers worldwide. While the growth of the PC market has slowed down, it continues to generate substantial revenue and profit as a mature and established product.
The Office Suite is widely used in business, education, and personal settings. As a dominant and well-established product, it generates steady cash flow for Microsoft.
3) Question Marks: Surface hardware, Xbox gaming console
While the Surface lineup (laptops, tablets, and hybrid devices) has gained recognition for its design and innovation, it faces strong competition in the hardware market. These products have the potential for growth but require further investment and market share expansion.
Xbox is Microsoft’s gaming console brand. Born in the highly competitive gaming console market, Xbox faces challenges from competitors such as Sony’s PlayStation, which has restricted its growth potential.
4) Dogs: Windows Phone (discontinued)
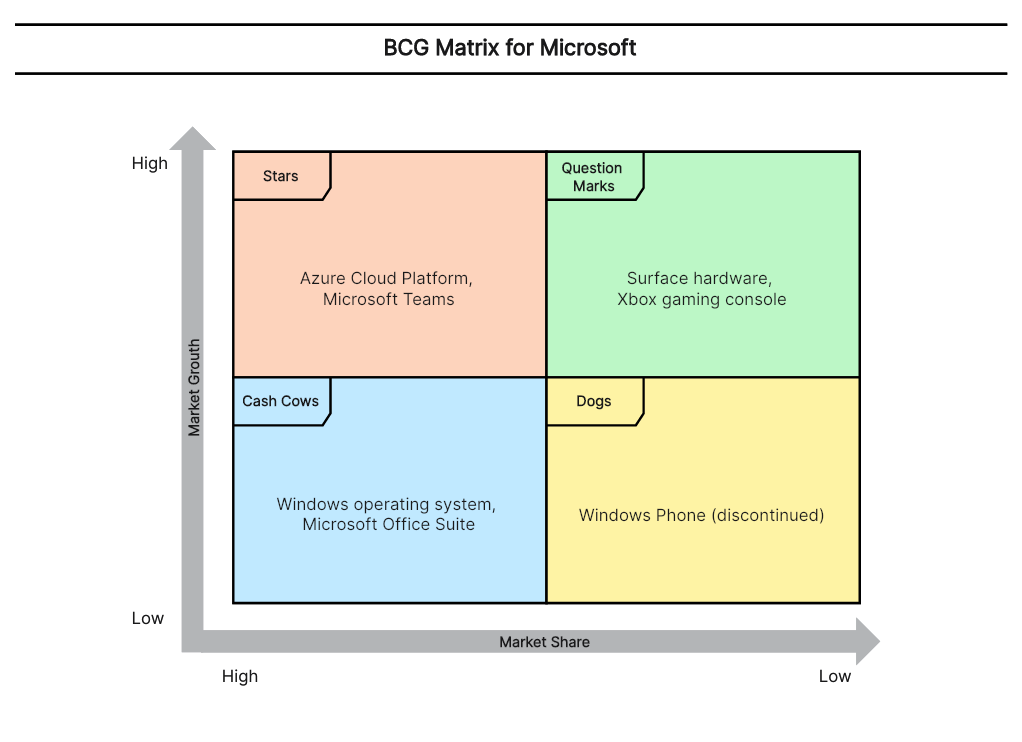
Microsoft discontinued its mobile hardware efforts, and the Windows Phone platform no longer receives active development or support.
BCG Matrix for Toyota
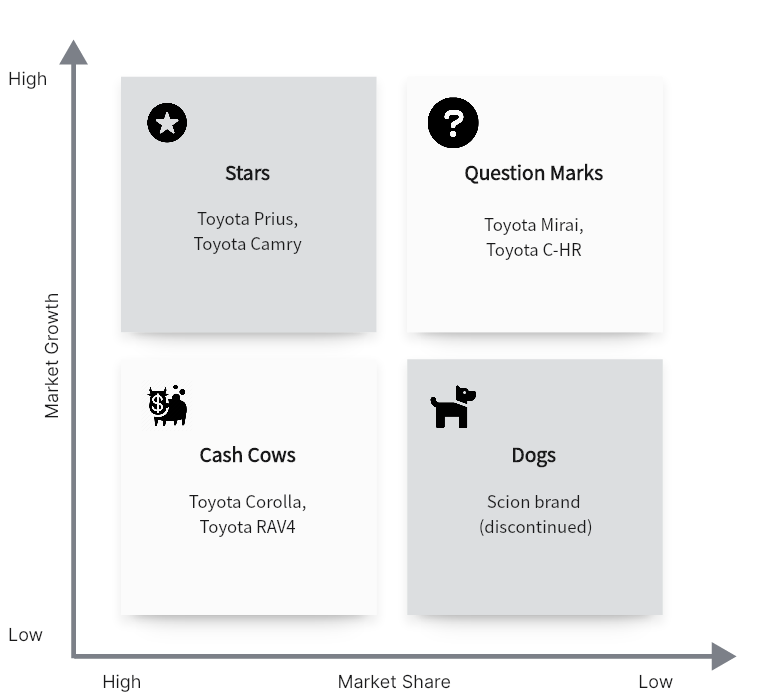
1) Stars: Toyota Prius (hybrid cars), Toyota Camry (midsize sedans)
The Prius, known for its fuel efficiency and environmentally friendly features, has enjoyed significant market growth and has established a strong market share in the hybrid car segment. Toyota Camry, a popular midsize sedan known for its reliability, comfort, and fuel efficiency, has consistently performed well in the market.
2) Cash Cows: Toyota Corolla (compact cars), Toyota RAV4 (compact SUVs)
The Corolla is one of the best-selling compact cars globally, while Toyota RAV4 is a compact SUV that has gained popularity for its versatility, practicality, and fuel efficiency. They both enjoy a well-established market share and generate substantial cash flow for Toyota.
3) Question Marks: Toyota Mirai (hydrogen fuel cell vehicles), Toyota C-HR (compact crossover)
While Toyota Mirai is a technologically advanced and environmentally friendly option, the market for hydrogen fuel cell vehicles is still in its early stages. Besides, Toyota C-HR has shown promise with a distinctive design. Still, it is not impressive enough in the highly competitive compact crossover segment.
4) Dogs: Scion brand (discontinued)
Scion was a brand owned by Toyota that targeted younger demographics with compact and sporty vehicles. However, due to various reasons, Toyota has abolished the Scion brand. It represents a low-growth, low-market-share product that no longer exists in Toyota’s portfolio.
BCG Matrix for Nike
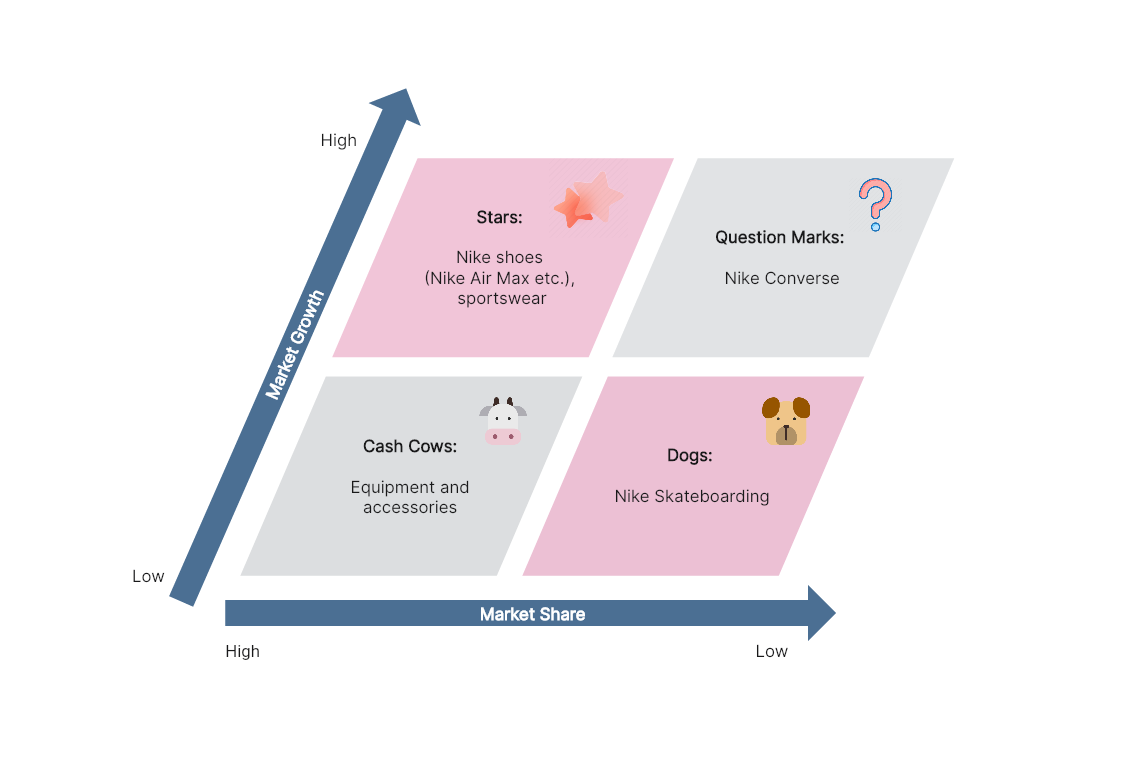
1) Stars: Nike shoes (Nike Air Max etc.), sportswear
Certainly, the leader of the Nike product portfolio is Nike shoes. However, due to the pandemic period, sportswear has become a star of the portfolio because there have been changes in the lifestyle of consumers.
2) Cash Cows: equipment and accessories
The equipment and accessories are Cash Cows for the Nike company. They generate cash to turn questioned products (dilemmas) into cash cows.
3) Question Marks: Nike Converse
The Nike Converse product category can be found in the dilemmas. If Nike adopts effective and specific strategies, this product can be converted into a cash cow.
4) Dogs: Nike Skateboarding
Nike Skateboarding products fall in the dogs quadrant since these offerings are not very popular among the skateboarding community. However, the company continues to produce skateboarding shoes and clothing despite a large number of competitors.
Reference: https://awware.co/blog/bcg-matrix/
https://www.researchgate.net/figure/BCG-Matrix-for-Nikes-Portfolio_fig2_351123152
BCG Matrix for Procter & Gamble (P&G)
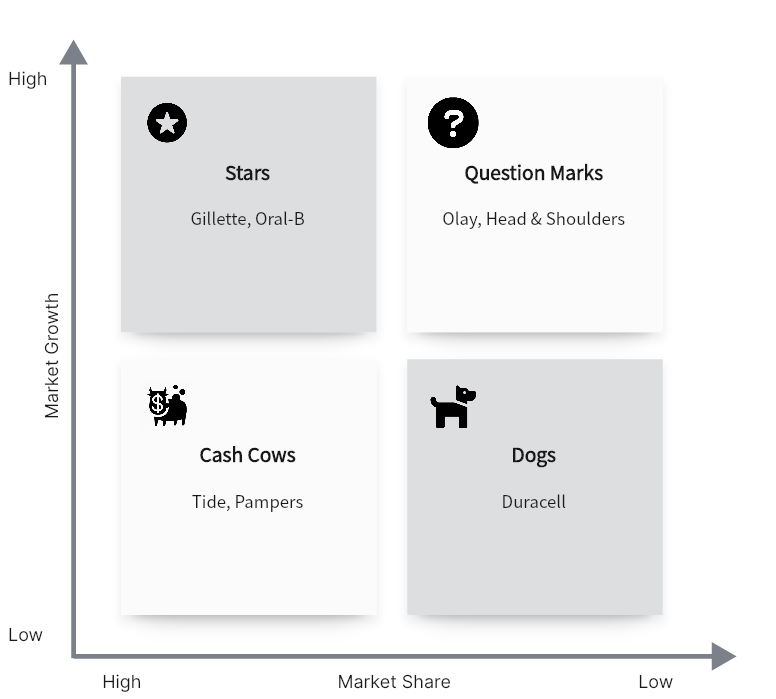
1) Stars: Gillette, Oral-B
Gillette is a well-established brand known for its shaving products, while Oral-B is a leading brand in the oral care market, specializing in toothbrushes and other dental products. They have experienced strong growth and have a significant market share.
2) Cash Cows: Tide, Pampers
Tide is one of P&G’s most successful brands, offering a wide range of laundry detergent products. Pampers is a leading brand in the baby care market, particularly known for its diapers. They enjoy a well-established market share and generate consistent cash flow for P&G.
3) Question Marks: Olay, Head & Shoulders
Olay is a skincare brand offering a variety of products, and Head & Shoulders is a popular brand in the hair care industry. While they have a strong presence, they face challenges in a competitive market.
4) Dogs: Duracell
Duracell is a historical P&G example: the company completed its transfer to Berkshire Hathaway on February 29, 2016. It is not part of P&G’s current portfolio.
BCG Matrix for Nestlé
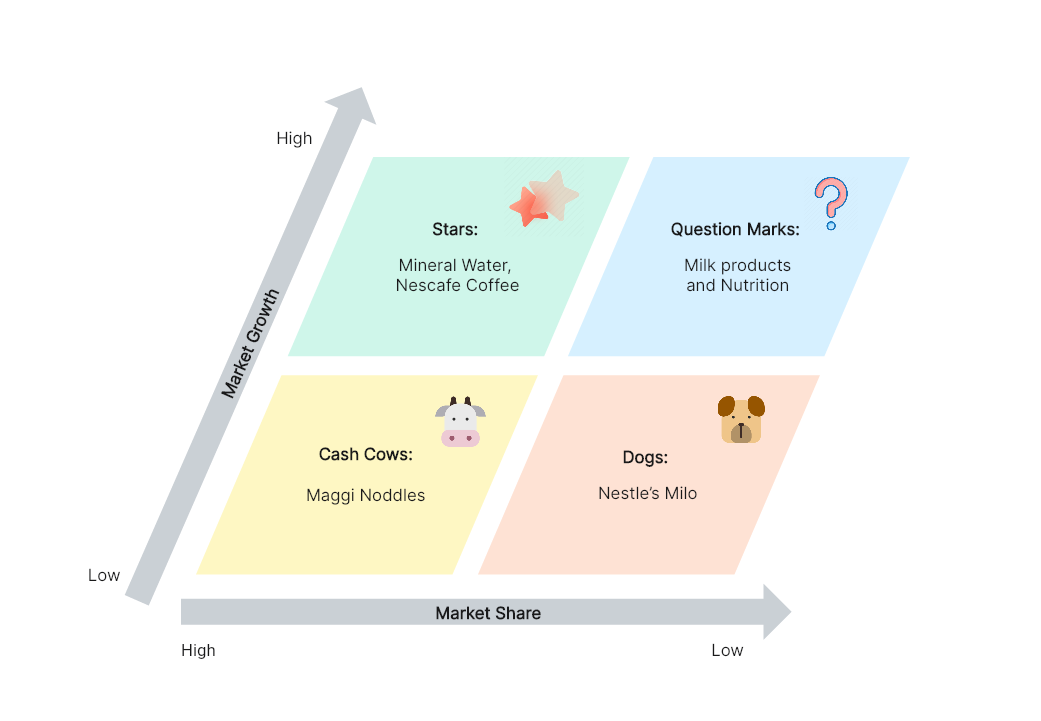
1) Stars: Mineral Water, Nescafe Coffee
Nestle’s Mineral Water and Nescafe Coffee (like Nescafe Latte) fall in the Star quadrant of the BCG Matrix of Nestle. With the growing number of health-conscious customers, these products have the potential to produce greater ROI later. Even though it might take heavy investment to make Nestle brand visible in that market, they may turn to cash cows in the short run.
2) Cash Cows: Nestle’s Maggi Noodles
Maggi Noodles is used as a cash-cow example. This placement requires high relative share in a low-growth noodle market; investment is still needed to maintain the business.
3) Question Marks: Milk products and Nutrition
Nestle Everyday, Nestlé Slim, and Nestlé Milk Maid are some of the milk and milk-based products from the house of Nestlé. Being in the phase of development, this domain needs a higher investment. And there is a high-risk decision to invest in them too.
4) Dogs: Nestle’s Milo
Nestle’s Milo was launched as chocolate and malt powder for milk and water; its placement as a dog would need evidence for a particular country and malted-drink market.
References: https://heartofcodes.com/bcg-matrix-of-nestle/
https://www.superheuristics.com/bcg-matrix-of-nestle-detailed/
BCG Matrix for PepsiCo
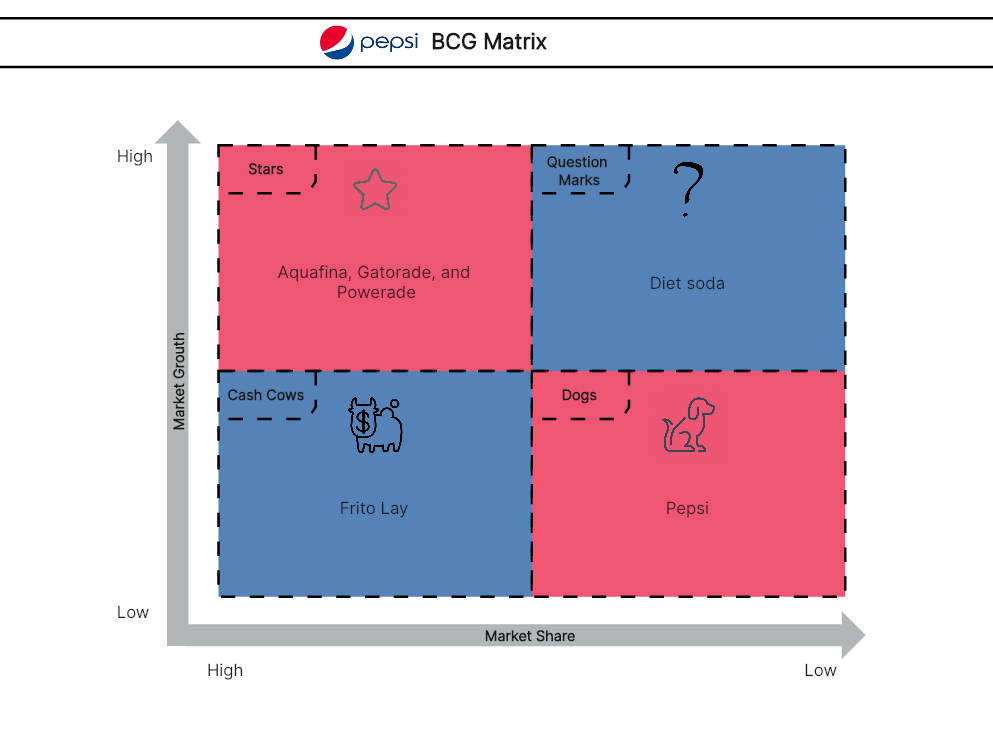
1) Stars: Aquafina and Gatorade
Aquafina is PepsiCo’s purified bottled-water brand. The trend for carbonated drinks has decreased significantly as consumers move away from sugar-laden sodas. Gatorade is a PepsiCo sports-drink brand. Powerade, included in the diagram, is owned by The Coca-Cola Company and should be excluded from PepsiCo’s portfolio. With rising health trends and emerging markets, the brand is investing huge amounts of money into healthier foods and beverages, making a bigger dent in the soft drink category.
2) Cash Cows: Frito Lay
Frito-Lay is PepsiCo’s snack business; Doritos and Tostitos are part of the same company’s portfolio, not independent competitors to it. A cash-cow placement depends on high relative share in a low-growth market and does not remove the need for investment.
3) Question Marks: Diet soda
Not many people associate the term “Diet soda” with PepsiCo. The company launched Diet Pepsi to take back a portion of the market share it had lost to Coca-Cola and recapture the consumers’ attention. Diet Pepsi competes with Coca-Cola’s Diet Coke; a question-mark classification needs a defined market and period.
4) Dogs: Pepsi
Pepsi is shown as a dog example, but a health trend alone cannot establish that position. Both low relative share and low growth in the selected soft-drink market would need to be demonstrated.
Reference: https://www.edrawmax.com/article/pepsi-bgc-matrix.html
BCG Matrix for Google
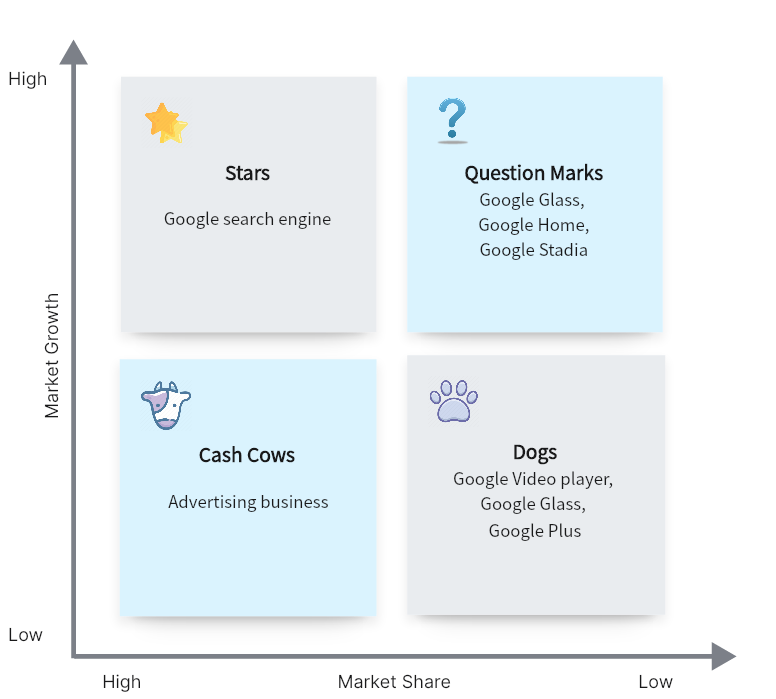
1) Stars: Google search engine
For Google, its star product would be its search engine, which is the company’s flagship product and has a dominant market position in the search engine industry.
2) Cash Cows: Advertising business
For Google, its cash cow product would be its advertising business, which is a major source of revenue for the company. The advertising business generates high revenue for the company but does not require much investment to maintain its market position.
3) Question Marks: Google Glass, Google Home, and Google Stadia
These are historical venture examples. Stadia shut down on January 18, 2023. Glass Enterprise Edition sales ended on March 15, 2023, and support ended on September 15, 2023. Neither is a current growth opportunity.
4) Dogs: Google Video Player, Google Glass, and Google Plus
The popularity of YouTube is part of the reason why Google video player failed to get income. Glass is repeated in two quadrants in the diagram; those positions cannot both describe the same market and period. Consumer Google+ shut down on April 2, 2019, so it is also a historical example.
Reference: https://heartofcodes.com/bcg-matrix-of-google/
BCG Matrix for General Electric (GE)
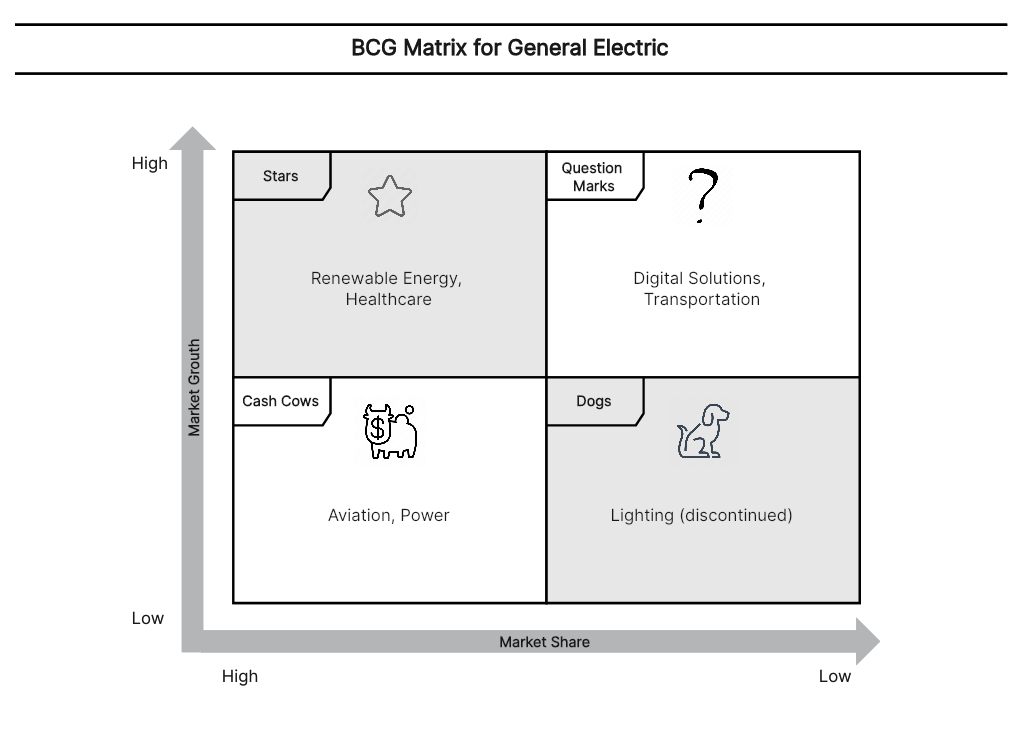
1) Stars: Renewable Energy, Healthcare
This is a historical GE portfolio example. GE HealthCare became a separate company in January 2023 and GE Vernova in April 2024; the remaining company operates as GE Aerospace. The diagram’s renewable-energy business belongs to that former group portfolio. With the increasing focus on clean energy and sustainability, this segment has experienced significant market growth and has established a strong market share. GE’s healthcare division includes medical equipment and solutions. Likewise, this segment has seen substantial growth due to the growing demand for advanced healthcare technologies and equipment.
2) Cash Cows: Aviation, Power
GE’s aviation business is known for its jet engines and related services. The aviation industry has a consistent demand for aircraft engines and maintenance services. The power division focuses on gas turbines and related products for power generation. This segment also has a strong market position and generates substantial cash flow for the company.
3) Question Marks: Digital Solutions, Transportation
GE’s digital solutions and transportation division have the potential for growth, while at the same time, they also face challenges in the competitive market.
4) Dogs: Lighting (discontinued)
GE had a lighting division that was involved in manufacturing and selling lighting products. However, the company decided to exit this business, and it is no longer a part of GE’s portfolio.
BCG Matrix for Tesla
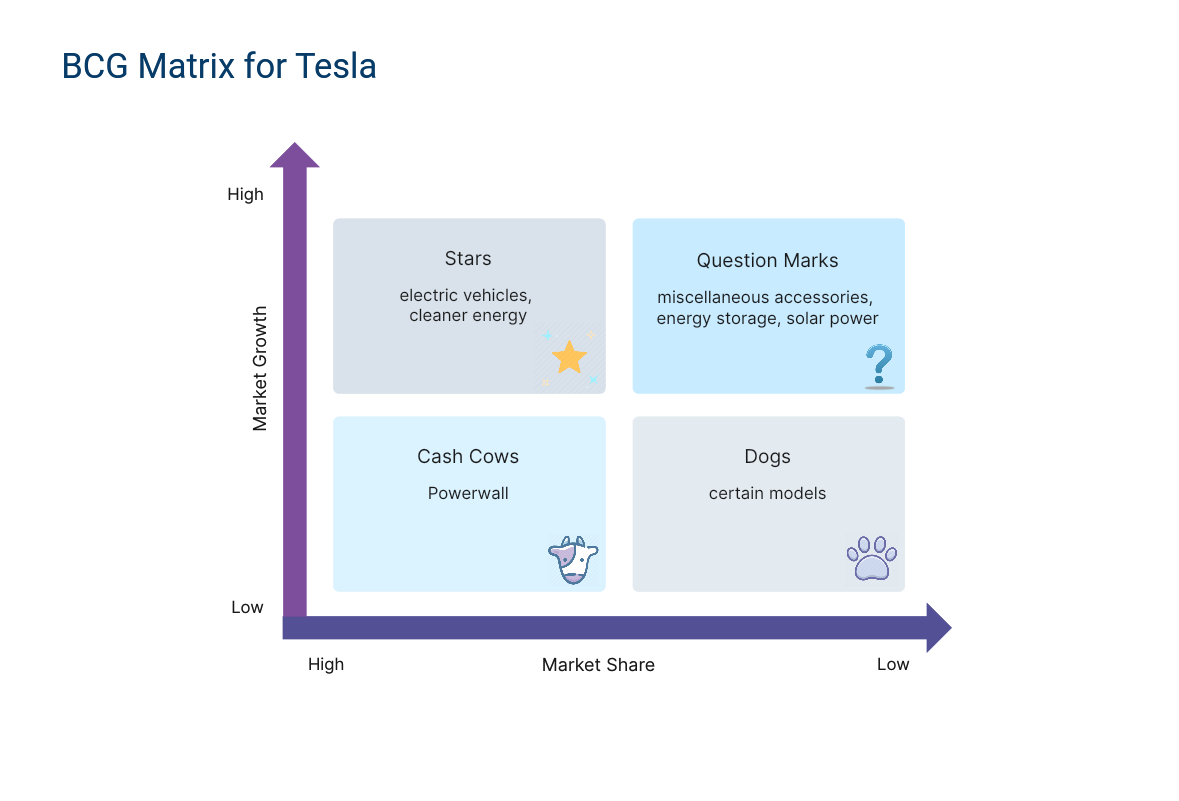
1) Stars: electric vehicles, cleaner energy
Tesla is indeed a leader in the sustainability industry, and all of its products and services are focused on a healthier environment. Model 3 is one of Tesla’s electric vehicle models; a star placement depends on relative share and growth in its defined market.
2) Cash Cows: Powerwall
Powerwall is used as a cash-cow example here, which would require high relative share in a low-growth home energy storage market. This battery can be used in domestic settings.
3) Question Marks: miscellaneous accessories, energy storage, and solar power
The dilemmas faced by the company include miscellaneous accessories, energy storage, and solar power. Competition in these markets is very high, so it is difficult to differentiate yourself over the long term. Ecology remains a niche market in today’s world that interests more and more players. These services require larger investments to be profitable.
4) Dogs: certain models
It is possible to highlight the manufacturing complication of certain models, which can largely compromise consumer orders, especially since the competition is becoming increasingly fierce.
Reference: https://www.oboolo.com/blog/our-tips/tesla-bcg-matrix-02-03-2022.html
BCG Matrix for Adidas
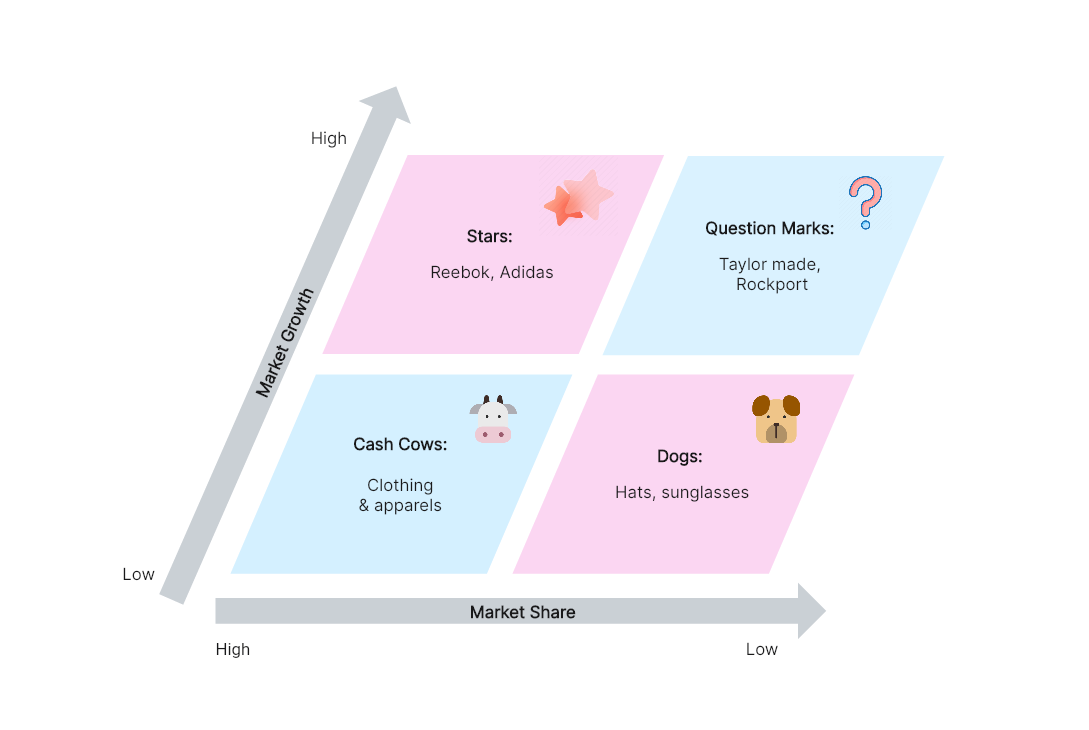
1) Stars: Reebok, Adidas
This historical example places Reebok and Adidas as stars. Reebok left the adidas portfolio when its sale was completed in February 2022.
2) Cash Cows: Clothing and apparel
For Adidas, its clothing and apparel are the cash cow items, and Adidas must consider this point, and position itself well in customers’ minds by targeting different geographic markets.
3) Question Marks: TaylorMade, Rockport (historical)
TaylorMade and Rockport are historical examples: adidas completed their sales in 2017 and 2015, respectively. They should not be included in a current adidas portfolio.
4) Dogs: Hats, sunglasses
The hats and sunglasses of Adidas are categorized in this quadrant because these are the least-selling items of the company, and many people are not interested in spending their money on them, as they have better options in this category.
Reference: https://bcgmatrixanalysis.com/bcg-matrix-of-adidas/
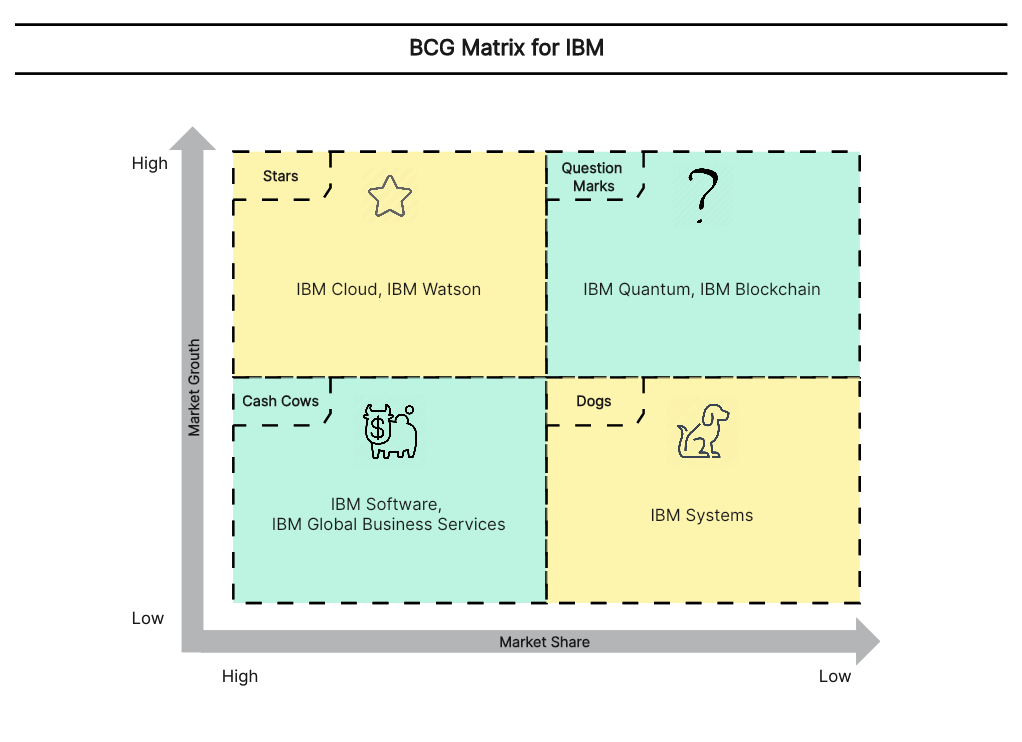
BCG Matrix for IBM
1) Stars: IBM Cloud, IBM Watson
IBM’s cloud computing services have shown significant market growth and have established a strong position in the cloud market. In addition, IBM’s Watson AI platform has demonstrated rapid growth and has become a prominent player in the field of artificial intelligence.
2) Cash Cows: IBM Software, IBM Consulting
IBM offers various software solutions, such as enterprise software and analytics, which generate steady cash flow for the company. IBM Global Business Services, the historical label in the diagram, was renamed IBM Consulting in 2021. Its cash-cow placement remains an example that needs market growth and relative share data.
3) Question Marks: IBM Quantum, IBM Blockchain
The company is actively involved in quantum computing research and development, representing a high-potential but uncertain market segment. Also, its blockchain technology has potential growth opportunities, although the market is still evolving, and its long-term potential is uncertain.
4) Dogs: IBM Systems
IBM’s hardware division, including servers and mainframes, represents a low-growth, low-market-share product category in comparison to their other offerings.