

If you are looking for the right tool to visualize the relationships in your environment, then you need to consider creating an ecomap or ecogram. In this article, we will thoroughly explain this type of graph and let you discover the ecomap example that better meets your requirements. Keep reading!
What Is an Ecomap
An ecomap is one of the most useful visual tools to show the relationships of an individual with their environment. For example, in an ecogram example, you include the family, the neighbors, the schoolmates or colleagues, and any other person who is a part of someone’s intimate or extended circle.
Through the use of this graphic representation, you can uncover the individual’s life context and spot any areas that need improvement. Namely, building an ecomap example will help you find the areas where your kid, employee, and even yourself are isolated. Because of these nature, the ecomap example is an exceptional tool for counselors, social workers, teachers, nursing professionals, and mental health specialists.
If you are working in any of these industries, or want to learn how to use a new and powerful tool, then you can learn from some ecogram examples for your case.
What Should be Included in an Ecomap
As we have already mentioned, an ecomap is a visualization tool. This means that it contains specific symbols that represent all the elements that you must add to the graph. Therefore, to create a complete ecogram example, you must learn what you should include in your graph and which symbol to use for each element.
The center of your graph is dedicated to the individual you are examining, be it your child or anyone else. Then, you start filling out every other individual or group that is a part of the individual’s life. The most common members that you will find in an ecomap are the following:
- Family members,
- Extended family members,
- Friends,
- Classmates,
- Teachers,
- Hobbies,
- Religious places,
- Social work,
- Work,
- Medical care services.
The next are the symbols to use for each one of the elements we’ve mentioned above. The set of symbols that you will use in this graph is the following:
- Circle – every actor that you will add to the diagram is represented with a circle. The individual is placed in the center, and around them are all the other members of their environment.
- Arrow pointing to the individual – this arrow indicates that this member of the environment directly affects the individual.
- Arrow pointing away from the individual – this type of arrow shows that the individual directly affects this member of their environment.
- Arrow pointing in both directions – this particular arrow shows that the influence is equal on both the individual and their environment.
- Curvy line – with this type of line, you can showcase the relationships that cause stress to the individual. To make the visual representation even more prominent, you can also color the line.
- Bold line – with this line, you highlight the close relationship of the individual.
What Is the Purpose of an Ecomap
An ecomap is an extremely useful tool for anyone that is trying to assess the family, work, and social relationships of an individual. Their main purpose is to highlight all the systems that the individual interacts with. Therefore, in an ecomap, you can visualize and evaluate all the areas of the individual’s life.
In more detail, an ecogram example is mainly used to spot the areas that need improvement. For example, a family ecogram can showcase the relationships that become stressful for the child. On the other hand, a social work ecogram can highlight how an individual interact with the outside environment.
6 Ecomap Examples
Family Ecomap Example -01
The first ecomap example places the family as a single entity at its center. Therefore, the graph shows all the things that interact with the family as a unit. In more detail, the connections we see are the extended family members, the family friends, the church, the social services, the medical services, the utility services, and the community services. This graph shows you the general areas that the family needs to work on.
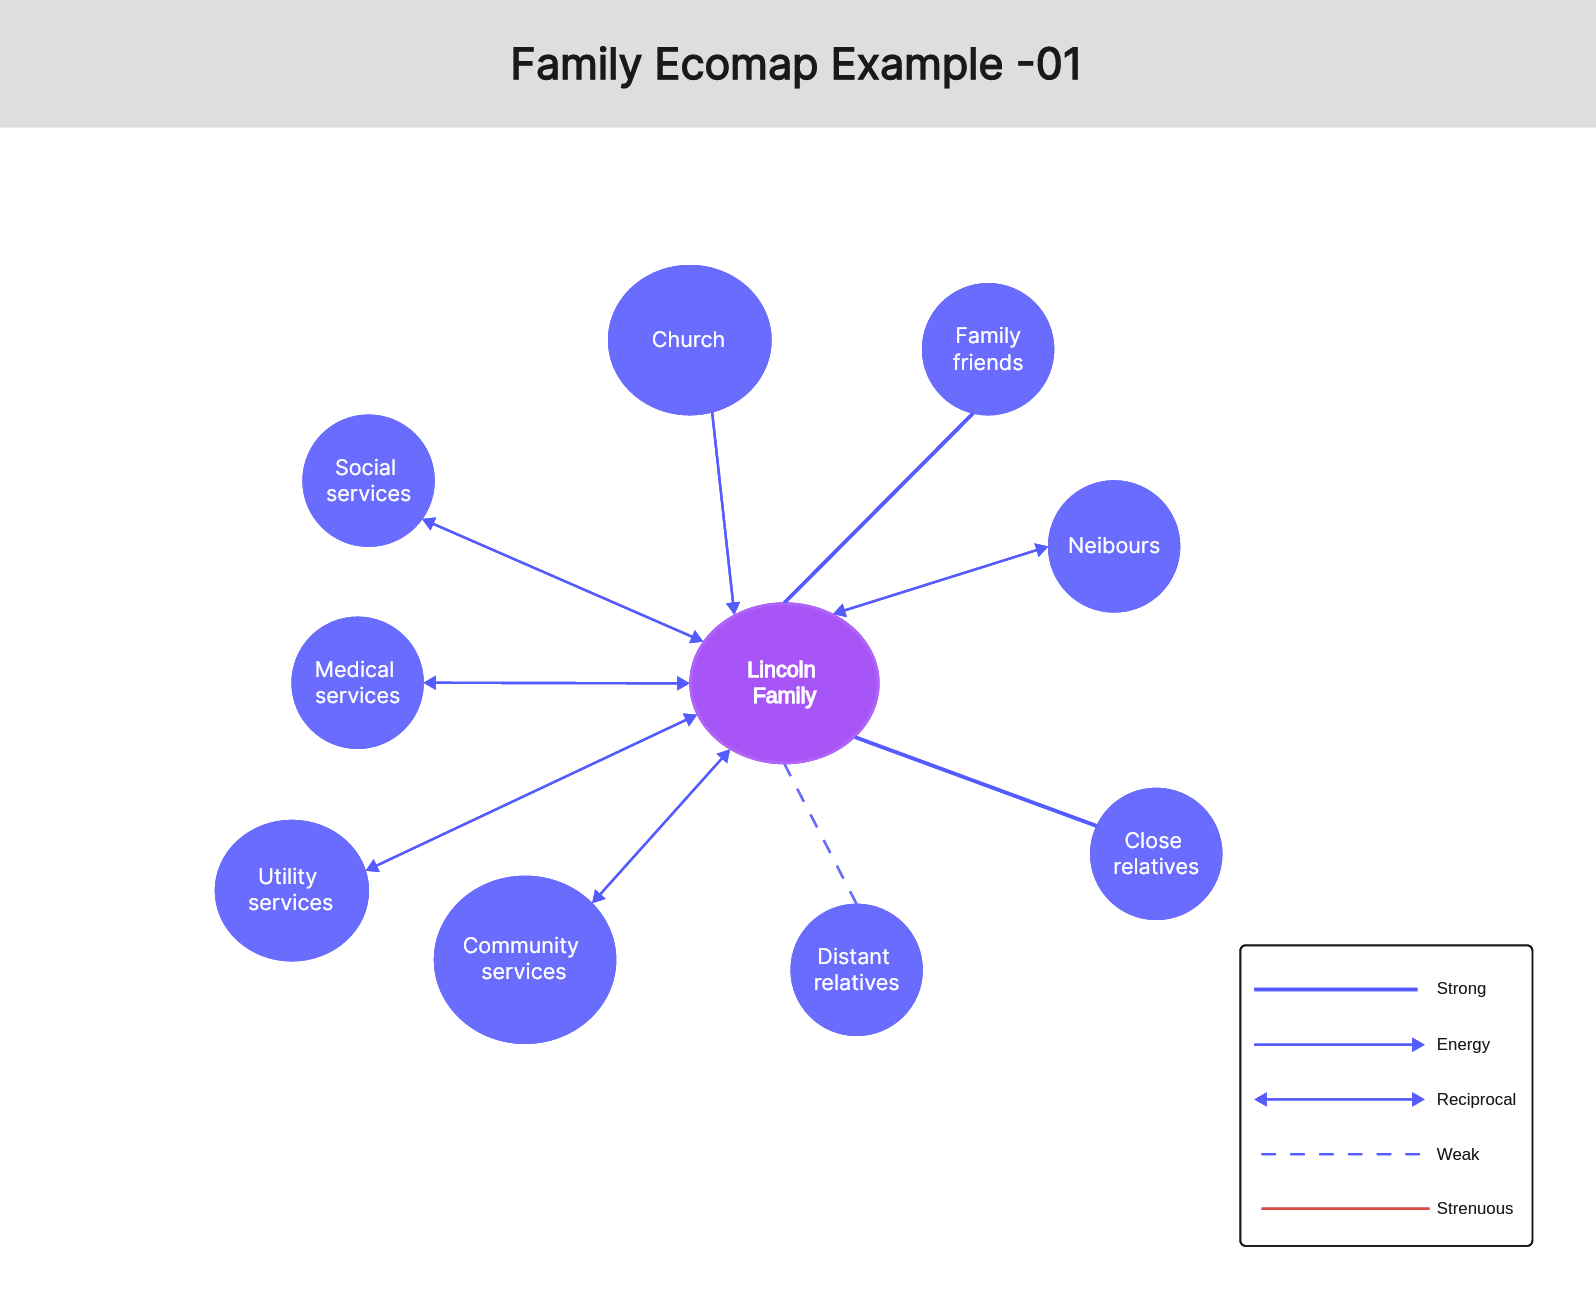
View more family ecomap examples
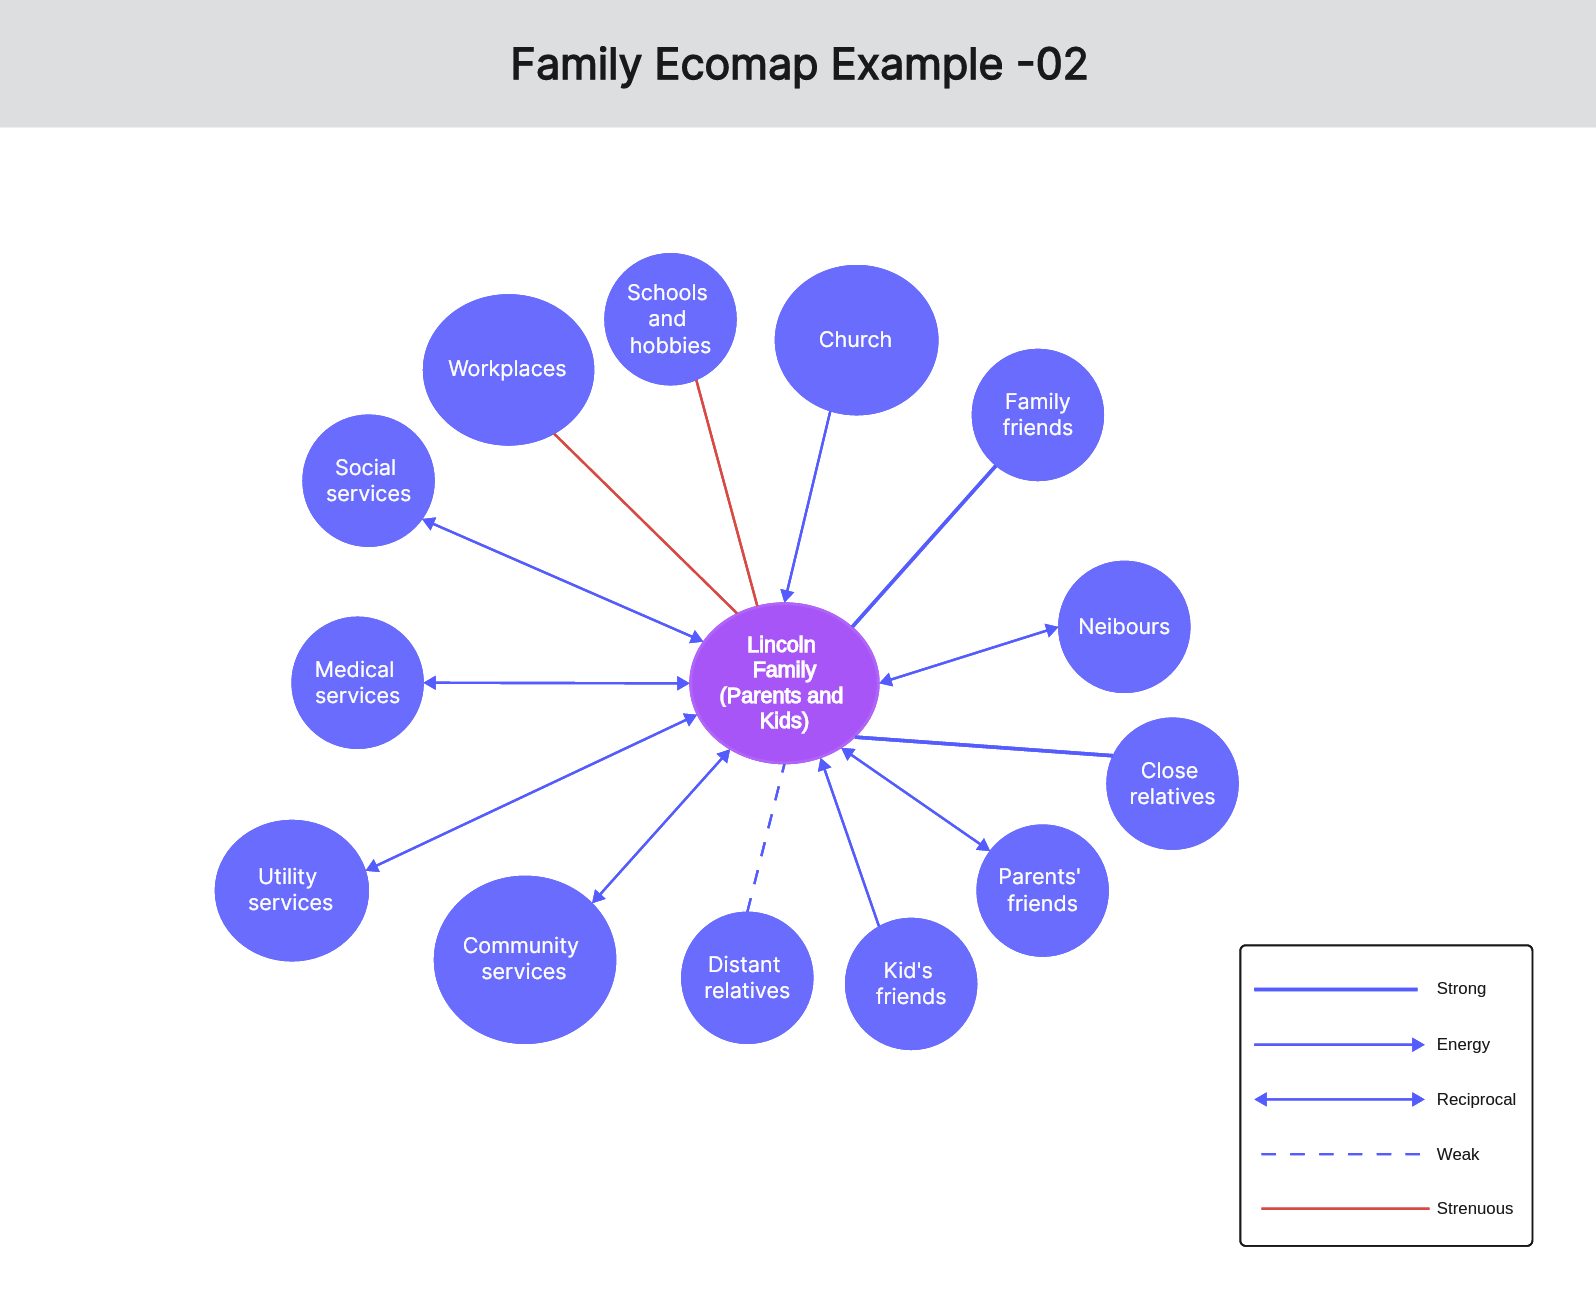
Family Ecomap Example -02
Another family ecogram example separates the parents and the kids, even though they are still placed all together in the center. In this case, there are all the interactions of the previous example, plus some additional ones. The new elements are the kids’ school and hobbies, as well as the parents’ workplaces, and each individual member’s friends. In this case, you can see in more detail, the relationships of every member of the family.
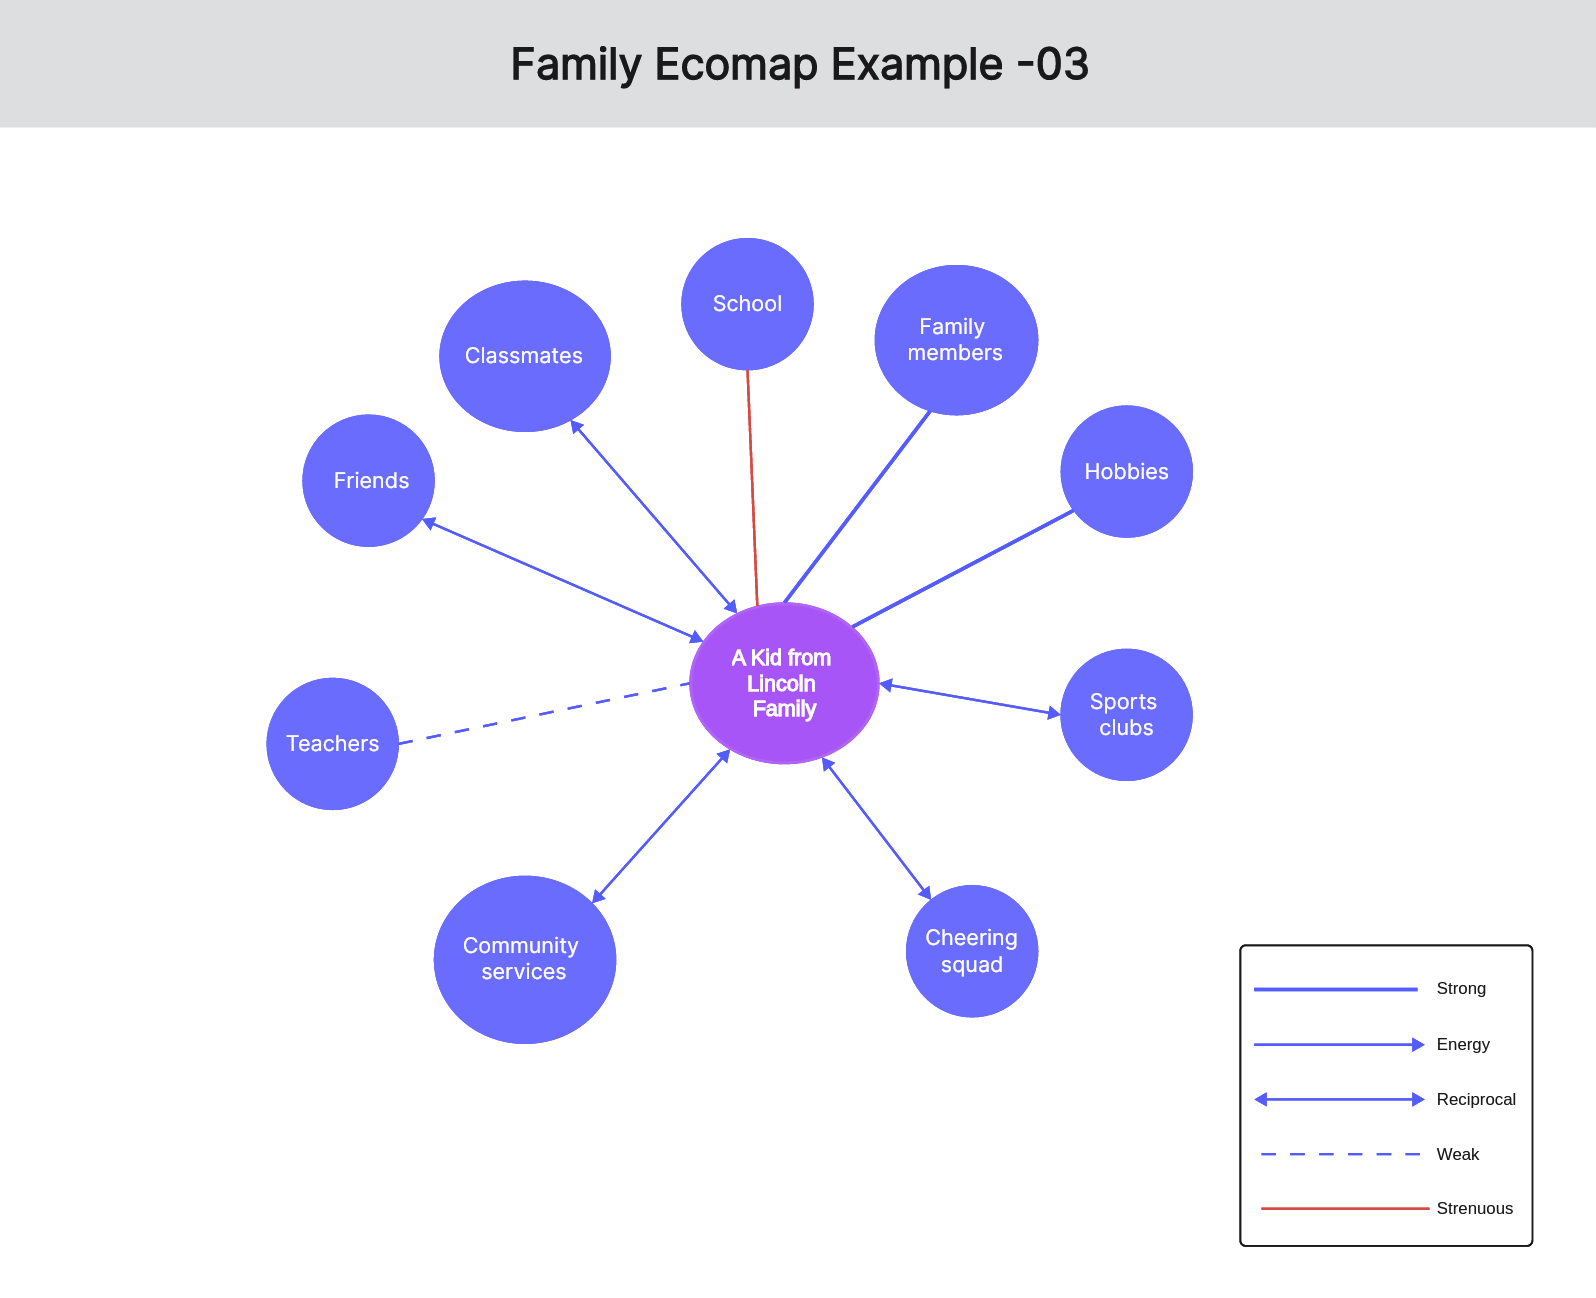
Family Ecomap Example -03
In another ecomap example, we are examining a single member of the family. This type of example can be useful for parents that want to find ways to help their kids develop, grow healthily and develop into functioning adults. In this case, you place your kid at the center, and then you add all the other elements in their life. As you can see, these include their family members, school, classmates, friends, teachers, hobbies, and sports clubs. In this example, you can clearly see that school is a stressor in the kid’s life because of bullying.
Ecomap Example in Social Work -01
Apart from the family ecomap, there is also the social work ecomap. In this social work ecogram example, we are examining the relationships of a young person attending college. In this case, we need to separate all the important members. Therefore, we separate the mom, dad, older sister, younger brother, classmates, close friends, teachers, and extended family. In this example, this allows us to spot the stressful and competitive relationship between their siblings.
View more ecomap examples in social work
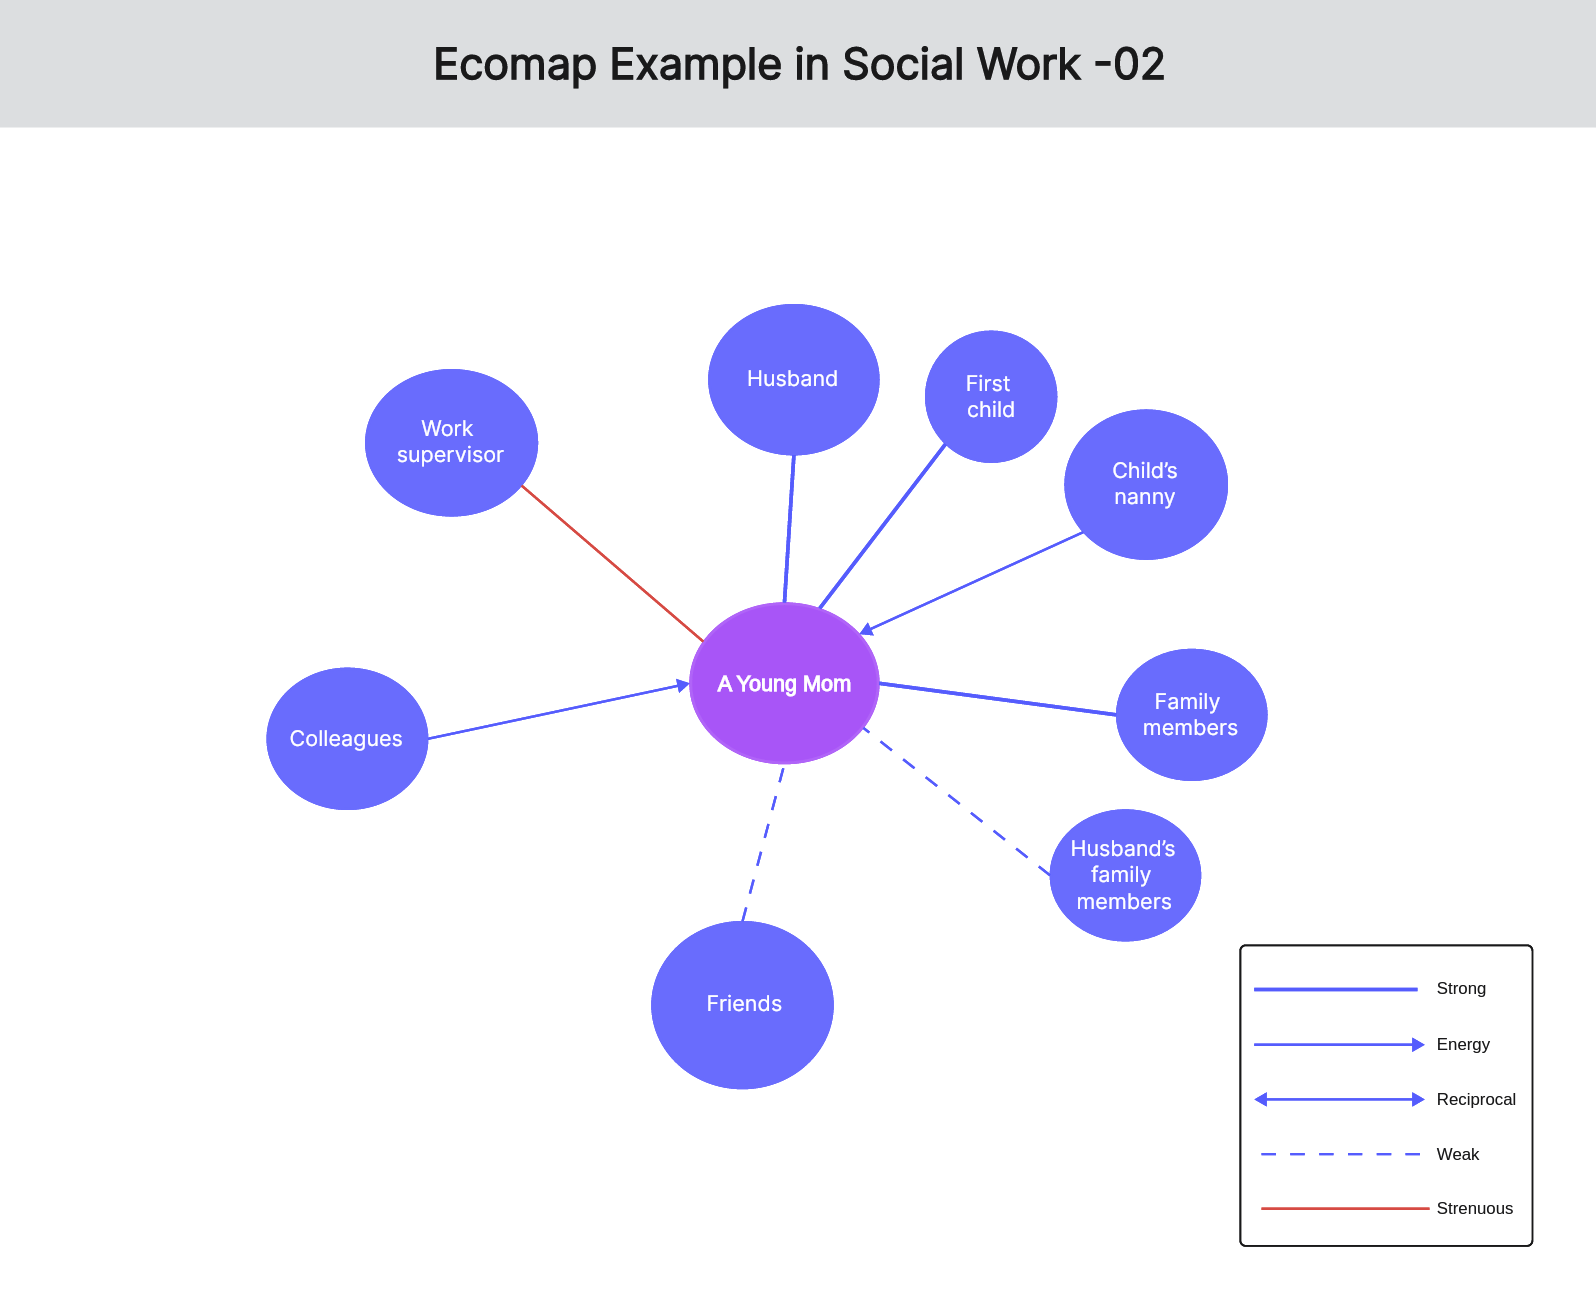
Ecomap Example in Social Work -02
The following ecomap example is that of a young mom. In this case, we place her at the center of the graph. Then, around her we are placing her husband, first child, work supervisor, colleagues, friends, the child’s nanny, her family members, and her husband’s family members. By doing this, the young mom can identify the areas that she needs to improve to find the right balance between her new family, her work, and her social life.
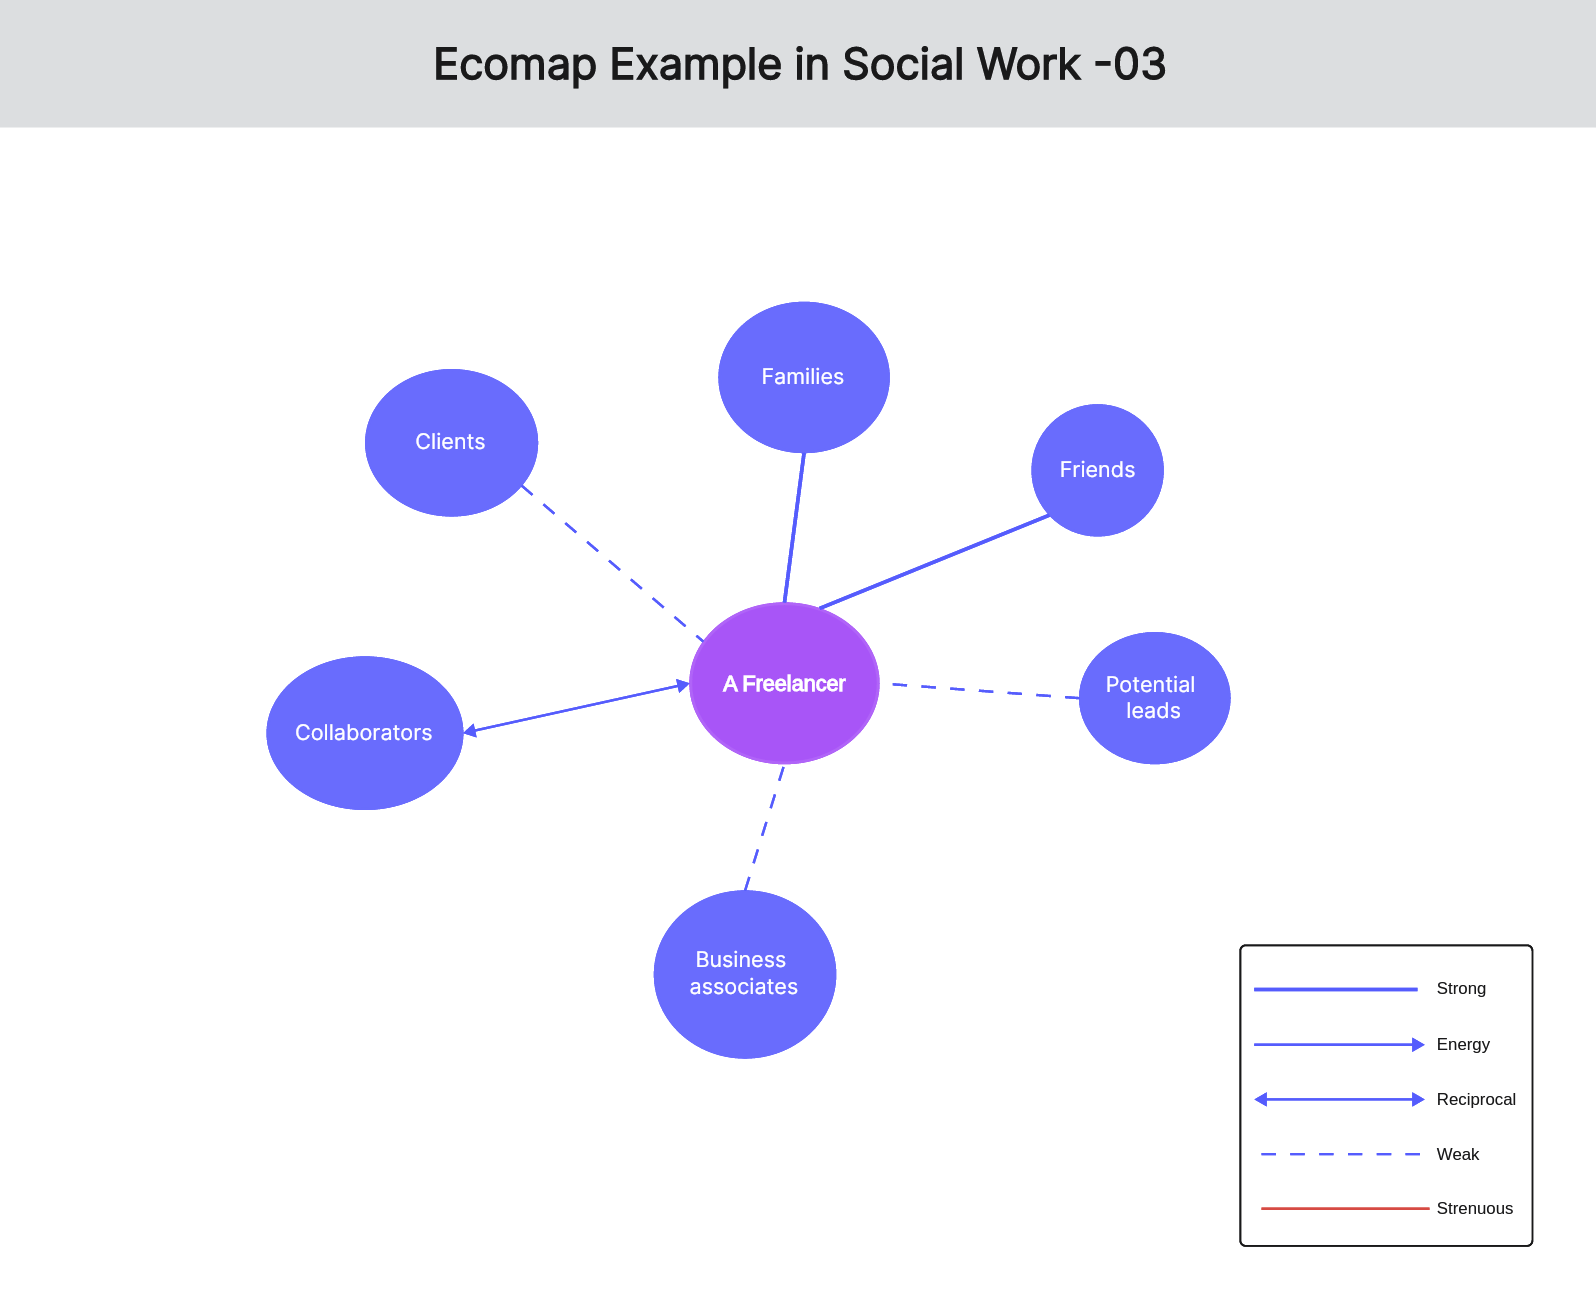
Ecogram Example in Social Work -03
In the final ecogram example, we are taking a look at a freelancer who wants to grow their career. To start with this, we are placing the individual at the center. Then, we start writing down all the interactions they have. Therefore, we should first add their family and friends. Then, we start adding all the work-related members, which include their clients, collaborators, business associates, and potential leads. This way, the freelancer can focus on the relationships he needs to boost to retain his current workload and get new clients.
How to Create an Ecomap (Blank Template Included)
Common Tips
The great thing is that an ecomap is a fairly simple thing to create. However, the challenging part is identifying the relationships between the members you are going to add to your ecomap. For this reason, the most useful tip to start creating this visual tool is to add all the interactions step-by-step.
The other tip is to start noticing non-verbal details to create the graph. For instance, when you interview the individual to draw the ecogram, you can take notes on the facial micro-expressions to identify the stressful or strained relationships.
Therefore, the methodology to create an ecomap example of your own is the following:
Step 1 – Create the individual’s circle and place it at the center of your graph.
Step 2 – Add their closest connections in their environment.
Step 3 – Write down all other systems that might affect the individual daily.
Step 4 – Define the relationships with the use of appropriate lines to highlight close, tenuous, and stressful relationships.
Quick Tip - Boardmix Ecomap Diagram Templates
Right now, Boardmix helps you create your ecomap example in no time. This online whiteboard provides you with an ecomap template that you can directly edit by adding your data. Then, you can simply customize your graph and share it with all interested parties.
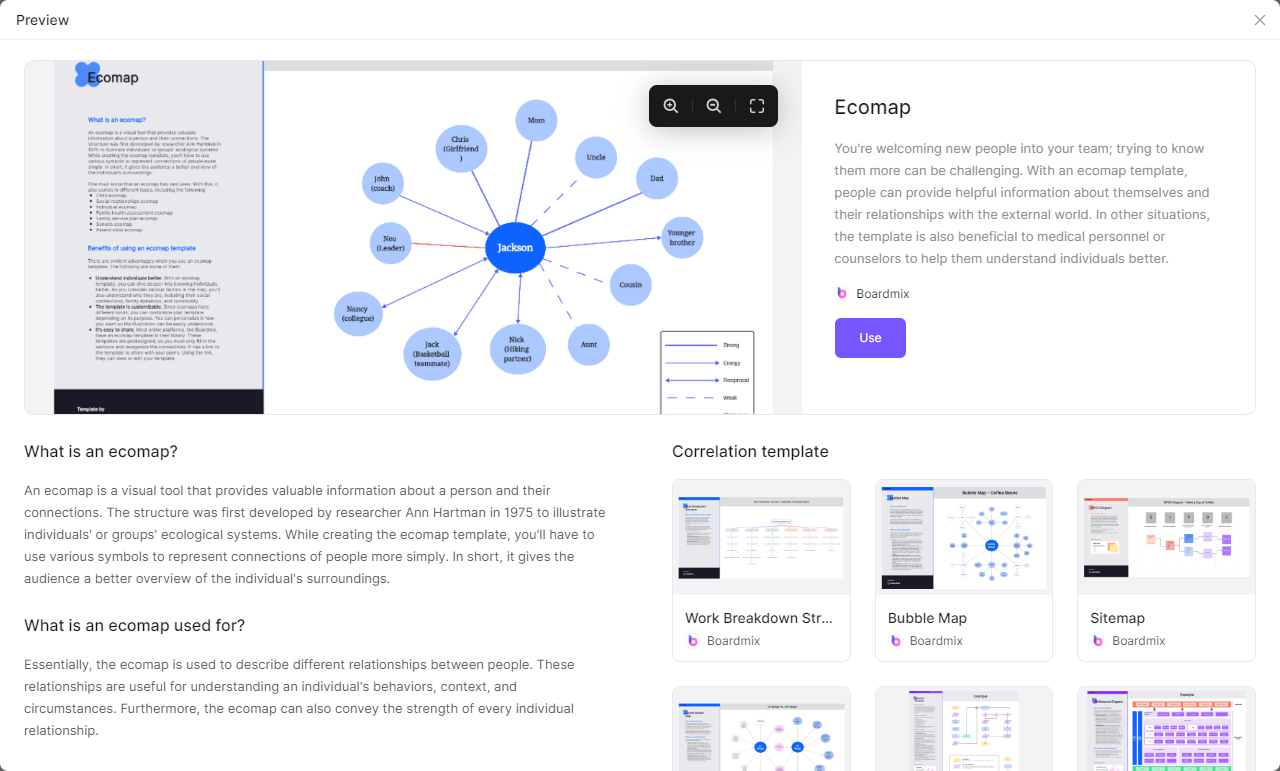
The amazing thing is that Boardmix doesn’t require any technical or design skills. The templates are all well-designed and visually pleasing so that you create your ecogram with minimal effort. The only thing you will need is an internet connection to access the online tool.

The Bottom Line
In all the above examples, you are sure to find an ecogram example that fits your case. Adopt this exceptional graph to visualize your family’s relationships and find which areas need improvement. In Boardmix, you will find all the tools you need to create an ecomap in a few simple steps. Create your free account to get started!


