

An activity network diagram is a useful tool for both project managers and team members. It aims to highlight the critical path that the team needs to follow to successfully complete the project in the most optimal way. So, it is easy to understand that its implementation can actually boost the team’s productivity and lead to better results.
In this article, we will analyze the AON diagram, which is a type of activity network diagram. You will see some case studies, learn how to create an AON diagram, and discover the tool that makes this process effortless. Stay tuned.
What Is Activity Network Diagram
Before we dive deeper into the process of creating an activity network diagram and an AON diagram, let’s see what they are.
An activity network diagram is a visual representation of the project that indicates the time sequences of the events that need to be executed for the completion of the project. All the activities are shown as nodes and the movement within the project is indicated by arrows.
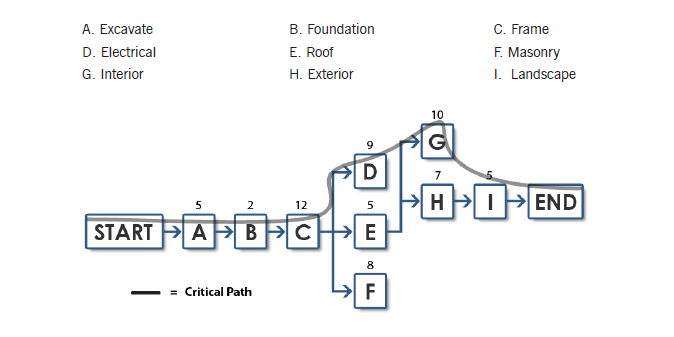
Figure 1. Example of Activity Network Diagram. Source: Six Sigma Daily
When all the tasks are drawn in this activity network diagram, it is easy to figure out which ones need to be run in a series, and which in parallel. This type of diagram can also be called an AON diagram, or activity on node diagram. In reality, it is part of the precedence diagramming method as it shows both the activities and their relationships.
When creating an activity network diagram, there are four relationships that can be indicated. These are the following:
- Finish to Start (FS) – in this relationship, the previous task must be completed before the following one can begin.
- Finish to Finish (FF) – in this relationship, a task cannot be completed if its previous task isn’t already completed. In essence, these tasks need to finish around the same time.
- Start to Start (SS) – in this relationship, a task cannot be initiated before its previous task. In reality, these two tasks can start at the same time.
- Start to Finish (SF) – in this relationship, a task cannot be completed until its previous task has started. This is one of the rarest cases that you can encounter in an AON diagram.
Start Activity Network Diagram ![]()
Why Do You Need Activity Network Diagram
The explanation above has already given you hints about the importance of the activity network diagram. To make things clearer, we are going to explain the main benefits that you will get from using an AON diagram for your project:
- It can identify the activities that might cause issues and delays: if you are working on a complex project, you need to make sure that you don’t encounter any bottlenecks. This will allow you to complete it in time. An activity network diagram can highlight the tasks that might cause delays.
- It gives a visual representation of the workflow: when you are placing activities on an AON diagram, you can view how they depend on one another. This will help you establish the optimal workflow to ensure that everything is going according to plan.
- It is a simple-to-understand tool: this diagram is using only nodes and arrows. For this reason, everyone on your team can use it to check the project’s progress.
- It can be used for reporting to stakeholders: as a project manager, you know well that you need to report to the stakeholders. An activity network diagram is a perfect tool to explain each step of the project and its timeframe.
Case Study of AON Diagram
In this section, we are going to look at the AON diagram through some case studies.
Case 1
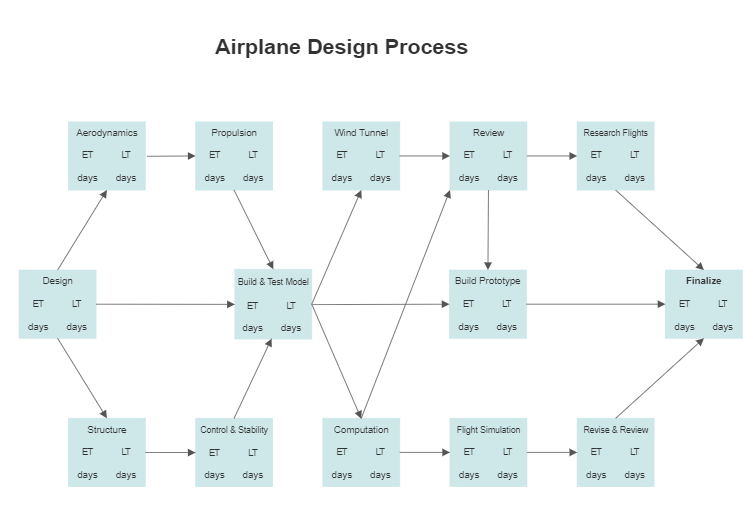
Figure 2. AON Diagram - Airplane Design Process. Source: Smart Draw
The first case study shows the AON diagram of an airplane design process. Of course, this is a complex process that requires coordination. In the diagram, you can see how each task affects the others. By studying this activity network diagram, you are in a position to spot which is the critical path for the designing process of an airplane.
Case 2
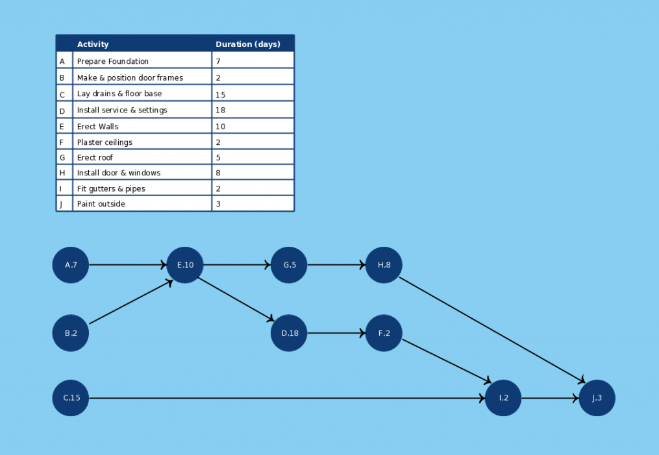
Figure 3. AON Diagram - Building Construction. Source: Creately
The second case study is that of an AON diagram that shows the activities included in the construction of a building. Just a glance shows you which tasks need to finish in order for the rest to begin. This way, any member of the team knows exactly what needs to be done toward the completion of the project, in this case, the construction of the building. In this specific example, you can also see the duration of each task placed on the activity’s node.
Case 3
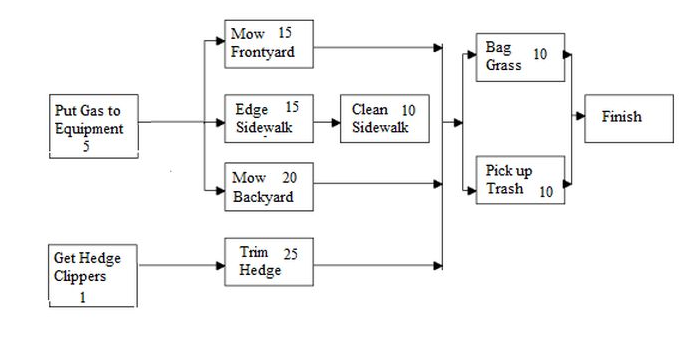
Figure 4. AON Diagram - Backyard Maintenance. Source: NAIS Lab
The third case shows you that an activity network diagram can be created for any type of project, even for backyard maintenance. Regardless of the task, the important elements are all there, indicating the dependency between the tasks.
How to Create Activity Network Diagram
Now that you have a grasp on what an activity network diagram is, we will explain how you can create one for your project.
Step-by-step Guide
If this is your first time creating an AON diagram, you might feel a bit overwhelmed. However, you can follow these steps to draw a thorough activity network diagram:
Step 1 – Determine the tasks that need to be completed
The first thing that you need to do is to break the project into smaller tasks that need to be completed.
Step 2 – Find the dependency between these tasks
The next step is to identify how each task is related to the others. For example, you can find the tasks that need to be completed before others begin.
Step 3 – Calculate how much time each activity will take
The next step for your activity network diagram is to determine how much time you will need to complete each task. This will show you the overall time needed for the completion of the whole project.
Step 4 – Calculate the critical path
The critical path is central in an AON diagram as it indicates the longest time for the necessary tasks of the project to be completed.
Step 5 – Identify the most likely, best-case, and worst-case times
Other important numbers that you need to calculate in your AON diagram are the most likely time, as well as the best-case and the worst-case times. These will cover all possible scenarios that you might encounter.
Step 6 – Evaluate your progress
The last step is to evaluate your progress and how it corresponds to the activity network diagram. At this stage, you might find changes in the critical path.
Start Activity Network Diagram ![]()
An All-in-one Tool for AON Diagram – Boardmix
When you decide that it’s time to create an activity network diagram for your project, you should discover Boardmix. This collaborative whiteboard tool gives you everything you need to create high-quality charts, graphs, and diagrams with just a few clicks. And the greatest thing of all is that all your team members can view, comment, and make changes in real-time.
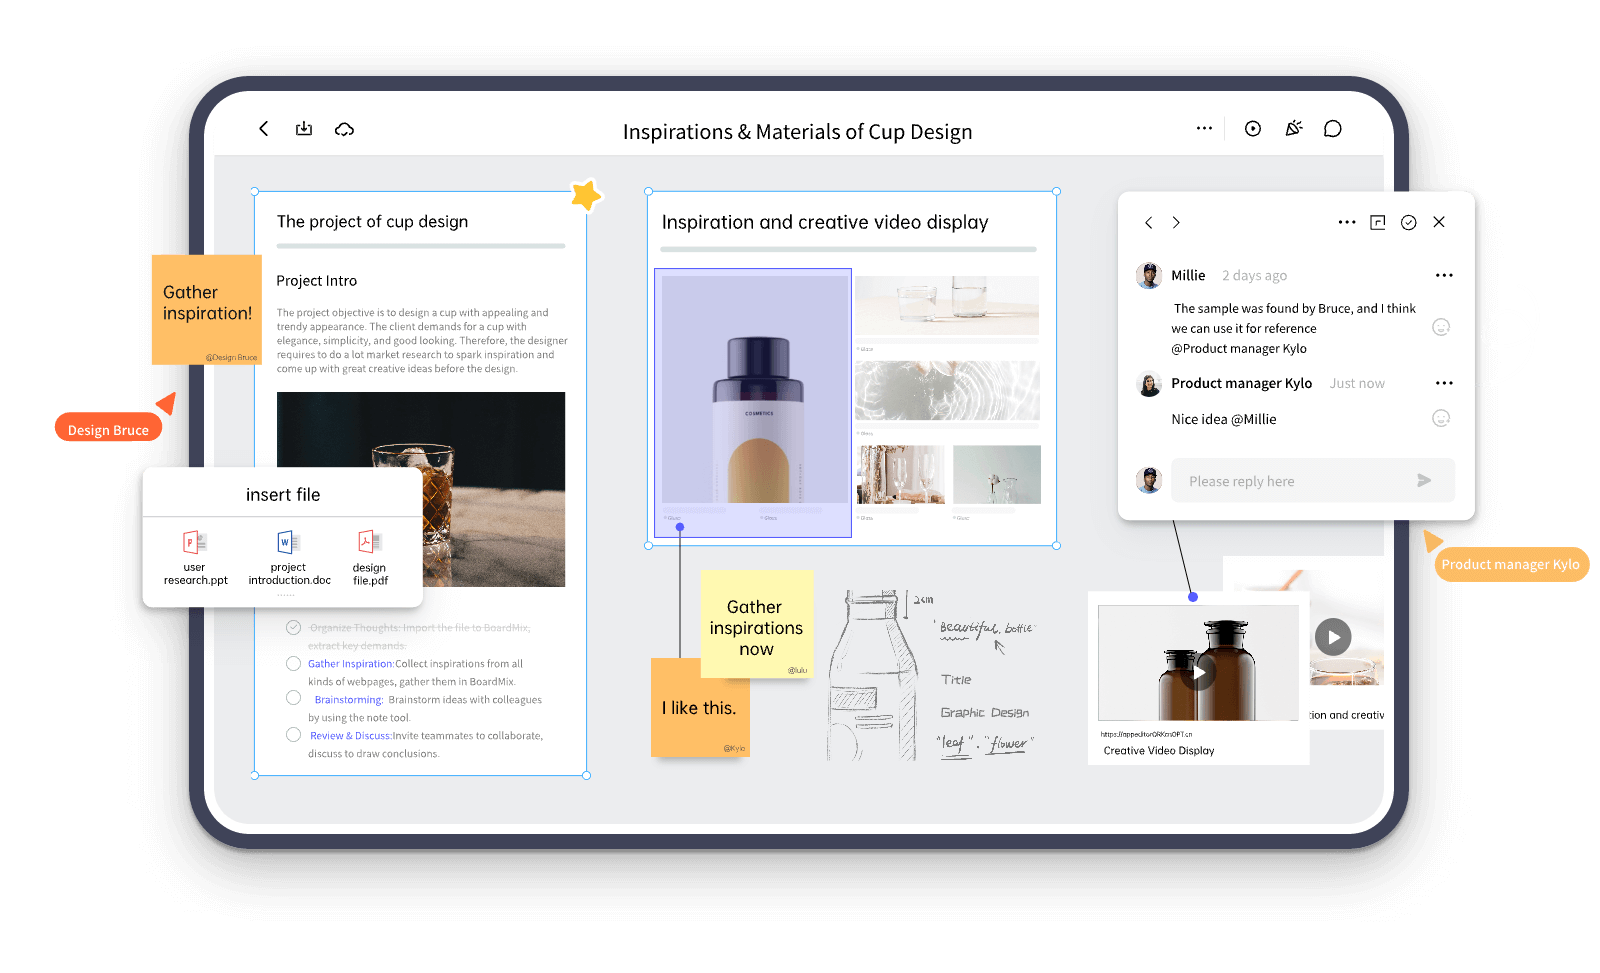
Moreover, you can have audio or video conferences with your project managers or stakeholders through Boardmix. This way, you can immediately show them your AON diagram and discuss the project’s progress.
The Bottom Line
When it comes to project management, an activity network diagram is essential. The good news is that you now have the perfect tool to create one in a matter of minutes. Boardmix is an easy-to-use platform that has all the features you need to create an AON diagram, as well as various other charts. Discover today its full potential.


