


In the world of data visualization, bar charts are a popular choice due to their simplicity and effectiveness. They are particularly useful when it comes to comparing data across different categories or showing trends over time. In this article, we will guide you through the process of creating bar charts in Excel and Boardmix, discuss their pros and cons, and help you decide which tool is best for your needs.
What Is a Bar Chart
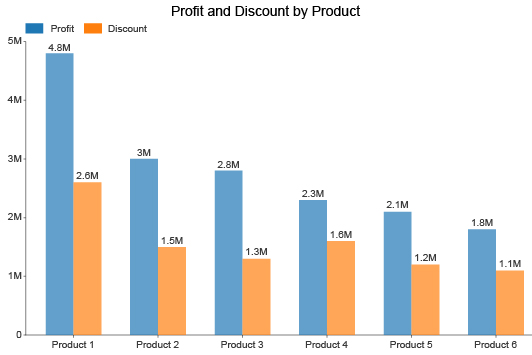
A bar chart is a graph that represents categorical data using rectangular bars, with each bar's length proportional to the value it represents. This makes it easy for viewers to grasp the relative magnitude of different data points at a glance.
Creating a bar chart may seem like a daunting task, but with the right tools and guidance, it can be a relatively simple process. Following with this article, you'll be well on your way to creating effective and engaging bar charts that communicate your data clearly and concisely.
How to Make a Bar Chart in Excel
Creating bar chart in Excel is convenient and efficient for people to grasp different data differences on work projects. Below is the creation steps on how to go about it.
- Open your data in Excel and select the cells you want to use for your bar chart.
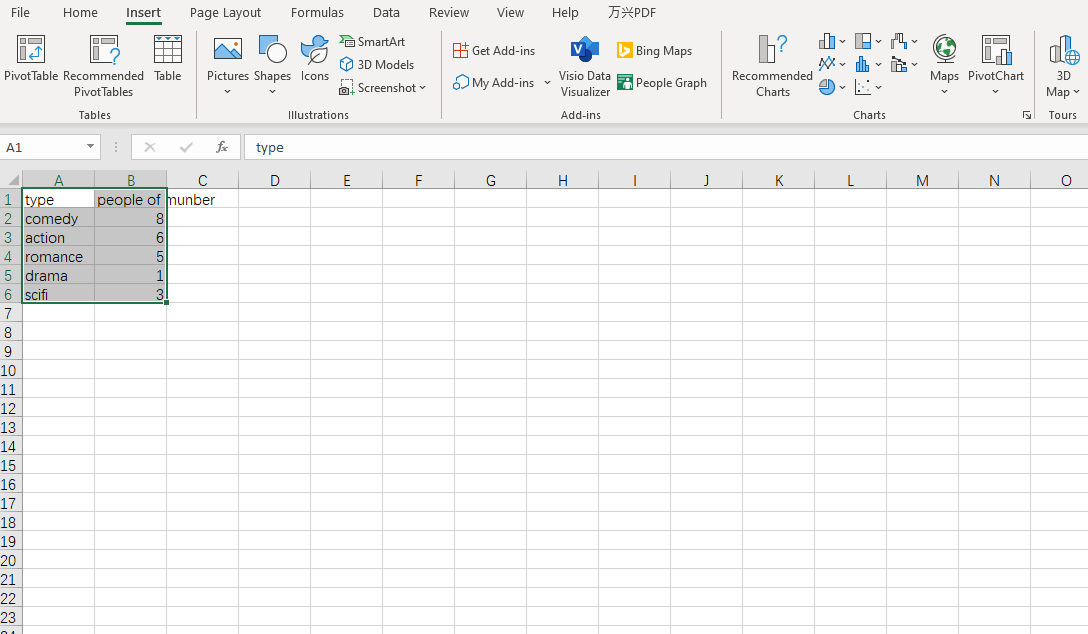
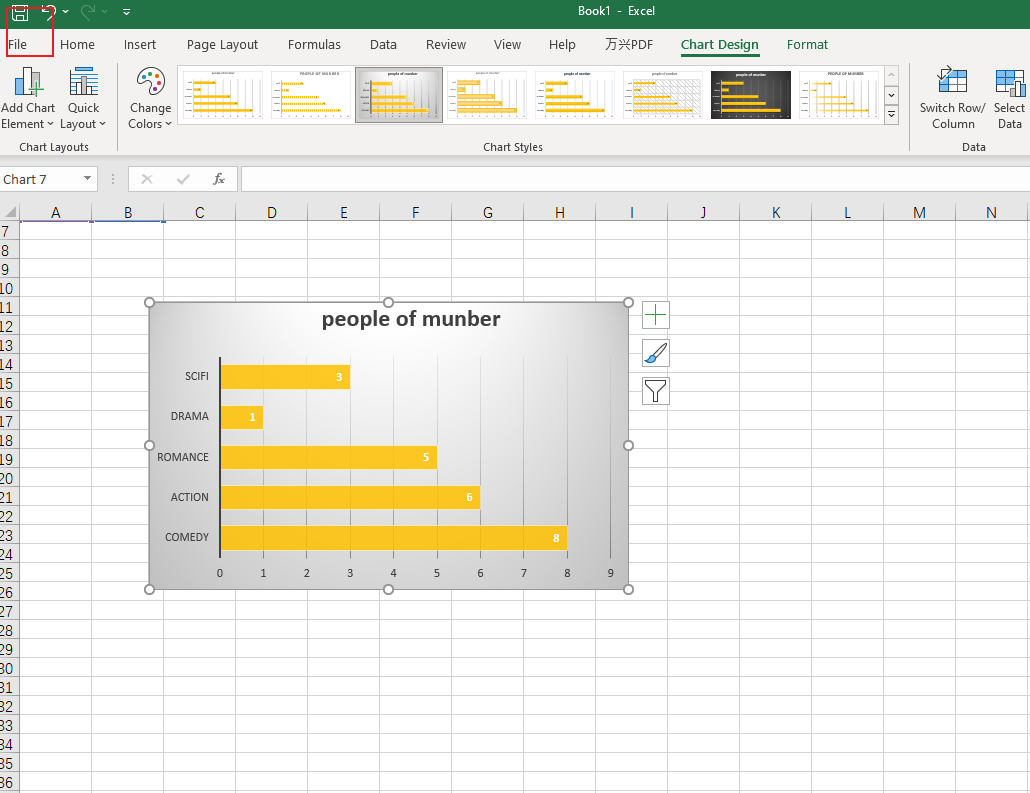
- Click on the "Insert" tab and select "Charts."
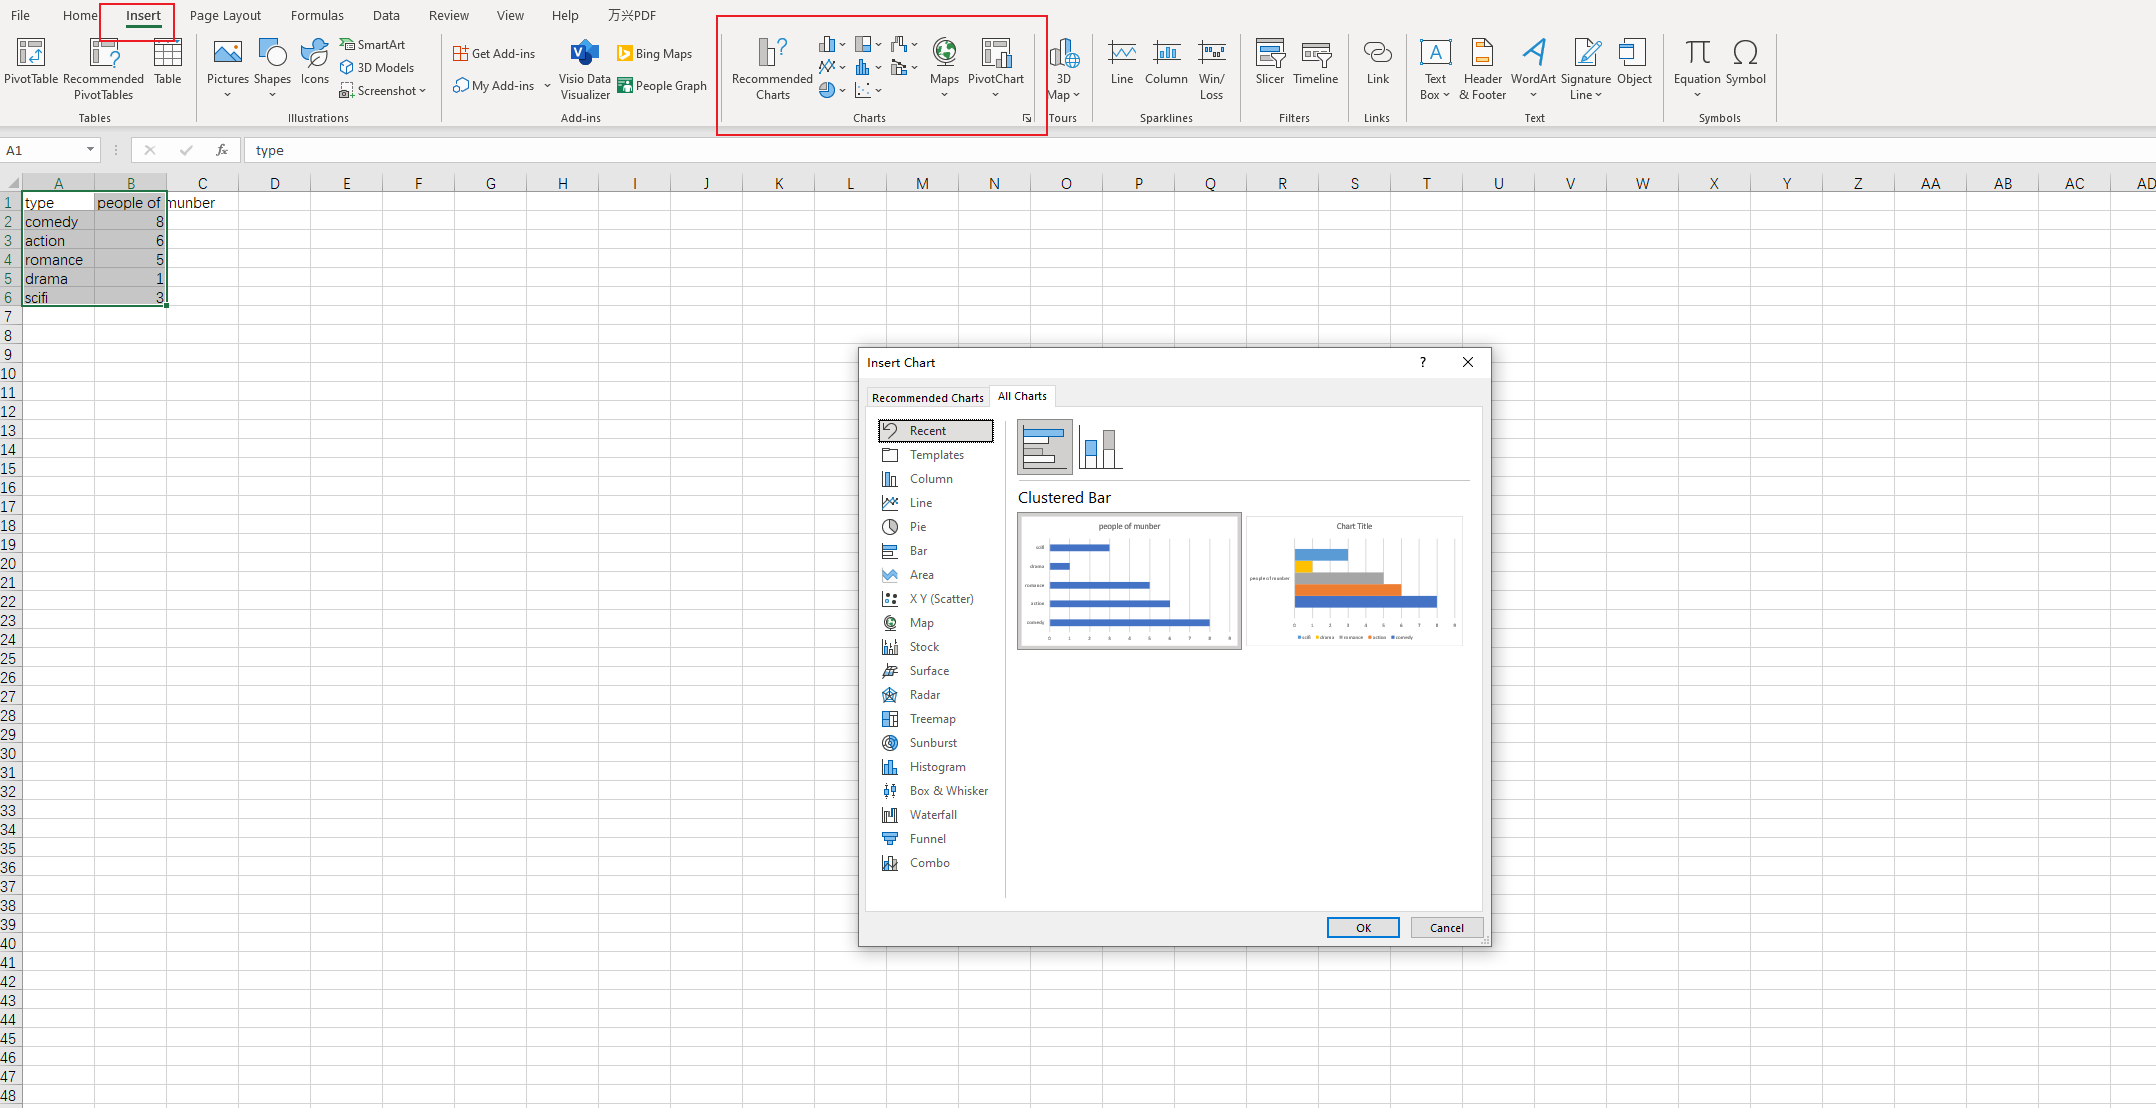
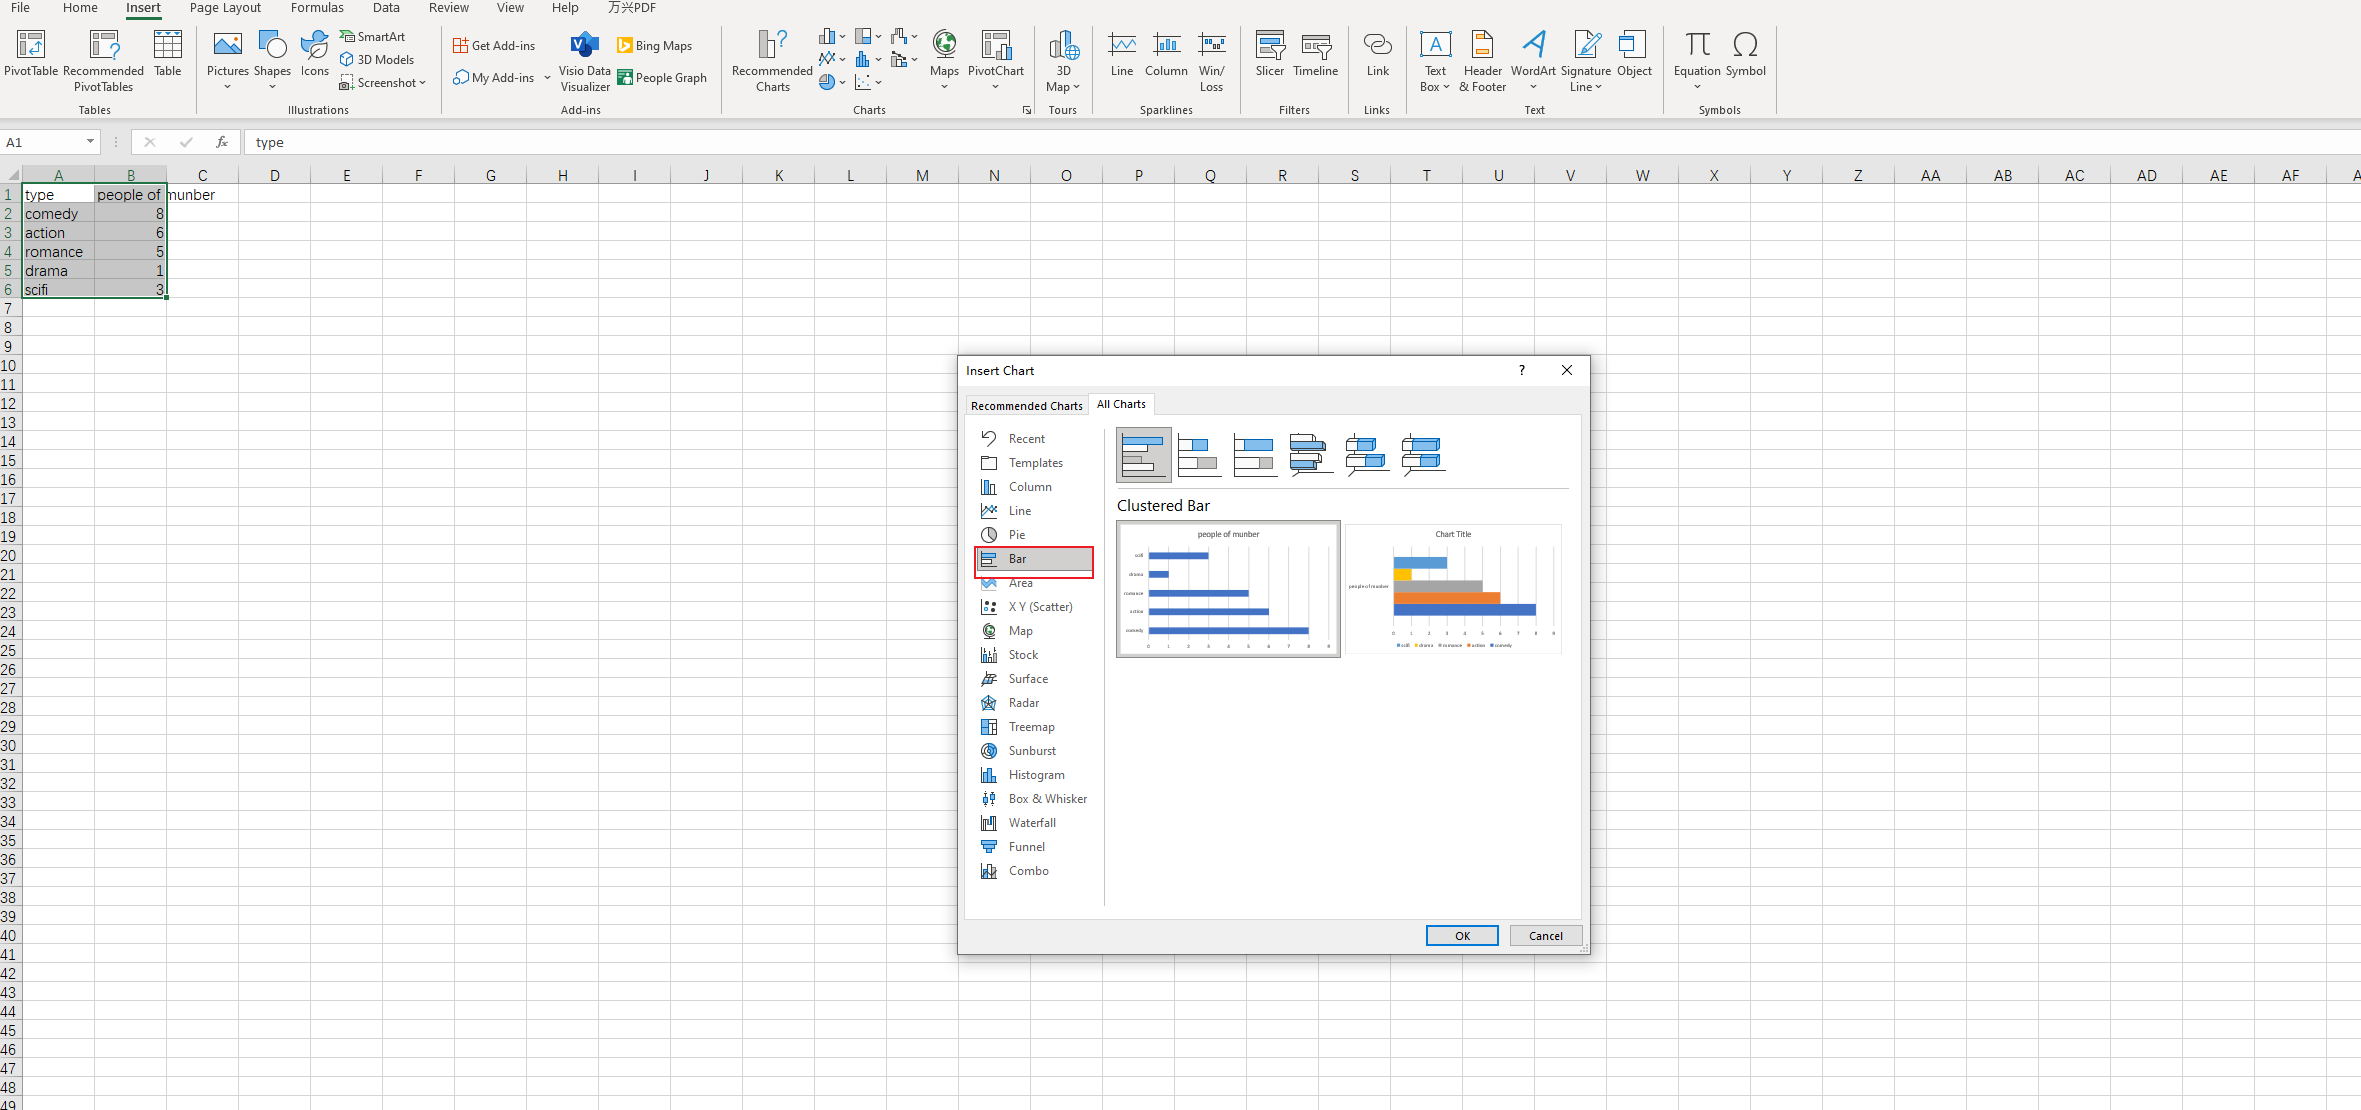
- Choose the "Bar" chart type and select the subtype that best suits your data.
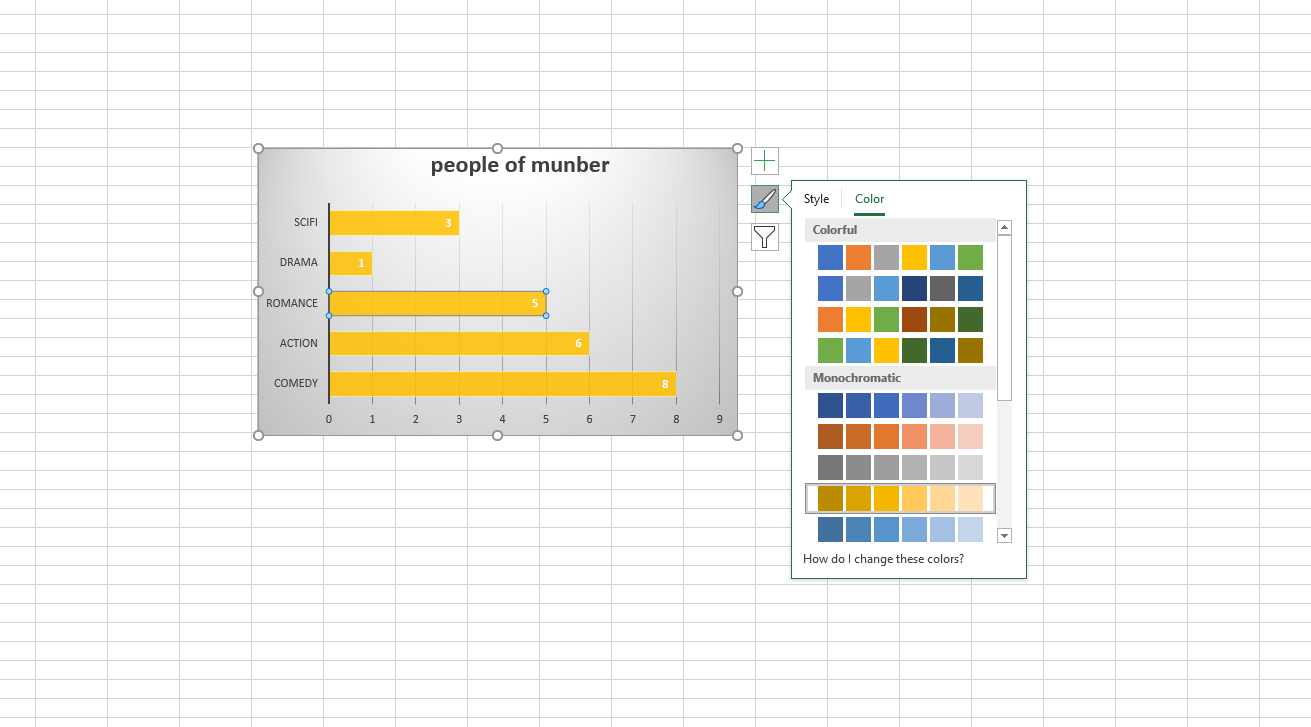
- Adjust the chart's appearance by changing the colors, labels, and axis titles as needed.
- Once you have finished the customization, click "Save as", and you will be able to save the file.
Pros and Cons of Making Bar Charts in Excel
Pros:
Easy accessibility: Excel is a widely used software, familiar by many people. This makes it easy for users to create bar charts without needing specialized knowledge or skills.
Integrated with other Microsoft Office applications: Excel can easily integrate with other applications. This makes it convenient for users to share or present their bar charts in different formats.
Rich chart types and customization options: Excel offers a variety of chart types. Users can also customize the appearance of their charts by changing the colors, labels, and axis titles.
Formula and function support: Excel is designed for data analysis and manipulation, which means it provides powerful formula and function support.
Cons:
Limited design options: Although Excel offers a wide range of chart types and customization options, it may not offer the same level of design flexibility as specialized visualization tools.
Difficult to create complex charts: Excel is not designed for creating complex or interactive charts. Users who need these features may need to rely on third-party plugins or switch to a different tool.
Lack of real-time updates: Excel may struggle with large data sets or real-time updates, which can make it difficult to create accurate and up-to-date bar charts.
In conclusion, Excel is a suitable choice for users who require a simple, straightforward solution for creating bar charts and are already familiar with the software. However, those with more advanced needs, such as creating complex or interactive charts, may need to look for alternative visualization tools.
How to Make a Bar Chart in Boardmix
Boardmix is a powerful online platform that enables users to create, collaborate, and present ideas visually. With its user-friendly interface and wide range of features, Boardmix has become an essential tool for individuals and teams looking to streamline their workflow and improve communication.

In terms of bar charts creating, Boardmix offers a seamless and intuitive experience. Its built-in design tools allow for further customization of the chart's appearance, including colors, labels, and axis titles. Boardmix also provides advanced features such as real-time updates, collaboration, and integration with other tools, making it an ideal choice for those who need a comprehensive and versatile platform for creating bar charts and other visual content.
Below is a step-by-step process of creating a bar chart in Boardmix to help you create a comprehensive and efficient bar chart.
- Log in to your Boardmix account and create a new board.

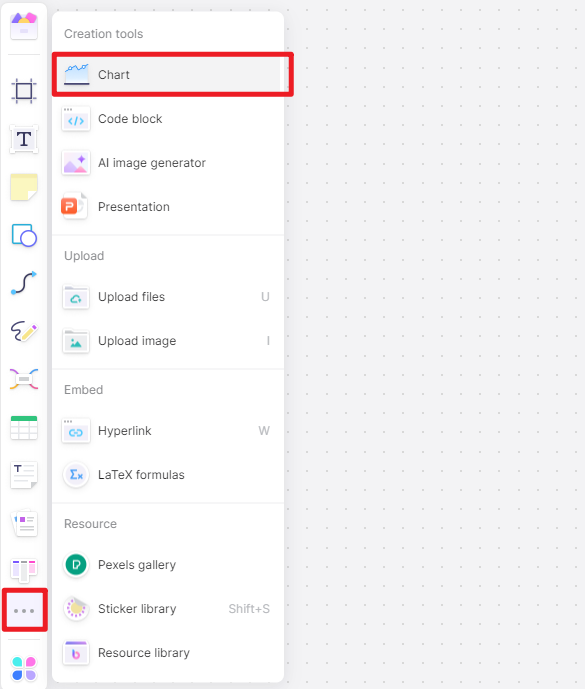
- After enter the editor, click the 3-dot menu from the left side bar, and choose "Chart" option.
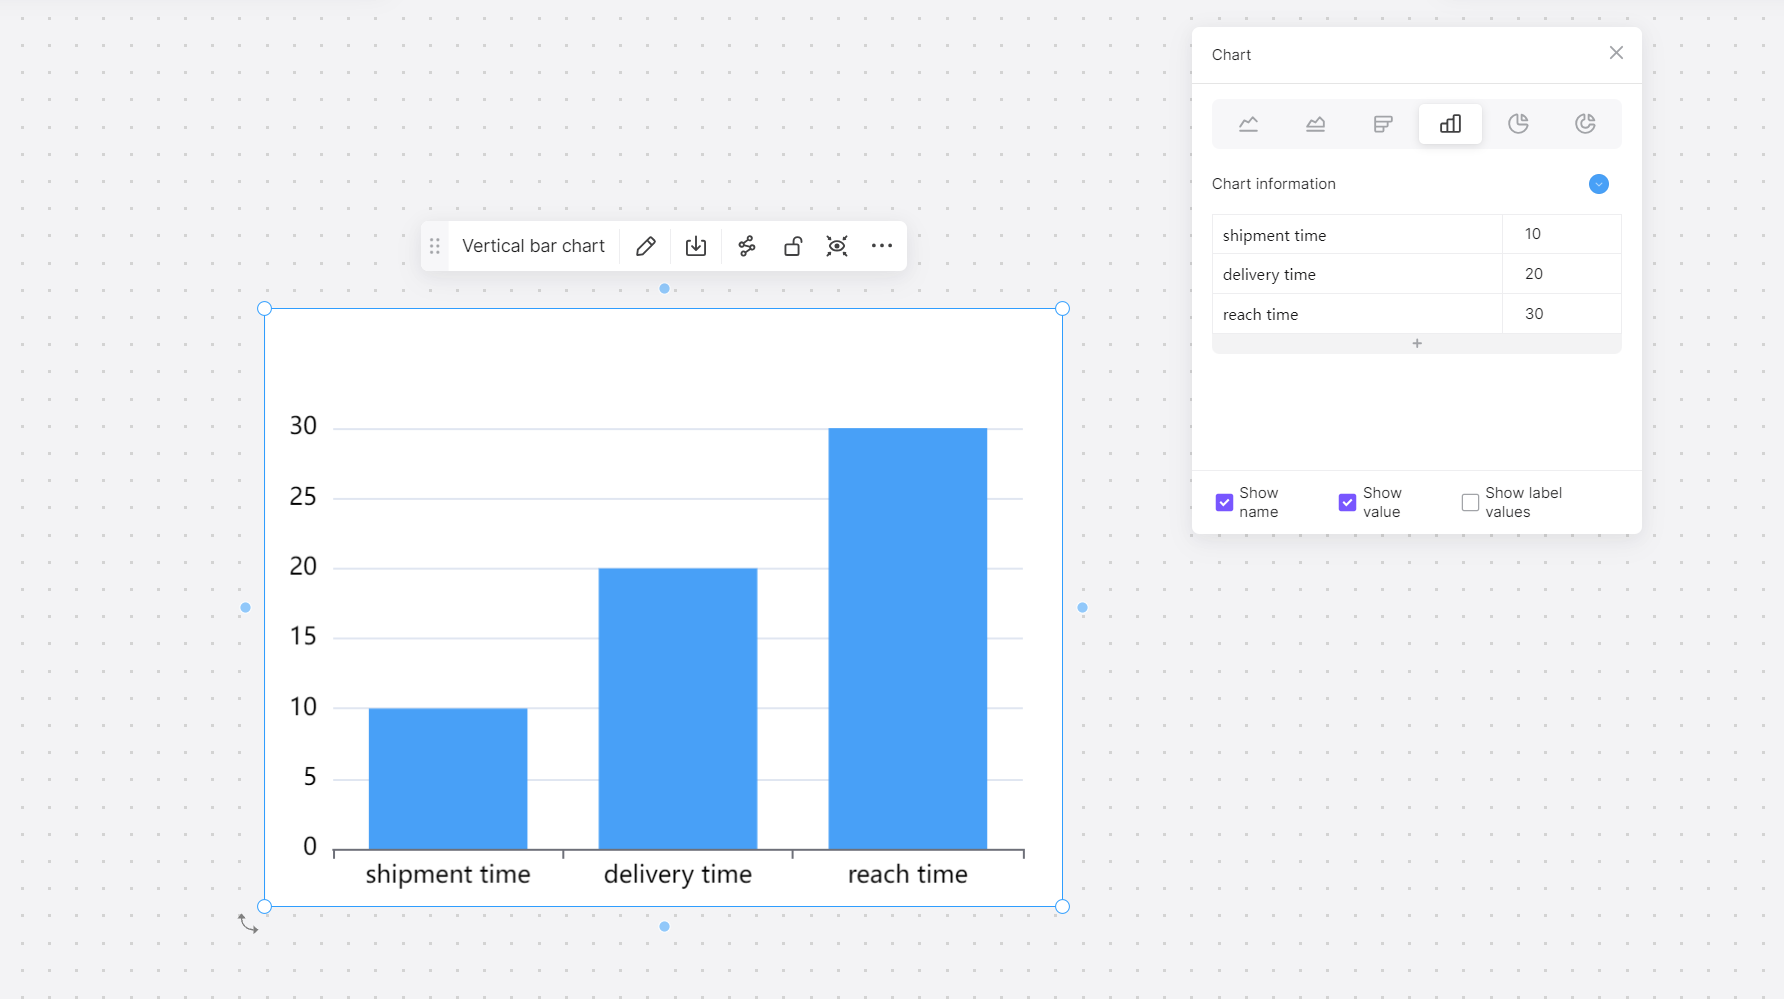
- Enter the relevant data you want on the top right editing page to create or edit your percentage bar chart. You can customize the colors, shapes, types and other formatting options to beautify the chart.
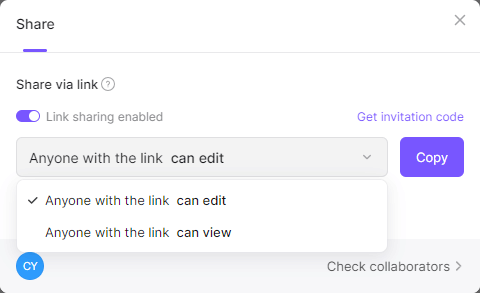
- Click on the "Share" button to share the chart with other users, or save it as a picture or some other format you want.
How to Choose: Make a Bar Chart in Excel or in Boardmix
Choosing between Excel and Boardmix for creating bar charts depends on your specific needs and preferences. If you require a simple, straightforward solution and are already familiar with Excel, it may be the best choice for you. However, if you need more advanced features, real-time updates, or want to create complex or interactive charts, Boardmix is the best bar graph maker for you.
One of the main advantages of using Excel for bar chart creation is its ease of use and accessibility. Excel is a widely used spreadsheet software that is often pre-installed on most computers, making it readily available for many users. Additionally, its integration with other Microsoft Office applications allows for seamless data sharing and analysis.
However, there are some limitations to using Excel for bar chart creation. One major drawback is the limited design options compared to specialized tools like Boardmix. Although Excel offers a wide range of chart types and customization options, it may not provide the level of control and flexibility required by some users.
On the other hand, Boardmix offers several advantages over Excel for bar chart creation. One major benefit is the ability to create real-time updates, which allows users to view the most recent data instantly. This can be extremely useful for tracking trends or monitoring performance over time. So if you want to customize a more complex bar chart, give Boardmix a try!


