

If you're familiar with causal loop diagrams, you already know they can be a great way to model complex systems. To put it simply, in a casual loop diagram, you can see how factors within a system interact to create outcomes. It can help you understand both how and why certain events happen.
Want to know more about the casual loop diagram? Keep reading.
What Is a Casual Loop Diagram
If you're new to causal loop diagrams or have never heard of them before, here are some basics:
A causal loop diagram is a type of flowchart that illustrates the relationships between variables in a system and helps you identify how changes in those variables will affect other variables.
It's used to understand the dynamics of a system, whether it's a physical system or an abstract one, like a software application or a social network.
The main purpose behind using a causal loop diagram is for planning purposes—you can use them to plan out what needs to be done next and which steps need taking care of first before moving on to the next phase of your project or goal.
Causal loop diagrams are also known as a kind of systems diagrams, arrow diagrams, or causal maps.
Purposes of a Casual Loop Diagram
There are many reasons why people use causal loop diagrams, but they all come down to two main goals: understanding and improving things. The first goal is to understand how something works and why it happens in order to make things better. The second goal is to improve something by making it more effective or efficient, which often involves making changes or improvements.
Causal loop diagrams can be used for a variety of purposes, such as:
- Understanding how things work and why they happen.
- Explaining your reasoning and decisions to others.
- Making changes or improvements in something that already exists.
- Creating new things and improving them (e.g., designing a new product or service).
- Identifying the main cause of a problem (e.g., identifying what is causing customers to leave your business).
- Identifying possible solutions to a problem by exploring different causal loops.
Components and Examples of Causal Loop Diagrams
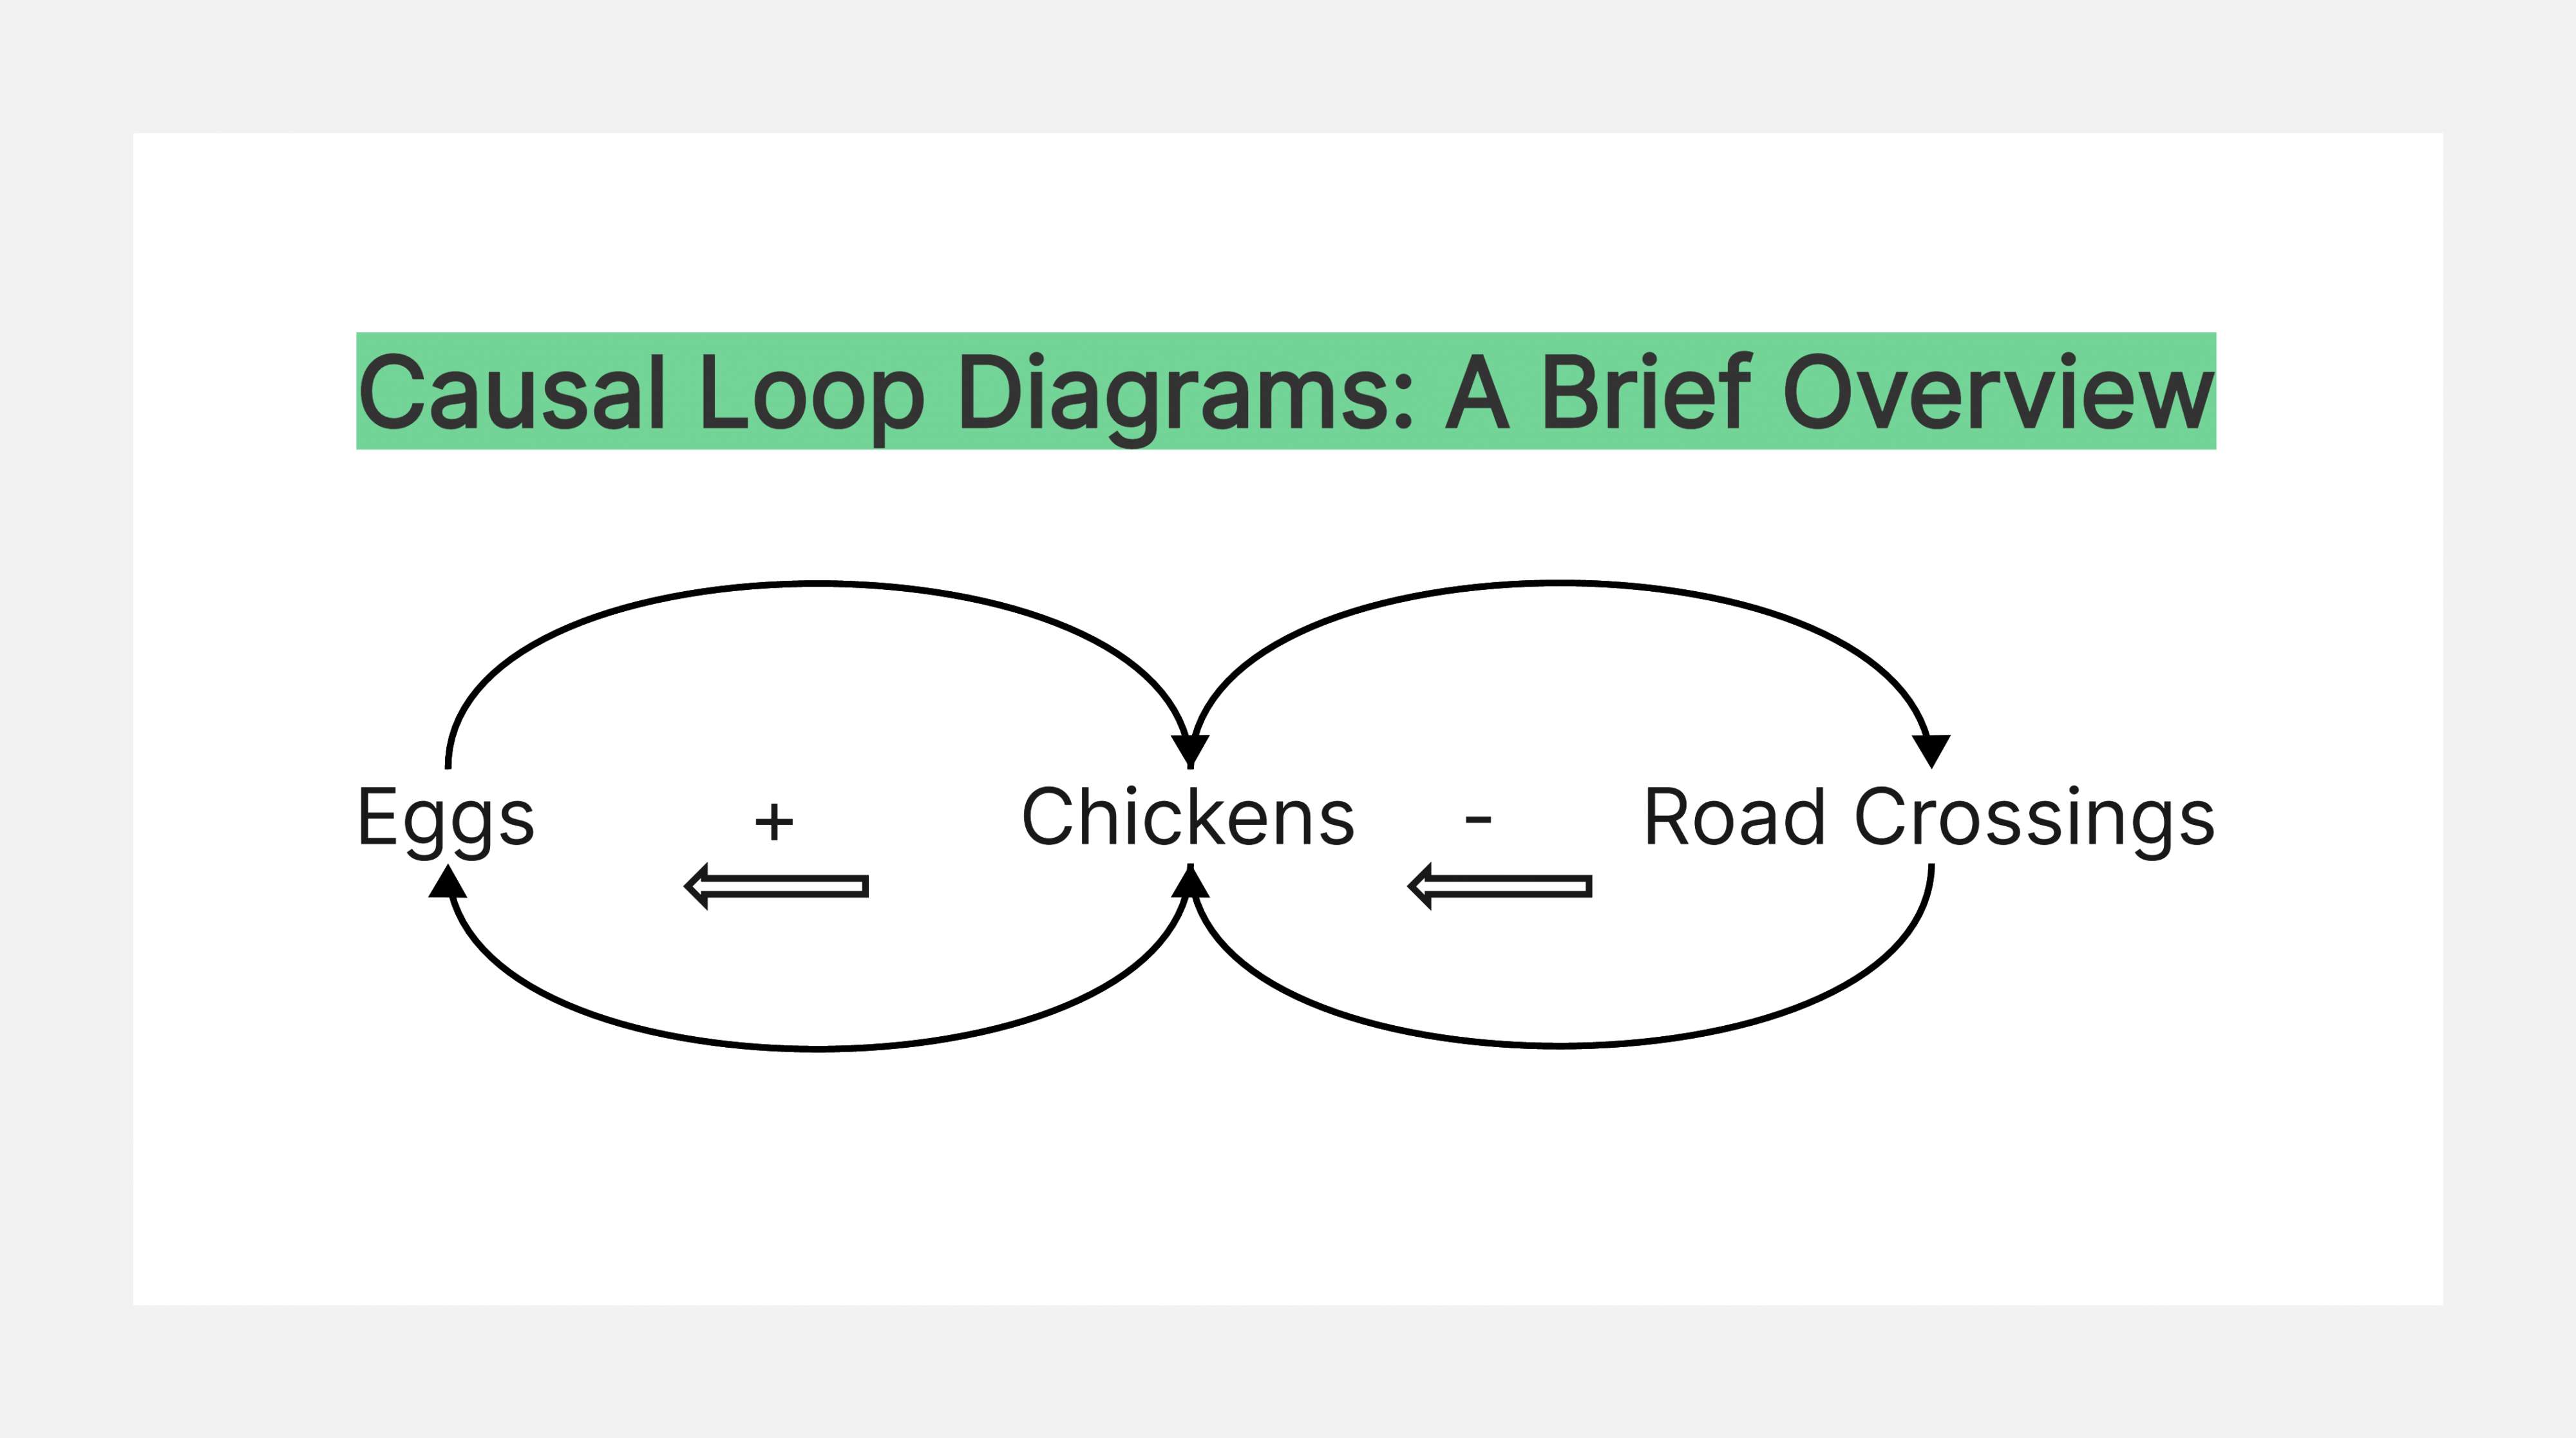
Three components make up a causal loop diagram: nodes (circles), links (lines), and labels (words). Nodes represent objects that are related; links describe how those objects interact with each other; labels explain what the object does when it interacts with another object or itself (if self-loops exist).
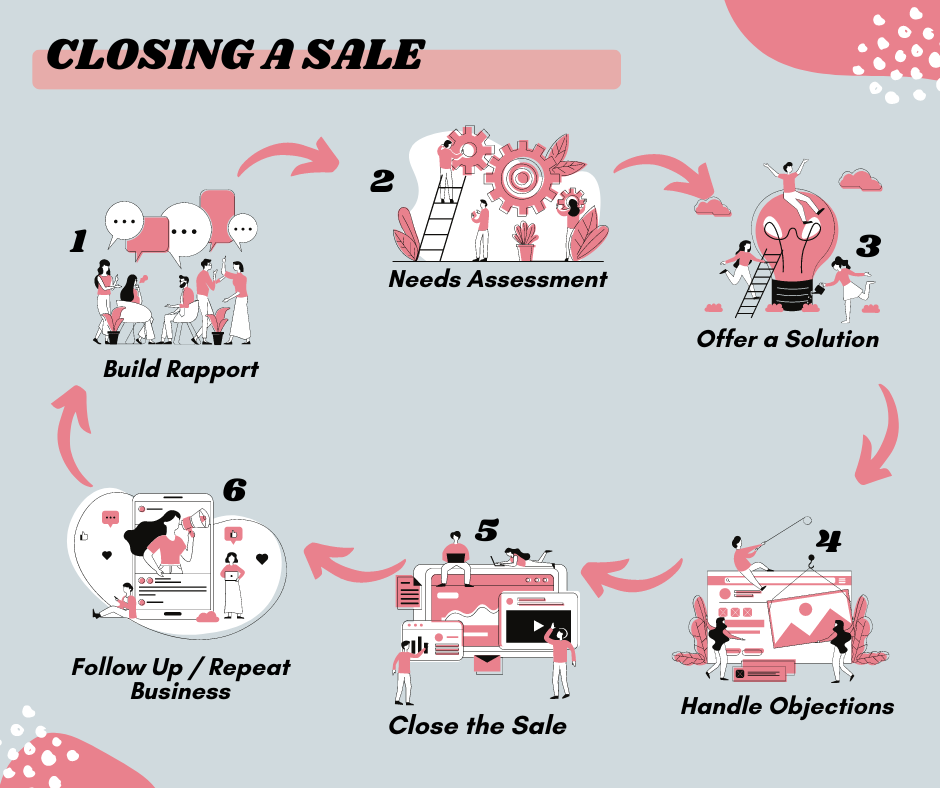
The diagram above, for example, shows a causal loop diagram of the process of closing a sale. The nodes are each step and represent what needs to happen before the next step; links are marked by lines and show the relationship between each step; labels describe the purpose of each step. This diagram can be used to break down a complex process into its simplest parts and identify ways to improve it.
How to Create a Casual Loop Diagram
To create a causal loop diagram, you need to know what data you want to include—this could be anything from sales numbers for a certain product line to the number of users on certain social media platforms.
Then you'll need to decide how many loops there are in your system: For example, if there's only one loop (like when there's only one product being sold), then each variable will go in its own circle; if there are multiple loops (like when multiple products are being sold), then each variable will go in its own circle.
Once you've got all of the variables in place, you can start connecting them with lines: Each line represents a causal loop, which means that each variable can affect (or be affected by) another variable.
What That May Look Like
For example, if you want to make a causal loop diagram of the factors that cause homelessness in your city, then these would be the steps you’d take:
- Identify all of the factors that may contribute to homelessness (such as lack of affordable housing). List the factors in a way that shows how they affect one another (if affordable housing is not available, then people may be more likely to become homeless).
- Look at each factor and determine what you can do to impact it. For example, if there are no jobs available for low-income individuals, then you could offer job training programs or set aside some funding for public works projects.
- Once you have determined what you can do to impact each factor, begin implementing your plan. Be sure that all of your efforts are carefully monitored and evaluated so that you can make adjustments as necessary.
A Causal Loop Diagram Tool You Can Never Miss - Boardmix
Causal loop diagrams are a great way to visually show the relationship between different variables and their effects on each other. They're also a great tool for helping you understand how your product or service works. If you're trying to create a visual flowchart for your product, it can be helpful to use a tool like Boardmix.

Boardmix is an online causal loop diagram tool that lets you draw and edit your diagram, add text and links, add colors and images, and share and work with others. It's easy to use and super powerful, which means it will make creating your cause & effect diagrams easier than ever!
By combining the best ideas from traditional whiteboards, flipcharts, and agile software projects, Boardmix offers limitless possibilities for teams to get their work done quickly and efficiently. It makes it easy to organize your thoughts, and get updates wherever you go.
If you're looking for a way to make your business more effective and efficient, we've got just the thing. Create your next causal loop diagram with Boardmix right now!


