

When your team is working on a new system or is trying to update one, it is important to take a look at both internal and external factors. There are numerous tools and techniques to evaluate everything that might affect the outcome. A context diagram is one of the tools that helps you keep track of all the external factors that interact and affect your system. If you take a look at a context diagram example, you will understand what a useful technique it really is.
Therefore, if you are searching for tools that will boost your team and will guarantee the success of your software design, you can incorporate a context diagram into your process. In this article, you are going to learn what this tool is and view 3 context diagram example to help you understand its use.
What Is a Context Diagram
In essence, a context diagram is a visual representation of the system and the way it interacts with all of its external factors. To make this explanation simpler, it consists of a set of shapes that connect with the use of arrows. This way, you can quickly view the factors surrounding the system and what their relationship is like.
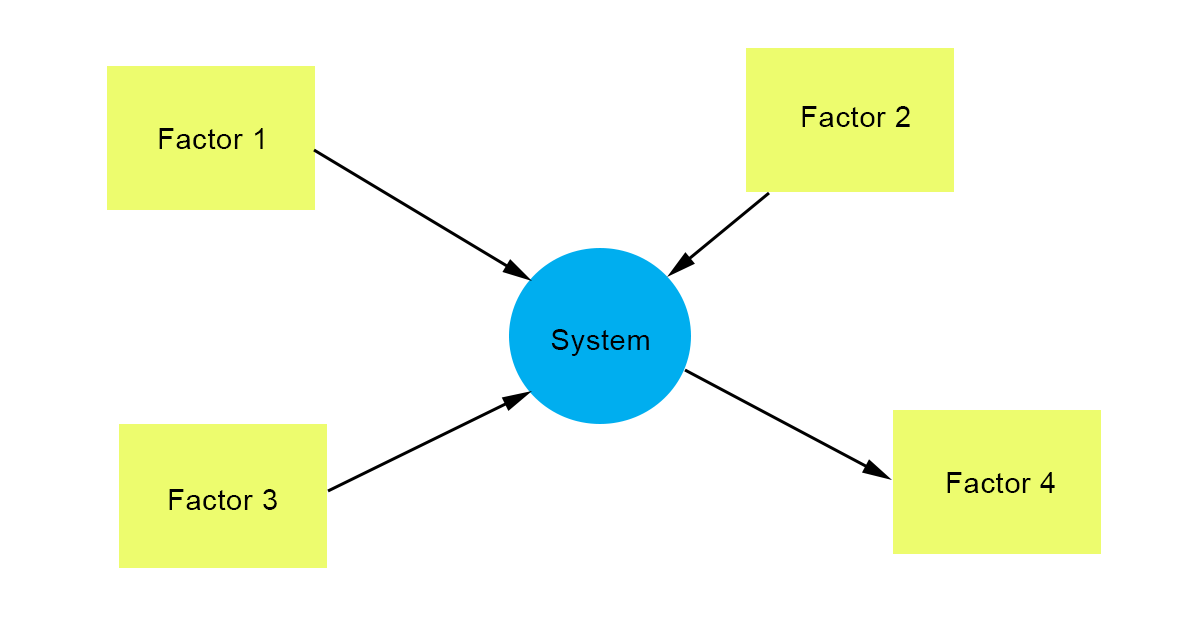
Figure 1. Context Diagram Example
The main elements that you can find in any context diagram example are the system, the external factors, and the data flows. Each one of these is noted by a different shape that distinguishes it from the rest. The point of this tool is to highlight the relationship between these shapes through a visual representation of their interaction.
As you can see in the context diagram example (Figure 1), this tool permits you to view at a glance all the factors that you need to keep in mind. You will also find this tool referred to as the Level 0 data flow diagram.
Pros and Cons of a Context Diagram
Taking all of the above into consideration, it is easy to understand that a context diagram is a truly useful tool. Nevertheless, it would be a good idea to take a look at its advantages and disadvantages in more detail.
Comparison Between the Context Diagram and Flow Diagram
Taking a look at any context diagram example, you might see some similarities between this tool and the flow diagram. In reality, a context diagram is a simplified version of the flow diagram, and for this reason, it is also called a Level 0 DFD.
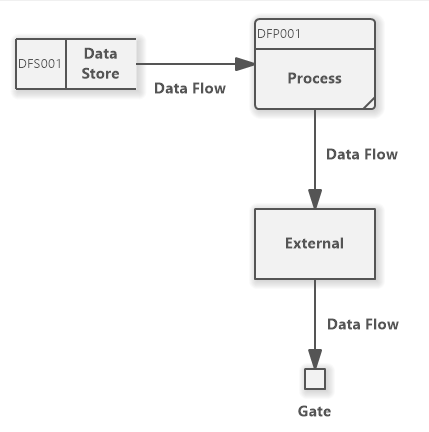
Figure 2. Data Flow Diagram Example. Source: Software Ideas Modeler
By comparing the context diagram example (Figure 1) and the data flow diagram example (Figure 2), their connection becomes apparent. However, their difference gets also highlighted.
In more detail, the data flow diagram is more detailed compared to the context diagram. The most important thing that is missing from the last is the data storage element. A data flow diagram always includes a process/function, an external entity, a data store/storage, and the data flow.
Therefore, it becomes easy to understand that the main focus of the data flow diagram is the way that information flows within the system. By simplifying this diagram and noting all the processes and data storage with the same symbol, you will get a context diagram example.
Create a Context Diagram Step by Step
After discussing the theory of the context diagram, it is time to explore its components and how to create one. Then, it will become clear to you how to create a context diagram of your system.
Learn About the Basic Component
Before you start designing a context diagram example, you must understand the basic elements that appear in the sketch. As we have already mentioned, these are the system, the external factors, and the data flows.
In more detail, the back components of a context diagram are the following:
- The system – the system is noted by a circle, which is usually placed in the center of the context diagram.
- The external factors – every factor that is outside of the system is placed in squares and rectangles around the system’s circle. To make the diagram easier to understand, make sure that note what each rectangle represents.
- The data flow – the system and each factor are connected by the flow lines, which are indicated by arrows. The arrow can either come from the system to the external factor, or from the external factor to the system. This way, you can view how they interact and affect each other.
All of these components are enough to showcase the interactions between your system and its external factors. You can also write beside every shape more details that will help your team get a better understanding of these relationships.
Tips for Creating a Context Diagram
If you want to try creating a context diagram example for your team, then you must follow some simple rules. This way, you can rest assured that you have created a diagram with all the information needed. Here are some tips to help you design a context diagram example:
- Place your system at the center of your screen to build your diagram – the first thing that you must do is create a circle and place it at the center of your canvas. This will indicate your system.
- Note all external entities that interact with your system – then, you must take the time to identify all the external factors that play an important role. These will be indicated by the various rectangles that you will place around the system’s symbol.
- Recognize how the data flows between your system and the external factors – your context diagram wouldn’t be complete without noting how the elements interact with each other. Make sure that the arrows showing the data flows are pointing in the right direction.
- Frequently evaluate your context diagram – creating this diagram isn’t just a one-time thing. You also need to revisit it and evaluate whether these interactions still stand or if there are some new ones that you need to add.
- Share the result with every team member – lastly, you are ready to share your diagram with your whole team, and even the stakeholders. By selecting the right online tool, you can quickly share the file and receive feedback.
Create a Context Diagram with Boardmix
Even though creating a context diagram example shouldn’t be that difficult, the process will become so much easier and more intuitive with the right tool.
Boardmix is an online whiteboard tool that is perfect for creating any diagram you might need. For instance, it is ideal for a context diagram, flow chart, user story map, and organization chart among others.
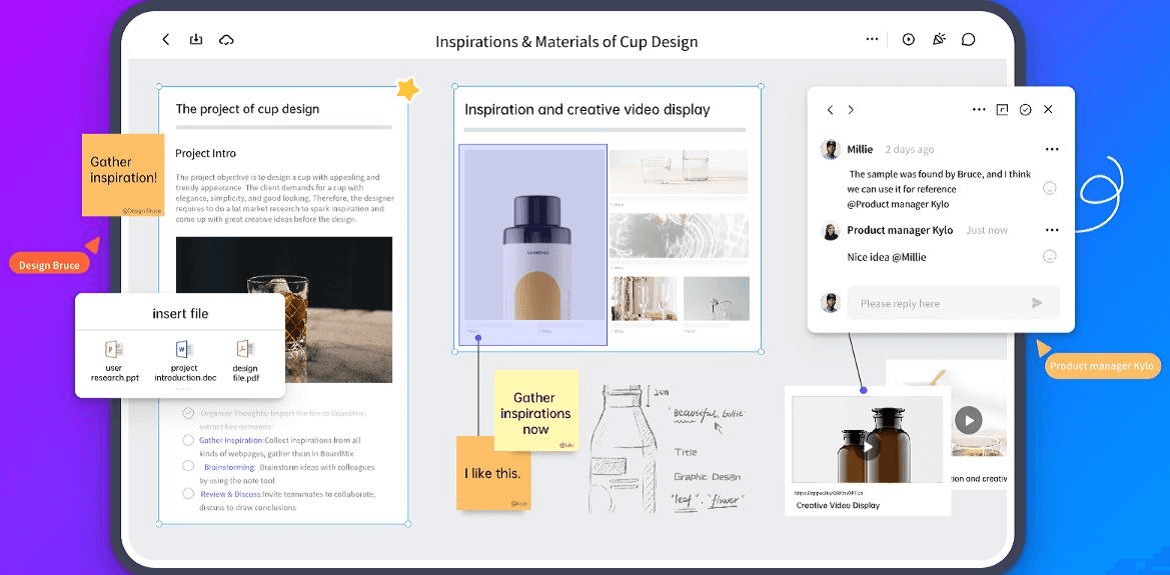
What makes Boardmix a great choice for your team is that focuses on collaboration. Every board and diagram created on this platform is easily accessible by all team members. Therefore, anyone can leave feedback, make changes, and attach new files. All these interactions are shown in real time, thus making it easier for team members to work together and brainstorm.
3 Classic Context Diagram Examples
To better understand what a context diagram is, we are going to take a look at three classic examples of it. This way, you can have an idea of what you need to include in the context diagram example that you will propose for your system.
Example 1
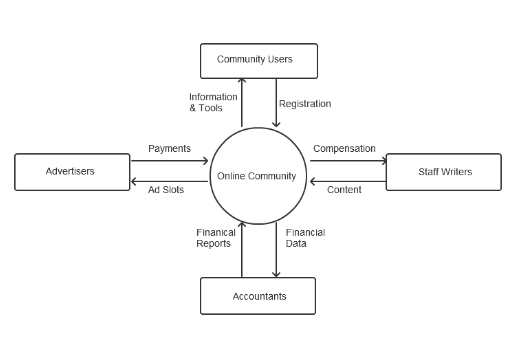
Figure 4. Example of an Online Community. Source: Modern Analyst
The first example shows you the diagram where the system is an online community. On it, you can see all the external factors and the interactions between them. As you can see, you can also add details to indicate the data type that flows between the system and each factor.
Example 2
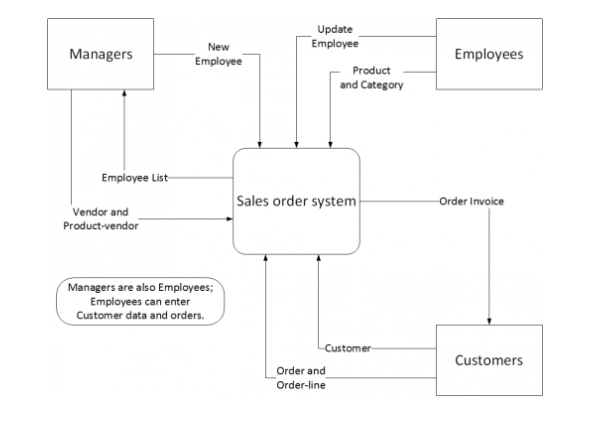
Figure 5. Example of an Online Store. Source: University of Waterloo
The second example is the diagram of an online store. As you can see in this figure, an external factor can influence the system in more than one way.
Example 3
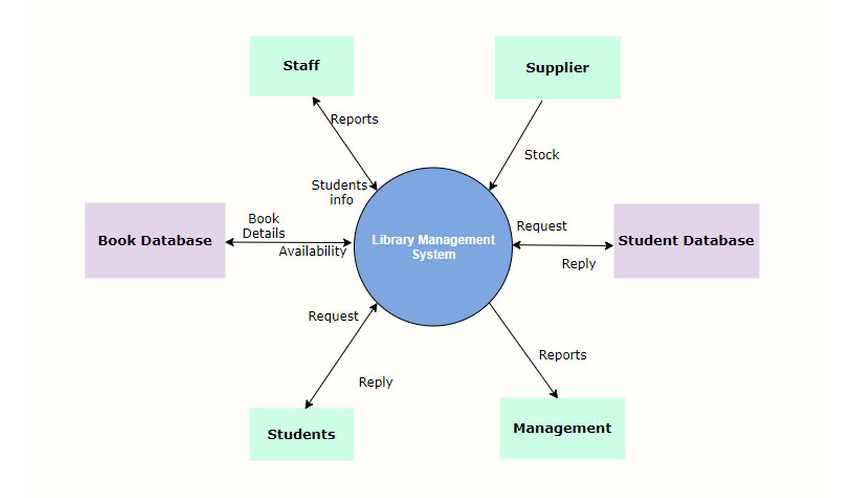
Figure 6. Example of a Library Management System. Source: Mind on Map
The third example shows a context diagram designed for a library management system. In this case, it is clear to see how you can expand it to meet your system’s requirements.
The Bottom Line
Regardless of the system you are working on, you need to create a context diagram example when needs arise. This tool will help you recognize how your system gets affected by all external factors, which will improve its overall quality. Boardmix is the perfect tool to create and share your context diagrams quickly and effortlessly. Try the platform and discover its collaborative features that will bring your team together.


