Entity relationship diagrams – more commonly known as ER diagrams or even ERDs – are frequently used visuals that depict the relationships among various entities (or sets of entities) within a database.
If you are familiar with creating ER diagrams online, you may know the various tools available to help you achieve your goal. But, today, we are introducing the latest diagrammatic tool that can help you create all sorts of ER diagrams for banking systems for free.
We will also talk a little bit about how ER diagrams are made and offer a few examples of what they look like. If you are new to creating ER diagrams or looking for an innovative free ER diagrams maker, this article is definitely for you. Read in to learn more.
Part 1. What is an ER Diagram?
As mentioned in the introduction above, ER diagrams are created to classify the various data-related entities and relationships within an information system.
More often than not, ER diagrams are used in the development and management of banking databases. Their aim is to delineate the structural principles and flow within databases.
The principal elements of an ER diagram are attributes, entities, and relationships represented by ovals, rectangles, and diamonds respectively within the diagram.
With that in mind, you have to make sure you do not confuse ER diagrams with flowcharts. They look quite alike in many ways, but ER diagrams have a more specific purpose for their presentation and a separate set of symbols, annotations, and shapes.
Part 2. What are the 3 Main Components of a Banking System ER Diagram?
Like all other types of complex visuals, an ER diagram has multiple key elements that come together to create its form and organize the information in a particular manner.
Understanding these elements – or ER diagram components – is imperative if you want to successfully build ER diagrams online.
These elements or components are (1) entities, (2) attributes, and (3) relationships.
- Entities are the primary building blocks of an ER diagram. They may represent persons, events, objects, or even ideas, depending on the nature of the ER diagram you are aiming to create. Entities in ER diagrams are drawn as rectangles.
- Attributes are the various characteristics – or traits – of an entity relevant to the ER diagram you may be drawing. These entity attributes are often categorized as (a) composite, (b) simple, or (c) derived. Of course, an entity may be represented with multiple attributes. Attributes are depicted as ovals or circles within ER diagrams.
- Relationships are the final component of an ER diagram, and they show how any two entities within an ER diagram relate to each other. When any two elements are connected via lines, we put a label on these lines to declare their relationship. Or we can use various types of line segments to identify the nature of these relationships.
Part 3. What is the Best Online Tool to Draw an ER Diagram for Banking Systems in 2023 (with Examples)?
Users who are new to ER diagrams may want to know how to create an ER diagram for banking system easily. This is where Boardmix comes into the picture.
- Boardmix is a multi-purpose online diagram builder that allows you to create ER diagrams for banking systems and many other purposes.
- You can use Boardmix to create all sorts of complex diagrams on online collaborative whiteboards and share your work with your team in real-time.
- When it comes to drawing ERDs, Boardmix is equipped to meet all your diagramming needs.
ER Diagram Examples (Built Using Boardmix)
Here are a few ER diagram examples that will work as a demonstration of Boardmix’s versatility and its comprehensive library of tools and features.
Example #1: Banking Database Management ER Diagram
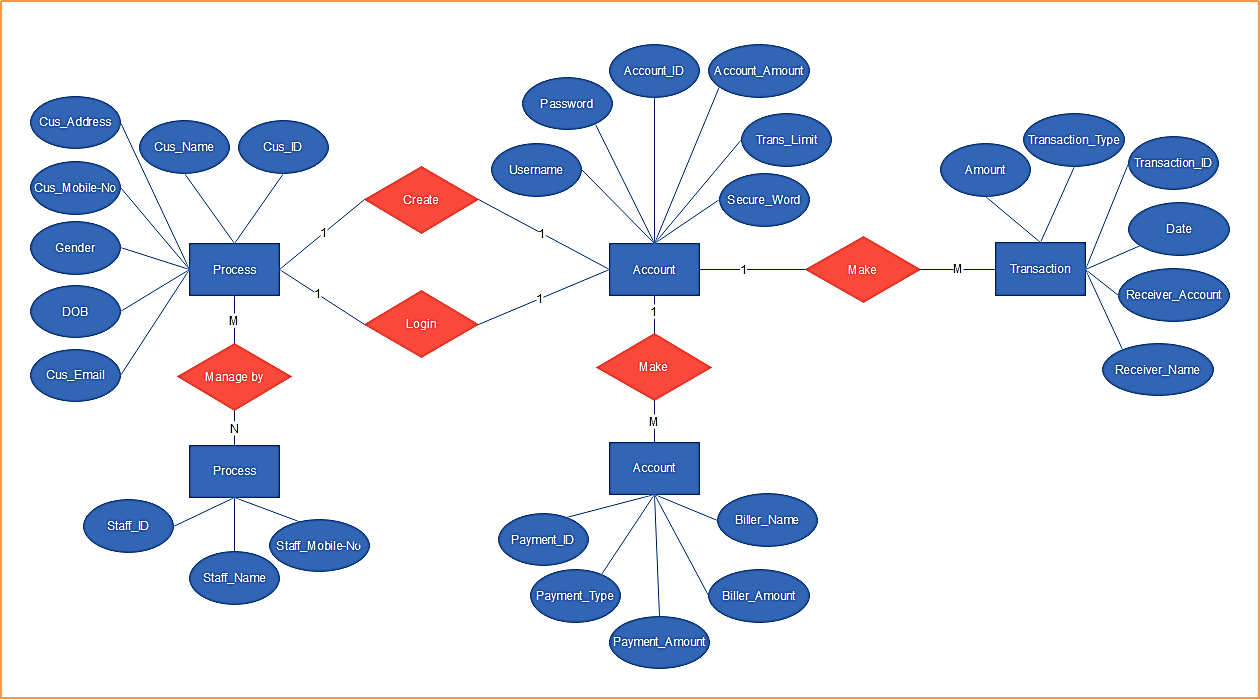
ERDs are most commonly used in financial services. These places, such as banks, have complex service processes that require multiple data clusters connected through sophisticated information management protocols.
Below is a specimen of how a banking system ER diagram may look.
Example #2: Human Resources Management ER Diagram
You can draw an ER diagram for your HR team using Boardmix. While you can build more complex ERDs depending on the nature of the HR records for which you are creating the diagram, the following example should suffice in demonstrating Boardmix’s diagrammatic capabilities.
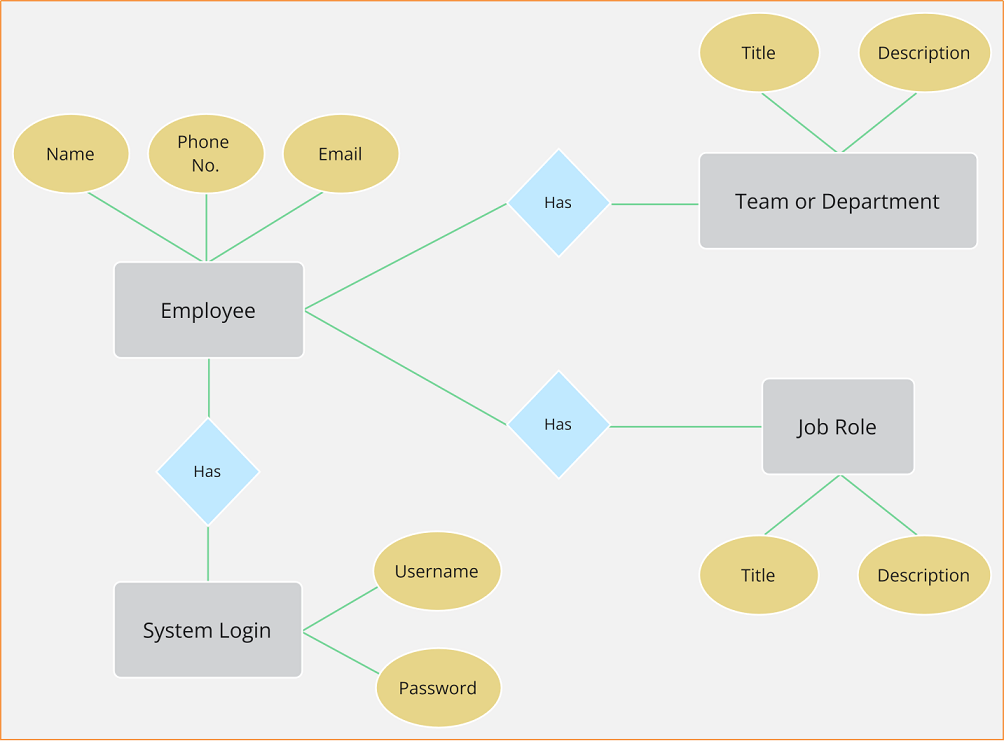
This basic human resources management ER diagram lays out a blueprint for an employee’s system login process and access to information.
Example #3: Database Management System ER Diagram
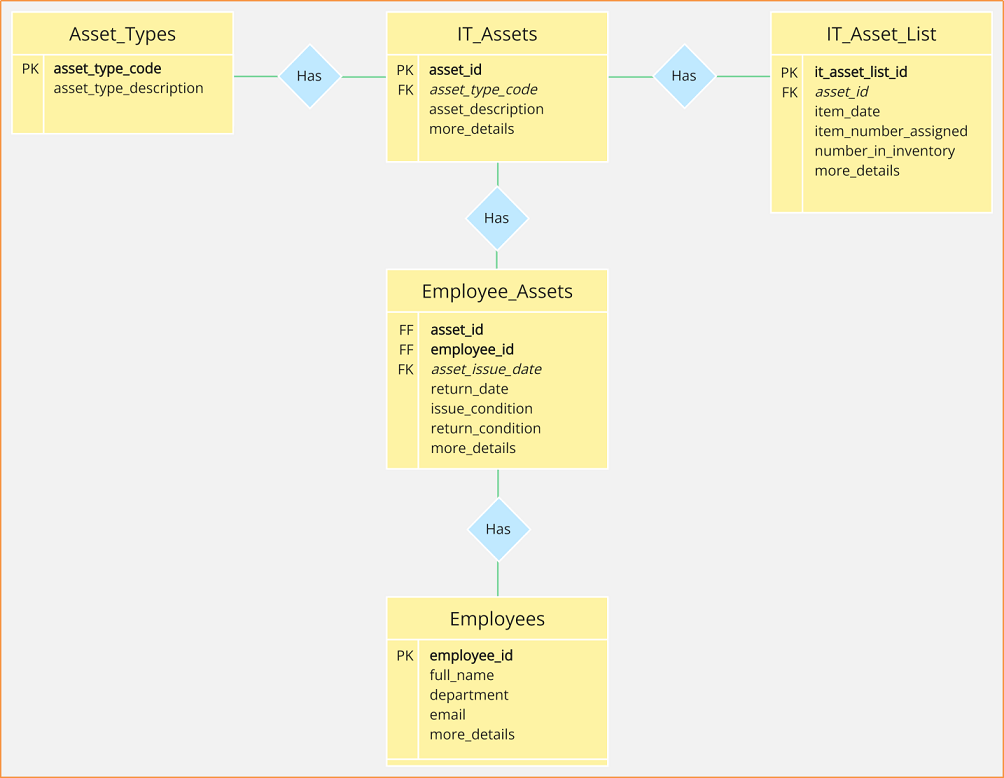
One of the most common applications of ER diagrams lies in constructing database management systems, as said earlier.
Here’s an example of an IT inventory database ERD that classifies the various types of IT assets in an organization and delineates a database that accounts for the various IT-related assets, including those issued to each employee.
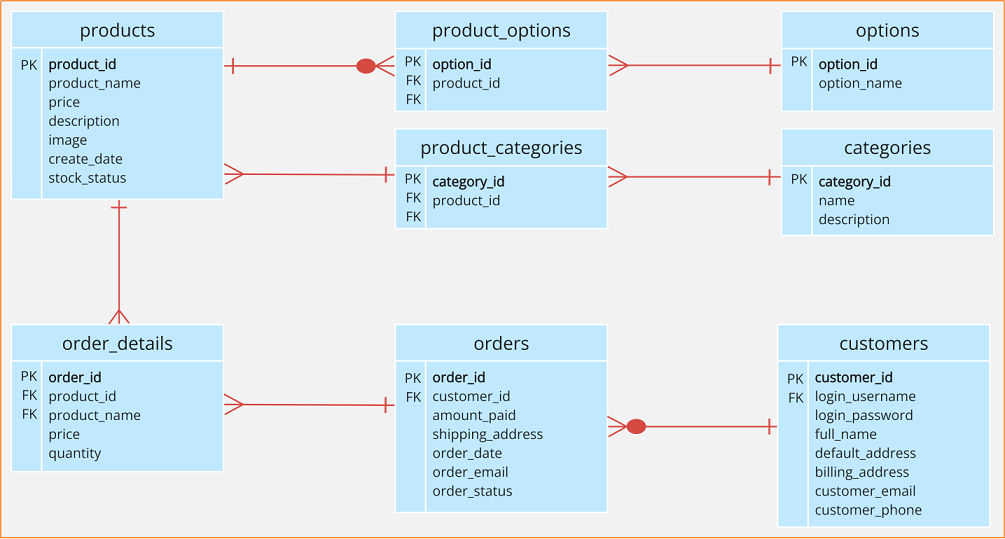
Example #4: E-Commerce Database ER Diagram
If you dig deeper into DBMS ER diagrams, you will find ERDs are used for outlining many different types of databases and their management systems.
For example, the example diagram below shows us how an e-commerce database management may be constructed with an ER diagram.
These examples give you a clear picture of how Boardmix can help you make sophisticated ER diagrams online for free.
That’s right. In case you didn’t know, Boardmix allows you to make all these ER diagrams and much more for free.
Conclusion
To conclude, ER diagrams are an integral part of many teams’ routine and project-based tasks. The visuals these diagrams produce can lead to the construction of crucial information management protocols.
If you have been assigned the task to create your first banking system ER diagram online, now you know you can trust Boardmix to assist you in the process. All you have to do is sign up for a free account and get instant access to the virtually limitless features and tools Boardmix has to offer.


