You can create a flowchart in Google Docs on a computer with Insert → Drawing → New. Add shapes for actions and decisions, connect them with arrows, then save the drawing into your document. The eight steps below show this desktop-browser workflow and how to reopen the drawing for changes. For a larger diagram that several people need to discuss, a shared flowchart canvas is another option.
Part 1. How to Create a Flowchart in Google Docs
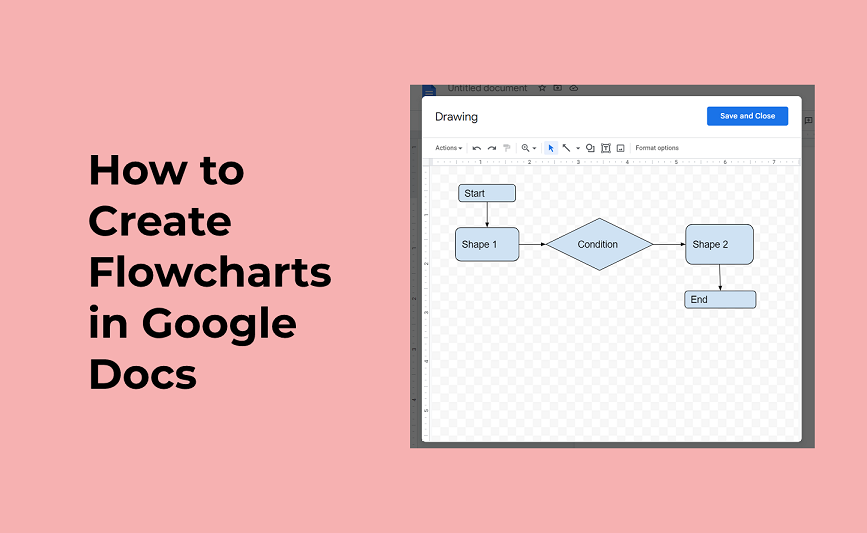
Open a document in Google Docs and use Insert → Drawing → New. Google’s drawing instructions explain the shapes, line types and text controls. The screenshots below demonstrate those controls with draft labels; use the sample process below to give your own chart a complete meaning.
Plan the flow before you draw: an article-approval example
Suppose you want a short flowchart in an editorial procedure document. It starts when an article draft is ready for review and ends when the approved article is published. Keep the review steps in the diagram; research and later performance analysis are outside this example.
- Start: Draft ready.
- Process: Review draft.
- Decision: Approved?
- Yes: Publish article → Published (end).
- No: Revise draft → Review draft again.
The No route is a return loop, not a second successful outcome. Keep the revised draft in review until it is approved; do not connect “Revise draft” straight to “Published.” If your real workflow also permits cancellation, add a separate, clearly labeled exit for it.
Step 1. Go to https://docs.google.com/document/ and click Blank to start a document, or open the procedure document that needs the flowchart. Place the cursor where the drawing should appear.

Step 2. Open Insert → Drawing → New. The drawing window opens over the document. You will arrange the flowchart inside this window, then insert it back into the document.

Step 3. Open the Shape menu in the drawing toolbar and choose a shape. Use rounded start/end shapes, rectangles for actions and a diamond for a decision.
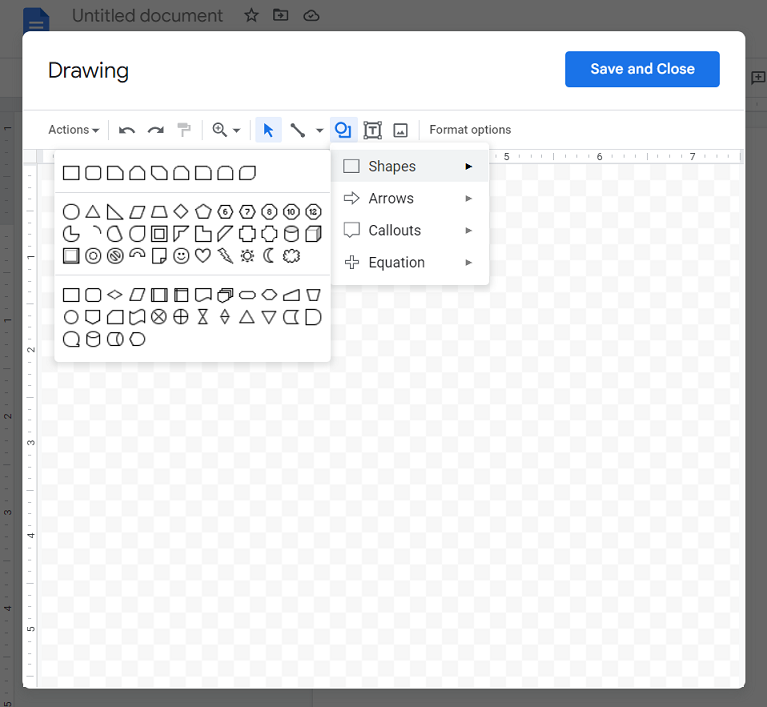
Step 4. Drag on the canvas to size each shape. For the article-approval example, place Draft ready at the top, Review draft beneath it, and the Approved? decision below the review. Leave room for Publish article and Published on the Yes route and Revise draft on the No route.
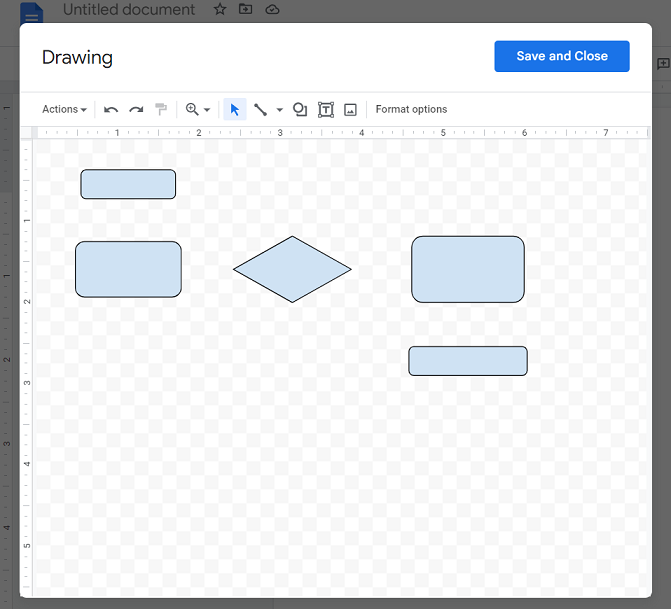
Step 5. Double-click an enclosed shape and type its label. Replace placeholders such as “Shape 1” and “Condition” with actions and a question. Keep labels short enough to read at the size the chart will occupy in the document.
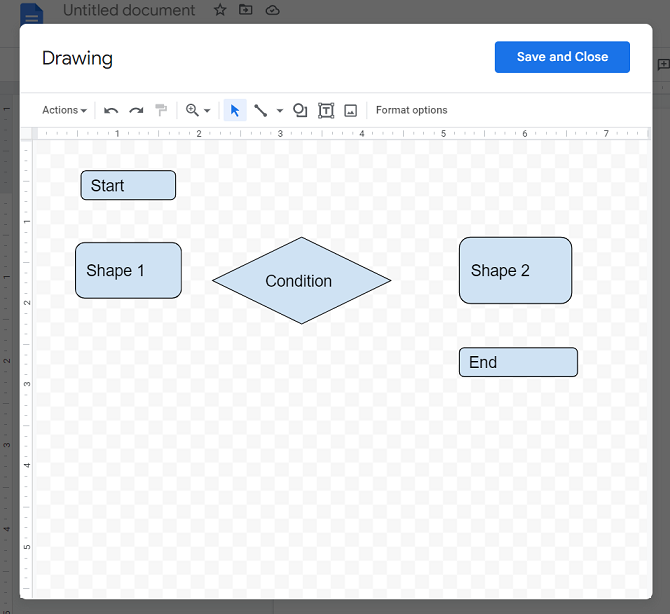
Step 6. Open the Line menu and choose Arrow. Google also provides elbow and curved connectors when a route needs to bend; choose a line type that keeps branches distinct.

Step 7. Drag between shapes to connect the process. Add both outgoing paths from Approved?, placing Yes and No text beside the appropriate arrows. Connect Revise draft back to Review draft, and connect Publish article to Published. Check arrow direction and endpoints again after moving a shape.
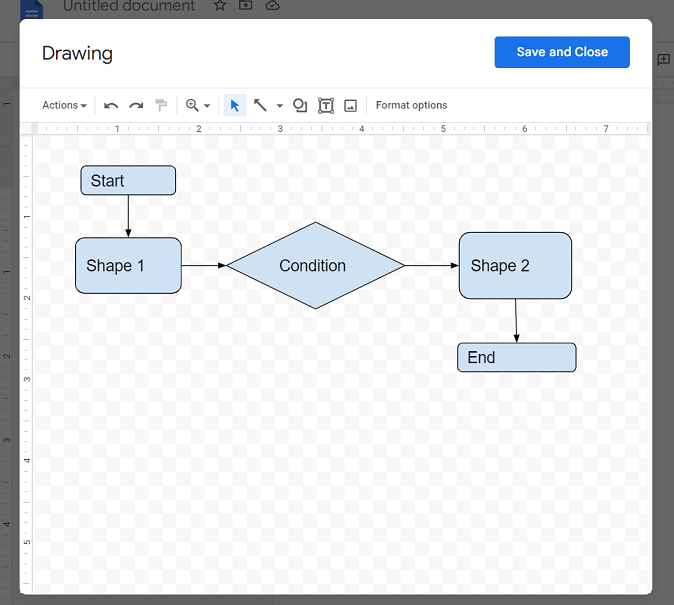
Step 8. Select Save and close to insert the drawing into the document. Check the result at a normal reading size: can a colleague read the labels and follow both branches without opening the drawing editor? You can then share the document or download a copy in an available document format.
To revise the flowchart later, select the drawing in the document and open its editing controls. Make the change in the drawing window, then save it back into the document. A diagram inserted as a flat image is different: its labels and connectors are not separate editable shapes in Docs.
Keep the diagram editable and readable
If you reuse a separate Google Drawing, choose Insert → Drawing → From Drive. Google links that inserted drawing to its source. After changing the source, select the drawing in Docs and use Update; use Unlink only when you want to stop that connection. This linked-Drive workflow is distinct from creating a new drawing inside Docs.
- Labels are too small: enlarge the drawing within the document’s usable width, shorten labels or split a long process into connected diagrams. Keep important explanations as document text beside the drawing.
- A branch goes nowhere: name its outcome or reconnect it to the next action. For the example, follow both Approved? routes and confirm that the revision path reaches Review draft.
- A colleague cannot change the diagram: check which file contains the editable source and the access granted to that person. Google’s sharing guidance distinguishes Viewer, Commenter and Editor; work or school policies can restrict sharing.
Part 2. Create a Flowchart on a Shared Canvas
Google Docs is convenient when the diagram belongs inside a document. For a larger process map, a shared canvas gives the diagram and discussion more room. Boardmix combines shapes, connectors, templates and comments in one workspace. Keep the editable board as the source if you later put an exported picture into a document.
Start from a flowchart template or a blank board. Rename the sample steps, add the Approved? decision, and connect both the publishing and revision routes. Place notes beside any step that needs an explanation, then invite a teammate to check the arrows and missing outcomes. The screenshot below shows a conditional template layout; replace its generic labels with your actual process.

Useful Boardmix options for this task include:
- Flowchart shapes and connectors for building a process on the board.
- Customizable flowchart templates that you can adapt rather than treating their sample logic as finished.
- A Free plan with 3 editable boards, up to 100 objects per board and 1 GB of storage. See the current plan comparison before choosing a workspace.
- PDF and image exports for sharing a visual copy of the diagram. PNG and JPG are image options; check the available format and quality in your workspace.
- Real-time editing and comments, with board access granted to the people who need to view or edit.
- Version history with plan limits: the current Free plan lists 10 records, while Starter lists 100.
- Other export formats, including SVG and BDX where available in the export menu. A downloadable file is not a promise that Google Docs can edit its original Boardmix objects; use a supported image for a visual copy and retain the board link for further editing.
- Other structures on the same canvas, including mind maps, SWOT analysis, timelines and organizational charts.
- Browser access for working on a diagram without installing a desktop application.

A document drawing is often enough for a small illustration. A shared canvas is useful when the flowchart grows or several people need to discuss it in context. Export an image for the document when appropriate, but keep a link to the editable board and replace the image when the diagram changes; an exported image does not stay synchronized automatically.
Part 3. Flowchart Examples to Adapt
The three illustrations below are useful for practicing flowchart reading. Trace the main path, inspect every decision and identify what still needs to be specified before adapting a chart to real work.
1. Lamp Repair Flowchart
The lamp example shows how one problem leads to successive checks: whether the lamp is plugged in, then whether the bulb has failed. Read the Yes and No labels carefully rather than treating the drawing as a list of actions.

For a diagramming exercise, add a “Lamp works?” decision after each corrective action and show where an unresolved problem goes. This completes the logic without turning the graphic into instructions for opening or repairing electrical equipment.
2. E-commerce Shopping Process Flowchart
This example separates account access, product browsing, the cart and payment options. The registration route returns to the login check, and deciding not to buy returns to product search. These loops illustrate how a customer can revisit an earlier step.
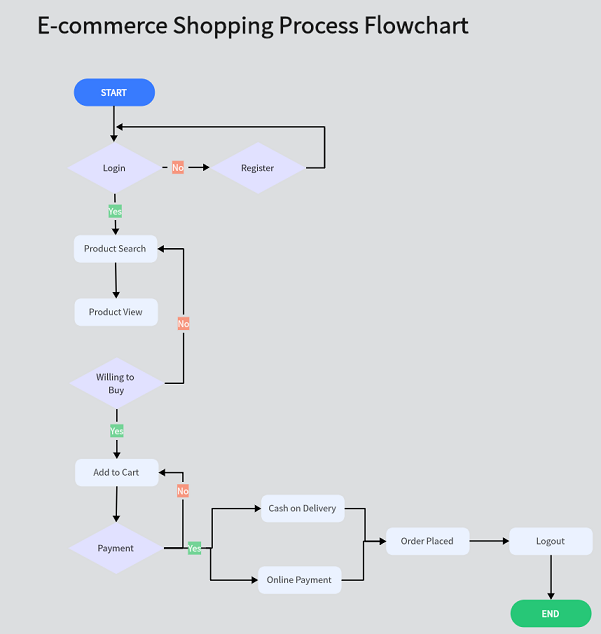
When adapting the shopping chart, turn labels such as “Login” and “Payment” into questions with explicit outcomes. Separate choosing a payment method from confirming an online payment. A cash-on-delivery order may be placed before money is collected; an online-payment failure needs its own retry, alternative-method or cancellation route. Add stock and address checks if they belong to the process you are documenting.
3. Patient Checkup Flowchart
This simplified patient-visit illustration shows registration, waiting for available staff, and later follow-up or prescription branches. It can help you practice reading a sequence and return loops. It is not a clinical triage or treatment protocol: the diagram does not represent urgency assessment or the criteria for clinical decisions.

Part 4. FAQs about Google Flowchart
Q1. Can I make a flowchart in Google Sheets? How?
In Google Sheets on a computer, use Insert → Drawing to open the drawing tool, then arrange shapes and lines and save the drawing into the sheet. Google’s Sheets drawing documentation confirms that insertion route. The drawing is an object over the sheet, not a set of cell formulas.
Q2. Is Lucidchart owned by Google?
Lucidchart is a Lucid product, not a Google product. Its Google Workspace integrations connect it with Google tools; an integration does not imply ownership by Google.
Q3. What program is best for creating flowcharts?
Use Google Docs for a flowchart embedded in a document. Use a dedicated diagramming or whiteboard tool when you need a larger canvas, reusable templates or a different collaboration workflow. Decide whether the recipient needs to edit the original shapes or only read a PDF/image, then compare the necessary formats and permissions.
Key points
Draw the main path first, add and label each decision route, then check the return paths. In Google Docs, save the drawing into the document and reopen it once to check that you can make a change. In a shared workspace such as Boardmix, keep comments and supporting notes beside the steps they explain, and keep the editable source when sharing an exported copy.