


Line charts are an essential tool for visualizing data and understanding trends. In this article, we will explore the basics of line charts, how to create them in Excel, their pros and cons, and how to choose between Excel and Boardmix for your line chart needs. By the end of this article, you'll have a clear understanding of how to create effective line charts in both Excel and Boardmix.
What Is a Line Chart
A line chart is a type of graph that displays data as a series of points connected by lines. It is commonly used to show trends or changes over time. Line charts can be used to visualize a variety of data, including numerical data, such as sales figures or stock prices, and categorical data, such as demographics or survey responses.

Line charts possess the ability to visualize trends over time, the ease of comparing different data sets, and the flexibility to customize their appearance. By understanding the key elements of a line chart and its flexible functions, you can create more effective visualizations and make better-informed decisions based on your data.
How to Create a Line Chart in Excel
Creating a line chart in Excel is a straightforward process that involves the following steps:
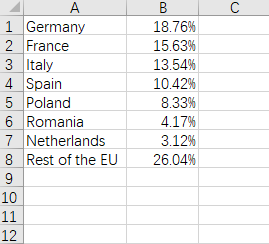
Organize your data: You should input your data in columns or rows on the Excel sheet.
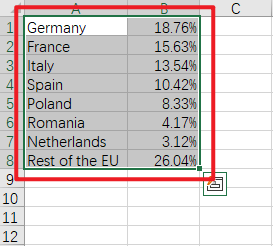
Select your data: Once your data is organized, you need to select the cells or range of cells that contain the data you want to visualize.
Insert a line chart: Click on the "Insert" tab and select "Charts" from the options.
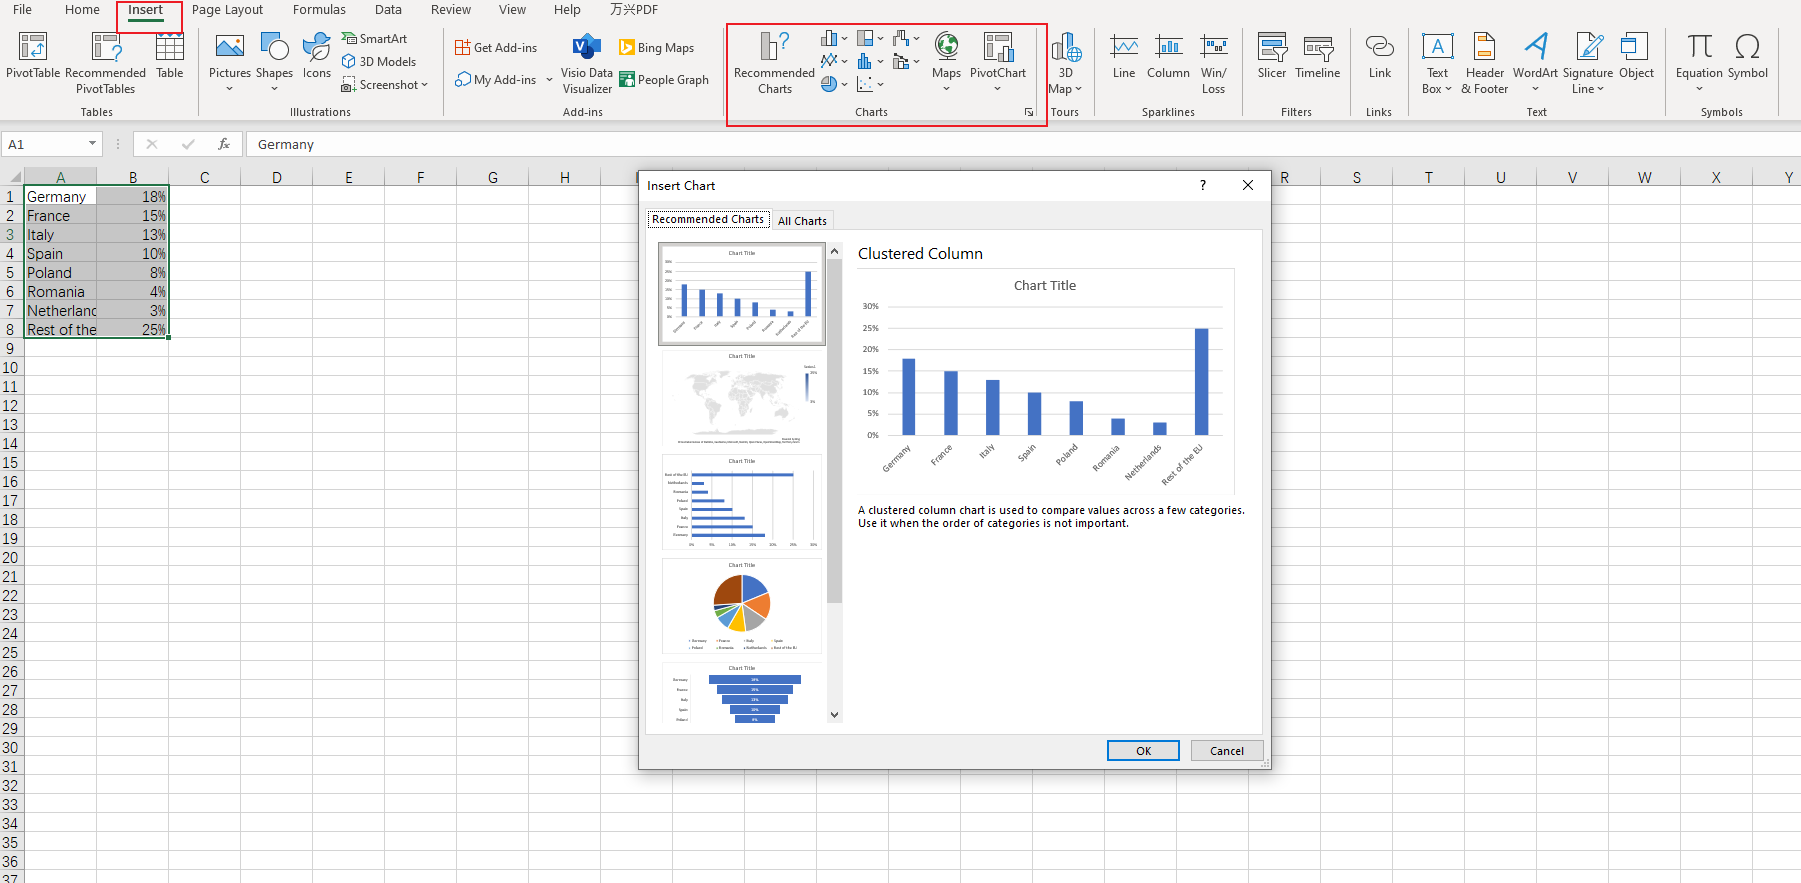
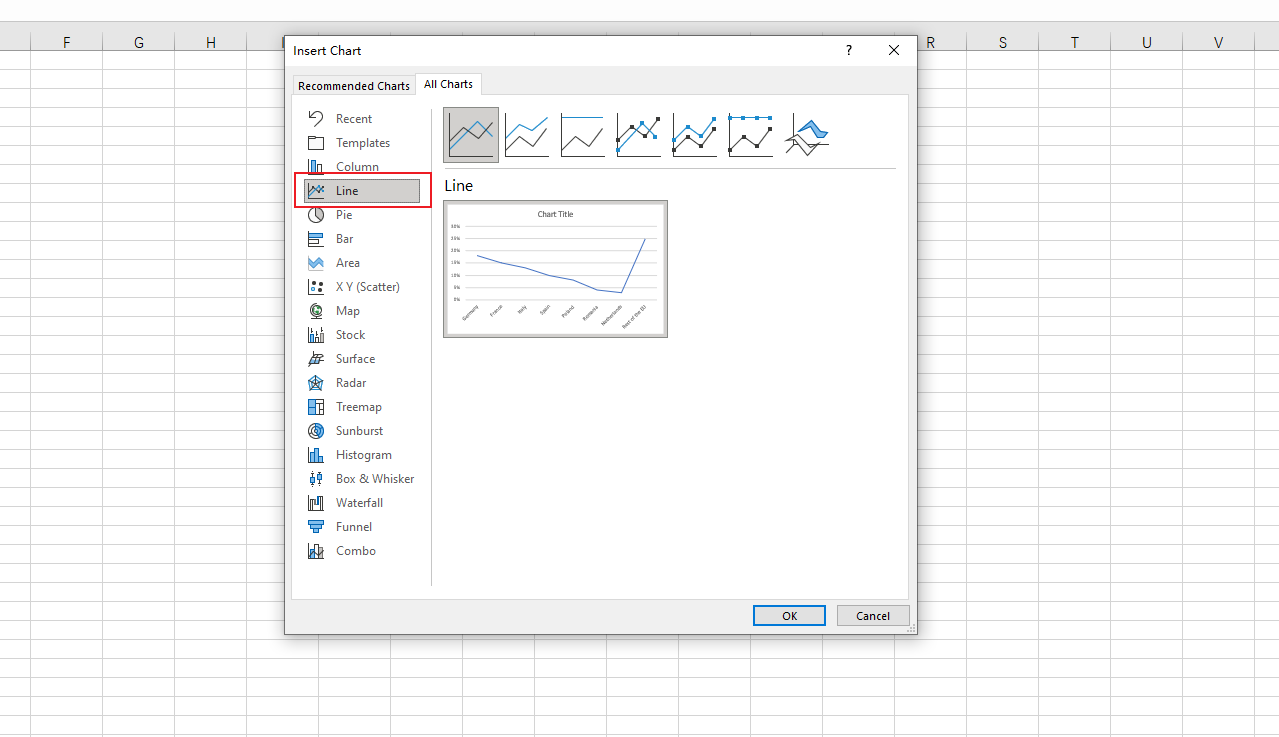
Select line chart: In the "Charts" window, select "Line" as the chart type and choose a specific line chart style from the available options.
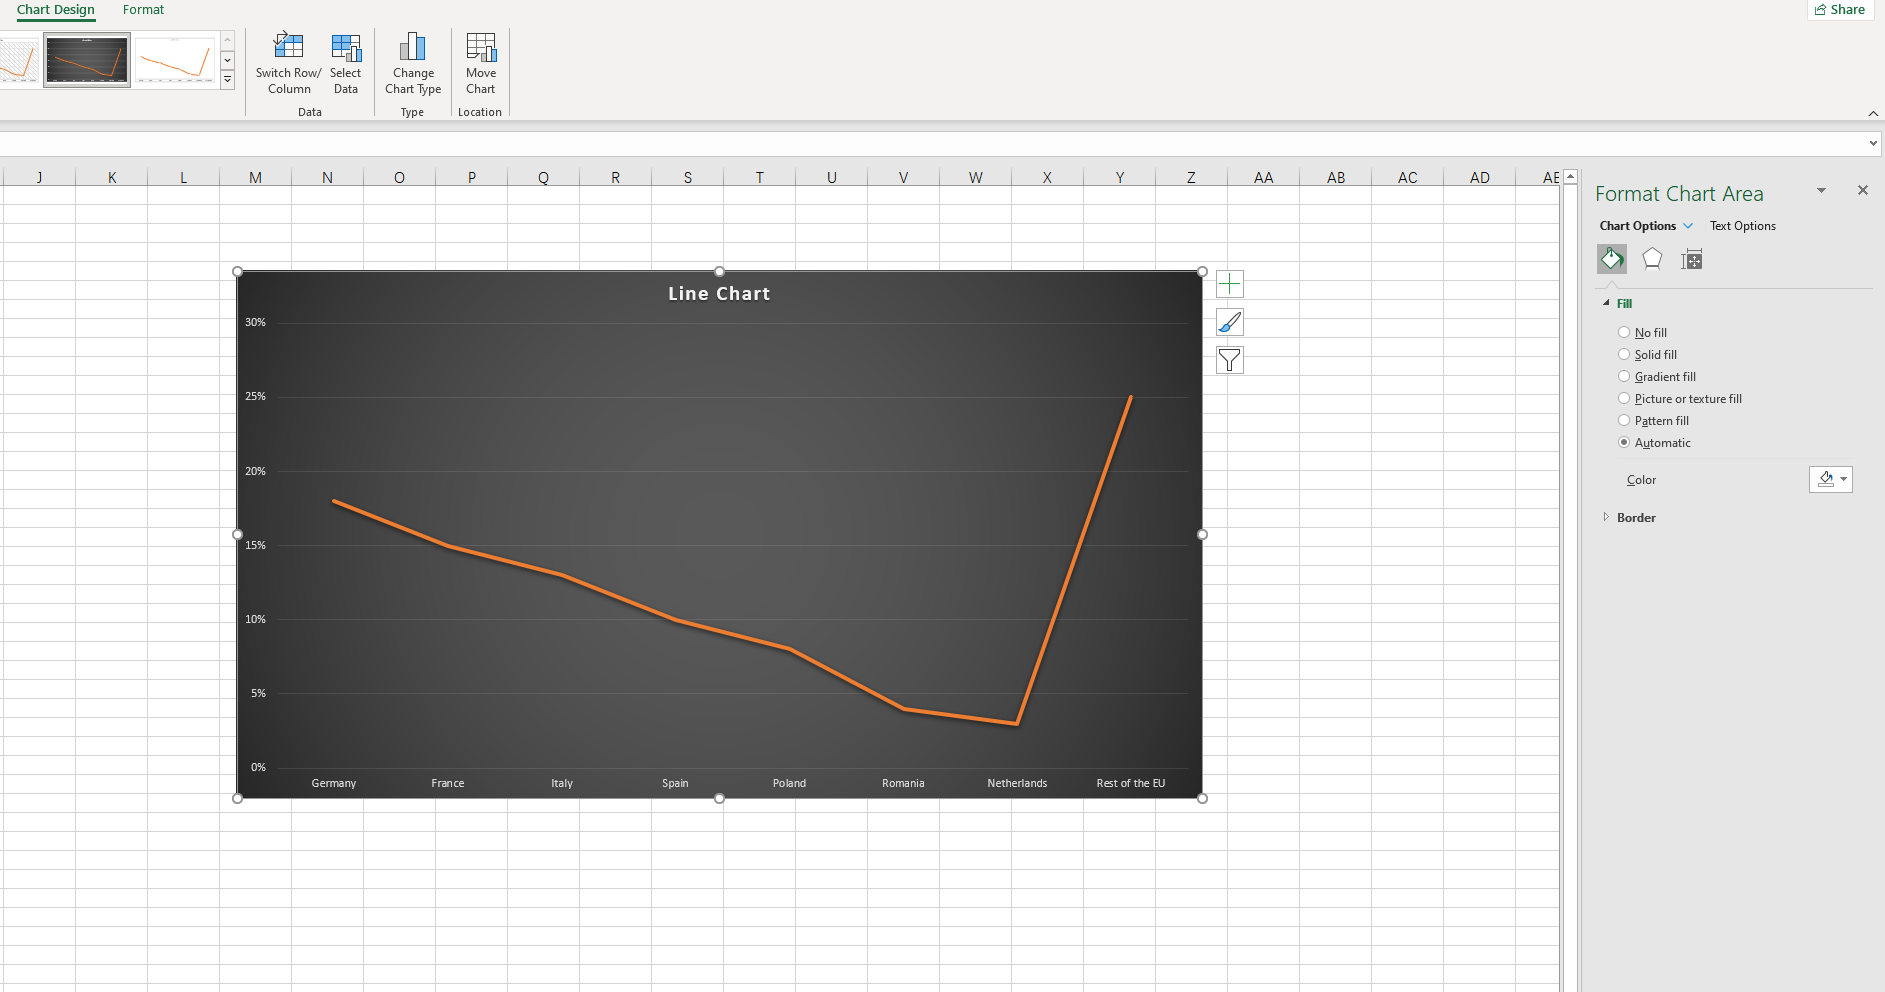
Customize your line chart: Once your line chart is created, you can customize its appearance by adding titles and labels. You can also change the line colors and style to make your chart more visually appealing.
Pros and Cons of Making a Line Chart in Excel
Making a Line Chart in Excel has several pros and cons.
Pros:
Wide range of customization options: Excel offers a variety of customization options, allowing users to adjust the appearance of their line charts to suit their specific needs.
Integration with other Microsoft Office applications: Excel is part of the Microsoft Office suite, which means it can easily integrate with other applications like Word and PowerPoint, making it convenient for creating professional reports or presentations.
Familiarity and ease of use: Excel is a widely used software, which means many people are already familiar with its interface and functions, making it easier for them to create line charts.
Cons:
Limited design capabilities: Although Excel offers a range of customization options, its design capabilities may be limited compared to other specialized tools.
Multiple Access limit: Excel is a desktop software that requires a download and installation. This may not be ideal for users who need to access their charts from multiple devices or do not have access to a computer with Excel installed.
Limited collaboration: Sharing and collaborating on line charts created in Excel may be more challenging compared to using online platforms designed for collaboration.
In summary, while Excel offers a wide range of customization options and is widely used, it may have limitations in design capabilities and collaboration. It is essential to consider these pros and cons when deciding whether to use Excel for creating line charts.
How to Make a Line Chart in Boardmix
Boardmix is a powerful online platform that provides users with a wide range of templates and tools for creating various types of visual content, including line charts. With its user-friendly interface and extensive customization options, Boardmix is an excellent choice for those who want to create professional-looking line charts without needing advanced design skills.

Here is the process of making a line chart in boardmix:
- Create a new board: Sign up for a free Boardmix account, and create a new board.

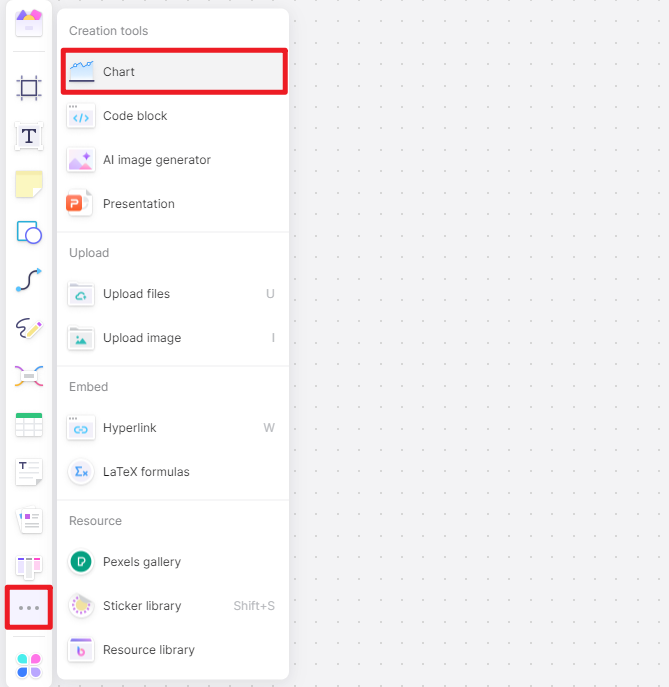
- Insert a line chart: Click on the 3-dot menu in the left corner and you will see a creation tools page, click on "Chart" and then choose “line chart.”
- Input your data: After selecting the line chart, input the relevant data on the chart editing page in the upper right corner.
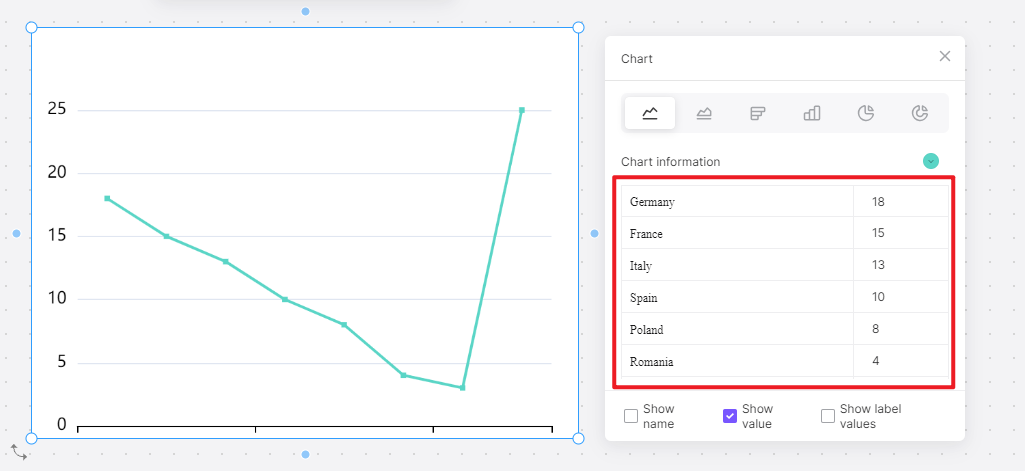
- Customize your chart: Once you have selected a template, you can begin customizing it to suit your preferences. Boardmix offers a range of design elements that you can add or remove from your line chart, such as axes, legends, and gridlines.

- Share your line chart: Once you have finalized your line chart, you can export it or share your line chart directly from Boardmix via a shareable link or by embedding it into your website or blog.

How to Choose: Make a Line Chart in Excel or in Boardmix
When it comes to data visualization, choosing between making a line chart online in Excel or using Boardmix can depend on several factors. In Excel, line charts are easy to create and manipulate, making it a popular choice for many users. With its wide range of customization options, Excel allows users to adjust the chart's appearance, add labels, and even create multiple lines on the same chart to compare data sets. Furthermore, Excel offers a variety of data analysis tools that can be used in conjunction with the line chart, enabling users to perform calculations and derive insights directly from the data.
On the other hand, Boardmix offers a more intuitive and user-friendly experience. Its drag-and-drop interface allows for quick chart creation and customization, making it ideal for users who are less familiar with Excel or prefer a simpler approach. Boardmix also offers real-time collaboration features, allowing multiple users to work on the same chart simultaneously, making it a great choice for teamwork and remote work scenarios. Additionally, Boardmix offers a variety of pre-designed templates and themes, which can save time and effort in creating aesthetically pleasing charts. So if you want to create higher-level line charts and require a strong collaboration between multiple people, then give Boardmix a try!


